Thomas Sobolik
Airflow is a popular open source platform that enables users to author, schedule, and monitor workflows programmatically. Airflow helps teams run complex pipelines that require task orchestration, dependency management, and efficient scheduling across many different tools. It’s particularly useful for creating data processing pipelines, orchestrating task-based workflows such as machine learning (ML) training, and running cloud services. Airflow is particularly popular in data processing use cases—the 2024 Airflow survey estimated that 85.5 percent of Airflow customers use it for orchestrating ETL/ELT pipelines.
Since Airflow workflows are defined as Python code, teams using Airflow can use their own version control to manage workflows more efficiently, automate the creation, scheduling, and provisioning of workflows, make workflows parameterizable and extensible, and more. Running workflows in production with Airflow requires that users keep track of a number of potential problems, including task failures and latency, task throttling, orphaned tasks, and more.
In this post, we’ll cover key Airflow metrics you should monitor to ensure that your workflows are reliable and performant. But first, we’ll explore some fundamental Airflow concepts that affect your monitoring approach.
How Airflow works
To aid in our discussion of key metrics for monitoring Airflow, let’s introduce the central concept of Directed Acyclic Graphs (DAGs) and the key components of a typical production-ready Airflow deployment.
What are DAGs in Airflow?
DAGs are the Python-based abstractions used by Airflow for defining workflows as code. When you deploy an Airflow workflow, Airflow’s scheduler will parse your DAGs in order to schedule and run their defined tasks. DAGs define the hierarchy and dependency mapping of tasks. Each task performs a discrete unit of work, such as a transforming data, loading data from storage, or calling an external service. DAG runs can contain many points of failure, as well as dynamic or conditional behavior that can produce many variations in how each job runs.
The scheduler
In an Airflow deployment, DAG runs are managed by the scheduler, which triggers scheduled workflows and submits tasks to be executed. The mechanism through which task instances are run is called the executor. Different executors can be written for different execution patterns, such as batch executors and containerized executors. The executor runs as a process on the scheduler and assigns tasks to workers for execution.
The worker pool
Airflow deployments rely on workers to run tasks. In a simple deployment, the worker is a process next to the scheduler. In larger deployments, a pool of workers is used to distribute tasks across multi-node clusters. Airflow workers are most commonly implemented using either Celery or Kubernetes. The CeleryExecutor sends commands to Celery’s broker, which efficiently assigns them to Celery workers for execution. Alternatively, the KubernetesExecutor can be used to run workers in a Kubernetes cluster. Kubernetes lets you allocate pods dynamically when a DAG submits a task to the scheduler. It’s also possible to deploy the scheduler and other Airflow components in a Kubernetes cluster.
The triggerer and deferrable operators
Even with this dynamic infrastructure for handling tasks, Airflow deployments can still run into inefficiencies in the orchestration of DAGs and tasks. Standard DAG operators occupy a full worker slot for their entire runtimes, even while they are idle (i.e., waiting for something else to happen before they continue executing). The triggerer helps with this by letting you run deferrable operators, which can suspend themselves and free up their workers for new processes—this is called deferring.
The triggerer runs triggers, which are small, asynchronous Python routines. Deferring passes the polling or waiting required by the operator to the relevant trigger, which runs periodically until the source task can be picked up again and rescheduled by the scheduler.
Putting it all together
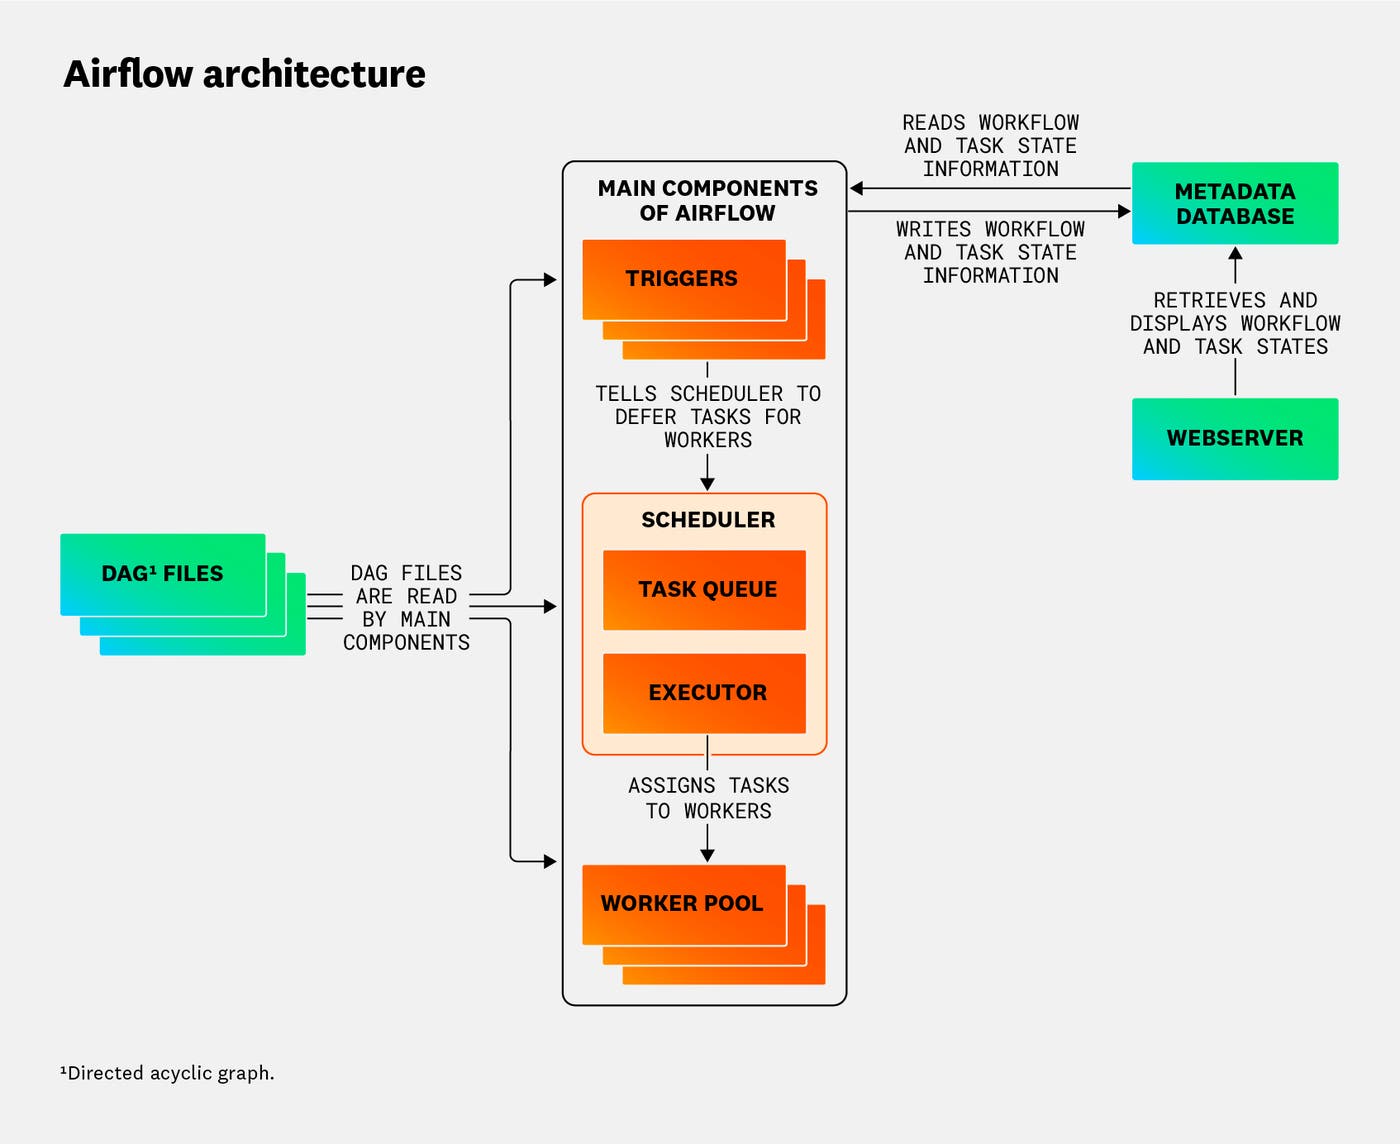
Airflow deployments also include a metadata database to store state information for workflows and tasks, and a webserver that provides a local interface for inspecting, manually triggering, and debugging workflows. The following diagram shows a typical Airflow deployment and how all these components work together to orchestrate a pipeline:

Next, we’ll introduce key metrics to help you track common issues and monitor the overall health and performance of your Airflow deployment.
Key Airflow metrics to monitor
Now that we’ve brushed up on Airflow, let’s go through the most important metrics to monitor for maintaining the health and performance of your Airflow workflows. There are a number of key monitoring challenges to keep in mind when choosing metrics to monitor Airflow:
- Spotting failed task runs and run latency, to optimize the performance of DAGs and prevent issues such as data syntax errors
- Preventing throttling tasks and exceeding concurrency limits, to keep worker pools healthy and performant and to ensure that tasks are scheduled and executed efficiently
- Ensuring the scheduler is healthy and the queue is working correctly, to prevent tasks from being blocked
- Ensuring orphaned and zombie tasks are managed correctly, to prevent resource overconsumption in the scheduler and worker pools
- Troubleshooting blocking operations in triggers, to keep the triggerer running efficiently
To help you tackle these challenges, Airflow offers a suite of out-of-the-box metrics that can be collected using StatsD. Next, we’ll explore the most important ones to track in the following categories:
DAG run metrics
Latency and error monitoring for DAG runs is crucial to optimize the performance of your DAGs. Airflow collects metrics for DAG runs that can provide insight into how well your tasks are running and point toward sources of latency. This includes gauges for the number of failed and successful tasks, as well as the average duration of failed runs, successful runs, and all runs. DAGs can fail in a number of ways, including errors in task code, timeouts from an API call or service dependency, tasks running out of order, and more. It’s generally recommended to keep your DAGs idempotent and ensure tasks are atomic—atomizing tasks supports idempotence by ensuring tasks can be re-run independently from one another.
| Metric | Description | Metric type |
|---|---|---|
| Task failure count | The number of failed tasks | Work: Errors |
| Operator failure count | The number of errors reported for a specific operator | Work: Errors |
| DAG run duration | The amount of time it took for a DAG run to complete | Work: Performance |
Metric to alert on: task failures (airflow.task.failed.count)
Alerting on task failures helps you find problems like code issues in DAGs, external API failures, upstream dependency failures, and infrastructure issues before they expand to harm the rest of your system. New task failures can cause further issues down the task execution chain or lead to infrastructure overconsumption if the failed tasks are configured to automatically retry at a high frequency. For instance, failures in an upstream task that edits data in a database could cause failures in downstream tasks that read from the database. With prompt incident response, these issues can be mitigated before they create broad impacts within your system.
Metric to alert on: operator failures (operator.failures.<operator_name>)
Airflow operators are predefined templates that can be instantiated as tasks within DAGs. By collecting the failures of specific key operators in your Airflow stack, you can set stricter alerts for the more critical tasks. The operator.failures metric aggregates across all DAGs that use this operator, which can be advantageous for correlating issues across DAGs that are related to a code error in one widely reused operator. For instance, the SQLExecuteQueryOperator is frequently used by teams writing Airflow tasks to execute read and write operations on databases. An issue such as misconfigured authentication could lead to failures in this operator across all its instances in your DAGs. Rather than receiving a series of notifications for seemingly unrelated DAG failures, you can quickly arrive at the common issue with the SQLExecuteQueryOperator by alerting on operator.failures.SQLExecuteQueryOperator.
Metric to watch: DAG run duration (dagrun.duration.success and dagrun.duration.failed)
High DAG run duration can point to a number of causes of latency, including slow task code, latency in a dependency call, and underprovisioned infrastructure. When you see DAGs taking longer to run than expected, that can signal the need to audit recent code changes, look at infrastructure capacity, or examine scheduler and triggerer performance. This metric only reports after DAG runs finish, however, so you may see other symptoms of degradation show up before this metric reaches an abnormal state.
Scheduler and executor metrics
The scheduler needs to queue and execute tasks efficiently in order for your workflows to run smoothly. Monitoring scheduler and executor activity can help you spot issues with orphaned tasks, zombie tasks, high schedule delay, and other potential problems. Airflow collects metrics to help you track tasks’ schedule delay, monitor the scheduler’s critical section (where tasks transition from the queue to the executor), track orphaned tasks, and more.
| Metric | Description | Metric type |
|---|---|---|
| Scheduler heartbeats | The scheduler’s current health status | Resource: Availability |
| Number of queued tasks | The number of tasks currently queued for execution | Work: Throughput |
| Schedule delay | The time interval between when a DAG was scheduled and when it started | Work: Performance |
Metric to alert on: scheduler heartbeats (scheduler.heartbeats)
The scheduler emits heartbeats to report its healthy status. A high time gap between heartbeats (over 60 seconds) indicates that the scheduler is likely down or unresponsive, and unable to send tasks to be run. This is most commonly caused by resource exhaustion and can be resolved by adding concurrency to the scheduler pool and restarting the scheduler.
Scheduler outages can also be caused by significant delays in DAG file parsing, due to large DAG files or DAGs with slow database or API queries required for parsing. By setting the dag_processor_timeout appropriately, you can prevent slow or stuck DAGs from affecting scheduler performance.
Metric to watch: number of queued tasks (executor.queued_tasks)
In an optimal scenario, the number of tasks in the queue will follow a fairly consistent pattern, as DAG runs generally repeat on a regular cadence. If the number of queued tasks rises over time, this can indicate elevated DAG processing times, scheduler misconfigurations, or resource exhaustion in the worker pool. By watching for a rising trend in the number of queued tasks, you can identify when the scheduler is no longer able to efficiently send tasks to executors, or tasks are taking too long to run.
Another significant cause of scheduler lag and rising queued tasks is mishandled orphaned tasks. When the scheduler is restarted, tasks that were currently queued or running can become orphaned when they no longer have an associated DAG. The scheduler performs automated cleanup to adopt or kill orphaned tasks, but if this fails, they will persist in their queued or running state and expend resources.
Metric to watch: schedule delay (dagrun.schedule_delay)
Monitoring the schedule delay of your DAG runs tells you the difference between the time each DAG run was scheduled and the time it began execution. This helps you break down the impacts of elevated scheduler lag across your DAGs, including delayed or improper data processing. A high schedule delay for a particular DAG when the rest of the queue looks normal can indicate issues with that DAG’s processing—you can then inspect the relevant DAG processor logs for errors.
Worker pool metrics
In distributed Airflow deployments that rely on a worker pool to execute tasks, it’s paramount to monitor workers’ activity to ensure that workers are scaled appropriately and execute tasks efficiently. Airflow collects metrics for breaking down the activity of your pools’ active slots, as well as counting starving tasks, so you can identify when your workers are struggling and/or failing to meet the demand for task executions.
| Metric | Description | Metric type |
|---|---|---|
| Number of starving tasks | The number of queued tasks without an available worker pool slot | Resource: Availability |
| Number of running slots | The number of worker slots with a task currently running | Work: Throughput |
Metric to alert on: number of starving tasks (pool.starving_tasks)
When all pool slots are filled with queued or running tasks, tasks that are waiting for a slot to be allocated to them are considered starving. A healthy Airflow deployment will keep the number of starving tasks to a minimum to avoid running the pool too close to its infrastructure capacity. By alerting when there are more than three starving tasks in the queue for a significant period of time, you can take action to rightsize your pool before tasks become delayed for too long and cause potential downstream issues.
For example, if you have an ETL pipeline running on Airflow, and downstream services rely on the data it processes, delays in this processing can cause issues where data is unavailable or sent in an incomplete or malformatted state. Aside from simply increasing the size of the pool, you can implement task prioritization with the priority_weight parameter to ensure that high-priority tasks are never left starving, while other, lower-priority ones are allowed to wait.
Metric to alert on: number of running slots (pool.running_slots)
By alerting when the number of worker slots currently running tasks approaches the concurrency limit you’ve configured, you can add concurrency before the limit is exceeded— and tasks begin to starve. If the number of running slots increases steadily over time, there may be zombie tasks persisting despite the scheduler’s attempts at cleaning them up. Zombie tasks occur when workers are killed or reassigned so that a task’s associated job becomes inactive. If you find that pool slots are excessively occupied by queued tasks, you can consider adding triggers to your workload so that your pool can defer queued tasks and allow fresh ones to run on them.
Triggerer metrics
By letting you defer worker slots to run new tasks while queued tasks are still waiting to execute, the triggerer helps you run your Airflow workloads more efficiently with minimal infrastructure overhead. By monitoring the triggerer, you can watch for failures and spot problems such as triggers blocking the main thread and infrastructure overconsumption.
| Metric | Description | Metric type |
|---|---|---|
| Triggerer heartbeats | The number of queued tasks without an available worker pool slot | Resource: Availability |
| Number of blocking triggerers | The number of triggerers currently blocking the main thread | Resource: Availability |
Metric to alert on: triggerer heartbeats (triggerer.heartbeat)
Like the scheduler, the triggerer emits heartbeats to report its healthy status. By alerting when more than 60 seconds elapse between heartbeats, you can easily detect triggerer outages. While the triggerer is down, deferred tasks can accumulate, which can overwhelm your system when the triggerer comes back online. To resolve this, you can temporarily add CPU and memory capacity to the triggerer as you bring it back online.
Metric to watch: number of triggerers blocking the main thread
Triggers that contain synchronous code or run long-lived tasks without proper asynchronous handling can block the triggerer’s main thread. Airflow logs these errors with a message like, “Triggerer’s async thread was blocked for 0.23 seconds, likely by a badly written trigger.” Triggerer blocking events can cause CPU and memory consumption to spike, as the triggerer can’t efficiently process the other triggers it needs to handle. You can solve this by refactoring your trigger code to avoid blocking operations, or by adding CPU and memory capacity to the triggerer.
Get visibility into your workflows
In this post, we looked at core Airflow concepts and explored the Airflow scheduler and executor, as well as the different types of task executions, including DAG runs. We also discussed key metrics for ensuring that each of these components is reliable and performant. Next, we’ll look at best practices for collecting Airflow telemetry, including metrics, logs, and lineage, and how to view this data using the Airflow web server interface and open-source tools.


