Thomas Sobolik
In Part 1 of this series, we discussed key metrics for monitoring Airflow. In Part 2, we discussed strategies for collecting Airflow metrics, logs, and lineage.
Finally, we will look at how you can use Datadog to monitor all this telemetry in a single consolidated view alongside telemetry from the rest of your infrastructure and services.
Monitor Airflow metrics with Datadog
Datadog’s Airflow integration enables you to ingest Airflow metrics into Datadog by using the Airflow StatsD plugin with DogStatsD. The DogStatsD mapper helps you import metric labels such as task_id and dag_id to tag your metrics with these facets in Datadog. This way, you can quickly filter your data on these tags within dashboards or monitors to streamline your troubleshooting when investigating issues such as high-latency tasks or code errors in operators.
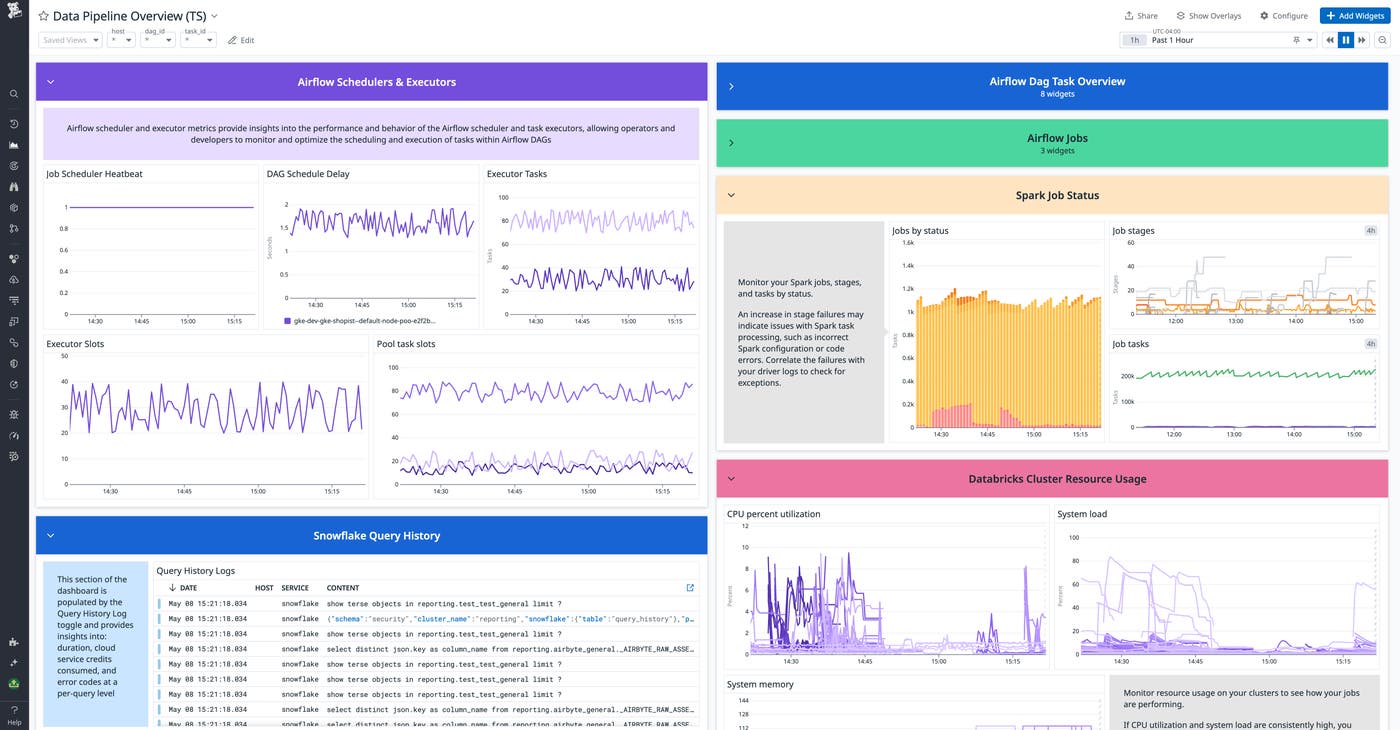
You can visualize Airflow metrics in the out-of-the-box dashboard or form your own pipeline health dashboards to correlate metrics from all your Airflow-orchestrated services. For instance, if you are monitoring a data pipeline orchestrated by Airflow, executing Spark jobs that run on Databricks clusters, and interfacing with a Snowflake database, a data pipeline dashboard could pull in infrastructure health, throughput, and error metrics from all these services.
Datadog Monitors make it easy to set alerts on key Airflow metrics and alert engineers of emergent problems. For example, you might set an alert on the number of running tasks to help manage your concurrency limit, or alert on key operator failures to spot bugs in your DAGs. Receiving timely notifications when these problems occur helps your teams manage their impact on your production systems.
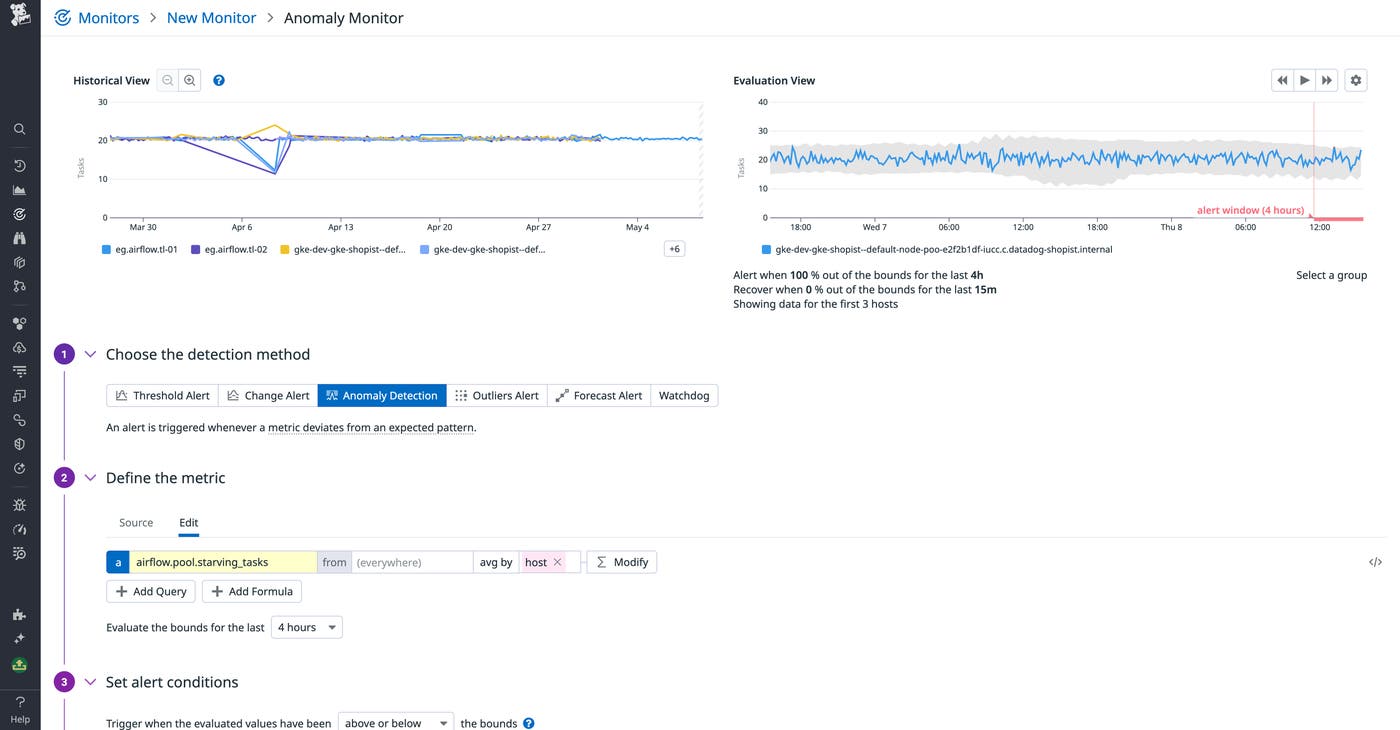
Let’s say we want to monitor whether our worker pool is utilizing its available task slots efficiently. For this, we can alert on the number of starving tasks to track situations where too many slots are in use to accommodate all the incoming tasks. By using an anomaly detection monitor, we can alert on cases where the starving task count deviates significantly from its established trend, which could indicate a lack of sufficient worker availability—as shown in the following screenshot.
To help you get started with alerting for Airflow, Datadog offers out-of-the-box monitor templates, covering DAG run duration, DAG run failures, and task instance failures. For more information about the Airflow integration, see our blog post.
Ingest Airflow logs into Datadog Log Management
By ingesting Airflow logs into Datadog Log Management, you can easily query, filter, and form metrics from them, and monitor them alongside logs from the rest of your workflows’ tech stack. Once you’ve set up the integration to ingest metrics, you can enable log collection by setting logs_enabled: true in your Agent configuration file (datadog.yaml).
Once configured, Datadog will collect Airflow logs with Log Management and display them within the Log Explorer. In a troubleshooting case, for instance, you can easily query for logs with the relevant DAG ID, operator ID, or task ID to investigate the root cause of latency or errors. Airflow traces are automatically correlated to associated logs, so you can also navigate directly from DAG run traces in APM or Data Jobs Monitoring (DJM) to quickly investigate errors or latency showing up in traces. When investigating an error in a DAG run trace, querying for related logs can reveal additional upstream problems that provide a clearer picture of the overall issue and bring your team closer to remediation.
Get insight into your Airflow pipelines with Data Jobs Monitoring
Datadog DJM enables you to proactively detect and quickly troubleshoot issues with individual DAGs. You can easily configure this using Airflow’s OpenLineage provider to send DAG run and lineage data from your task executions to DJM. This includes run-level metadata (execution time, state, parameters, etc.) as well as job-level metadata (owners, type, description, etc.).
DJM aggregates live data on each task execution for Airflow DAG runs, represented as Datadog traces. This enables you to monitor DAGs’ health and performance with granular trace analytics. To give your team timely notifications about this, you can use DJM’s Trace Analytics Monitor templates to set alerts on DAGs that fail or run for a duration beyond their SLO. You can also use DJM’s consolidated overview of DAG run performance to understand trends in DAG health and duration and discover problematic tasks. The following screenshot shows the DAG performance page in DJM.
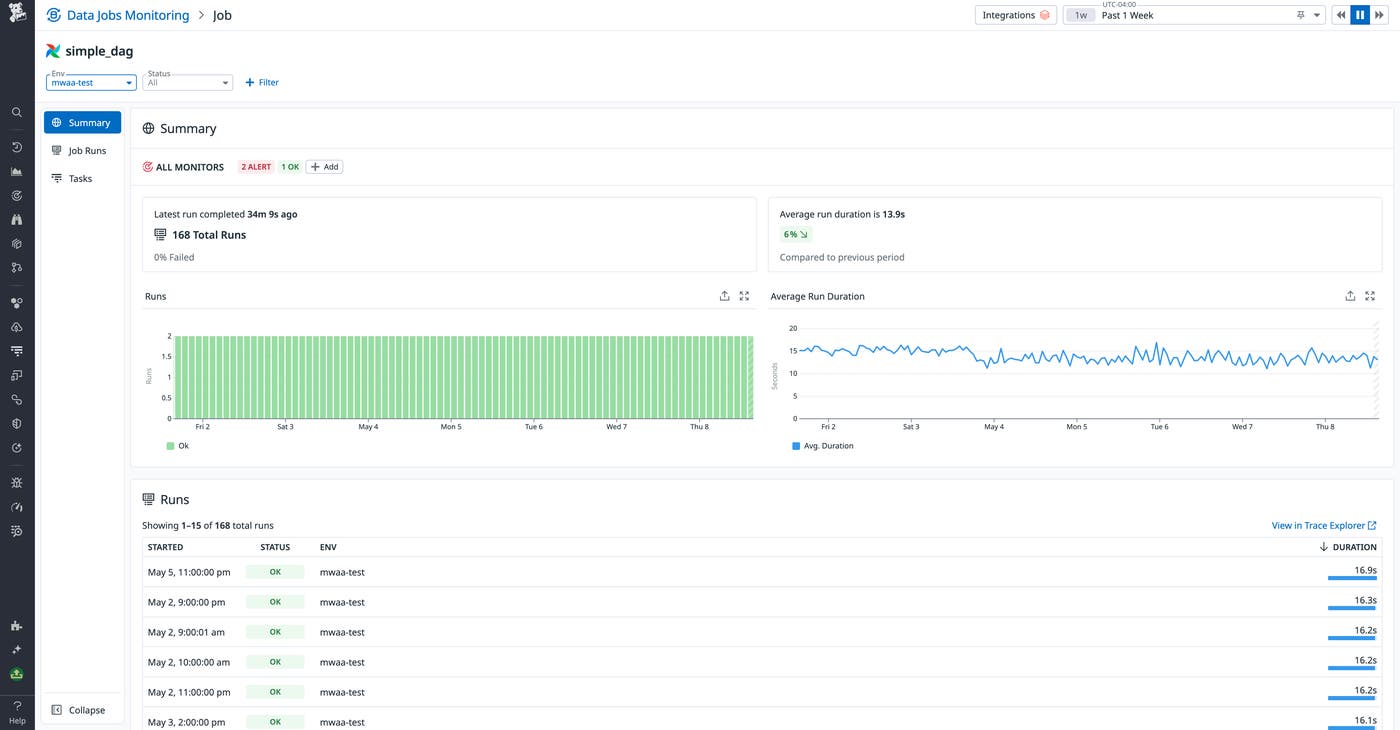
You can filter and sort the list of runs to surface high-latency or errored task executions and then drill into traces of individual job runs to kick off root cause analysis. Waterfall graphs surface all errors from runs and correlate relevant task logs within the same view. This way, you can more easily understand the factors that may have contributed to task failures or latency without needing to open the Airflow webserver interface.
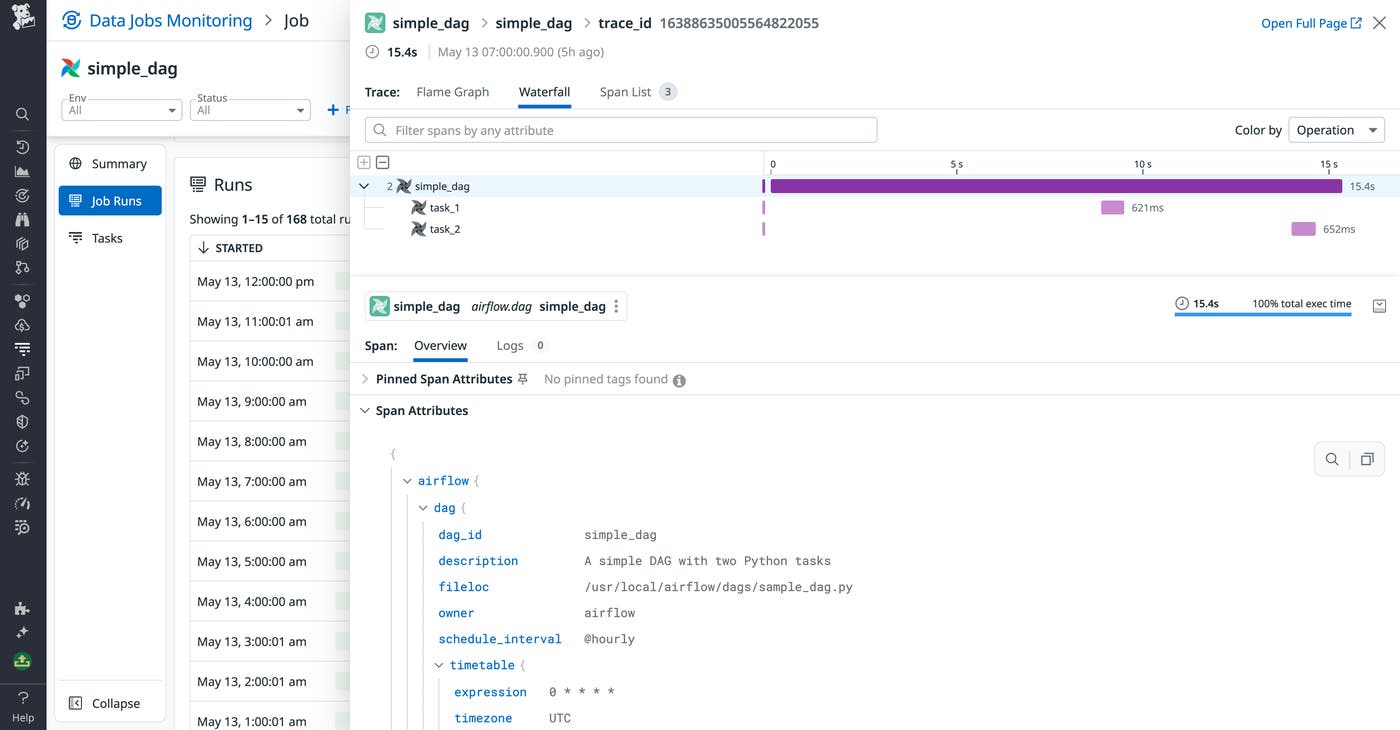
For your Airflow tasks that trigger Spark or dbt jobs, you can view Spark or dbt job run telemetry in context with the respective Airflow task automatically. This way, you can debug issues in both Airflow task executions and Spark or dbt job runs together in one interface.
Monitor your data pipelines with a single source of truth
In this post, we’ve shown how to collect telemetry data from Airflow with Datadog to monitor your workflows’ health and performance—alongside the other technologies supporting your applications. Datadog metrics monitoring, Log Management, and Data Jobs Monitoring can all work in concert to provide comprehensive visibility into your Airflow workflows.
To get started with Datadog’s Airflow integration, see the documentation. Full Airflow support within Data Jobs Monitoring is currently available in preview—you can sign up for access here. For more information about getting started with DJM, see the documentation.
If you’re brand new to Datadog, sign up for a free trial.
