Thomas Sobolik
In Part 1 of this series, we looked at key Airflow metrics to monitor. Now, we’ll explore how you can collect those metrics, along with logs and traces, using Airflow’s native tooling. We’ll also look at a few key ways you can monitor this data from within the Airflow webserver interface.
Collect Airflow metrics
Airflow allows you to send metrics to StatsD or OpenTelemetry for ingestion into your monitoring service. You can configure the ingestion to send or block only metrics in the following categories:
schedulerexecutordagrunpooltriggerercelery
This helps you customize your metrics intake to remove unwanted data, reduce noise, and save on intake costs for the managed services in your monitoring stack. For example, you won’t want to send Celery metrics if you’re using the KubernetesExecutor, or triggerer metrics if you aren’t using any deferrable operators.
Some Airflow metrics include labels, such as job_id, task_id, dag_id, or operator_name, to provide additional context for troubleshooting. For instance, by collecting operator.failures.<operator_name>, you can track the failures of particularly important operators that are widely used across your DAGs and understand which ones are failing the most.
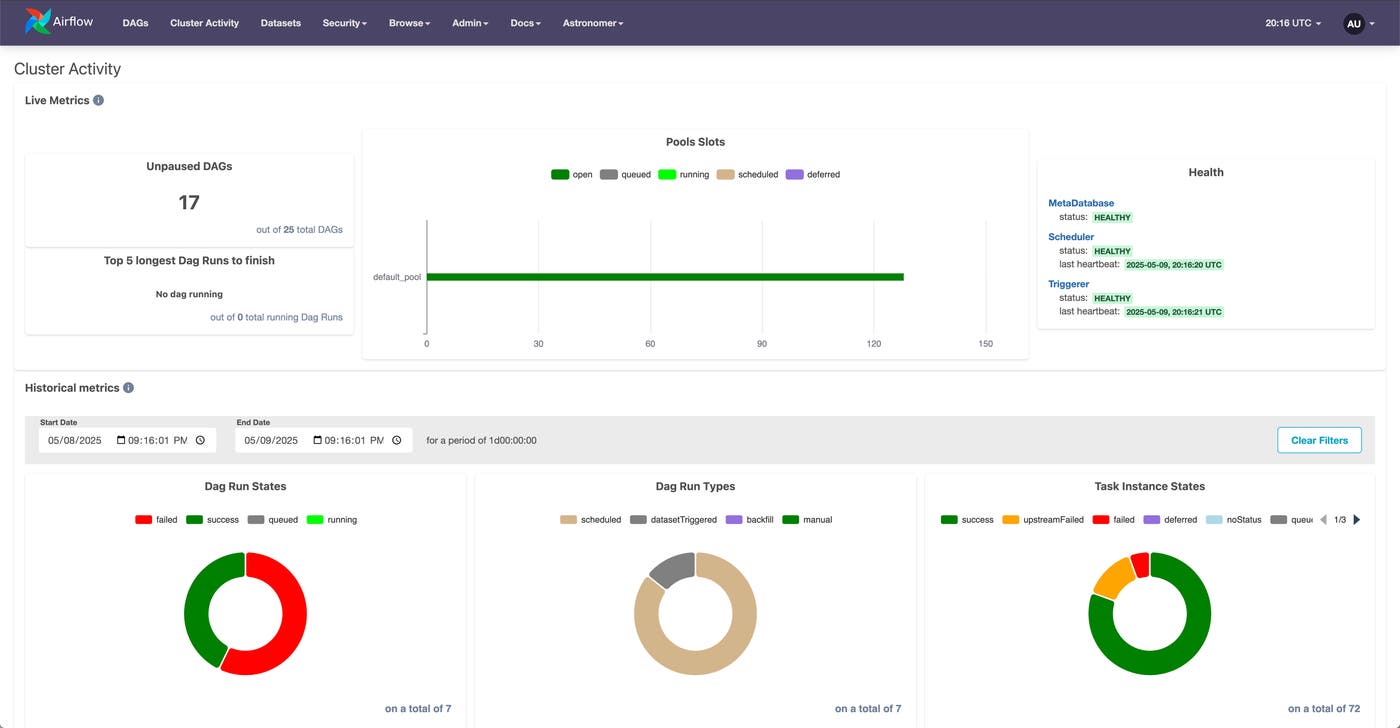
You can use the Airflow webserver interface to monitor Airflow metrics and health signals in a number of ways using a suite of included views and visualizations. The Cluster Activity View breaks down DAG run and task instance states (i.e., succeeded, failed, or queued) and shows the health of components including the triggerer, scheduler, and metadata database.
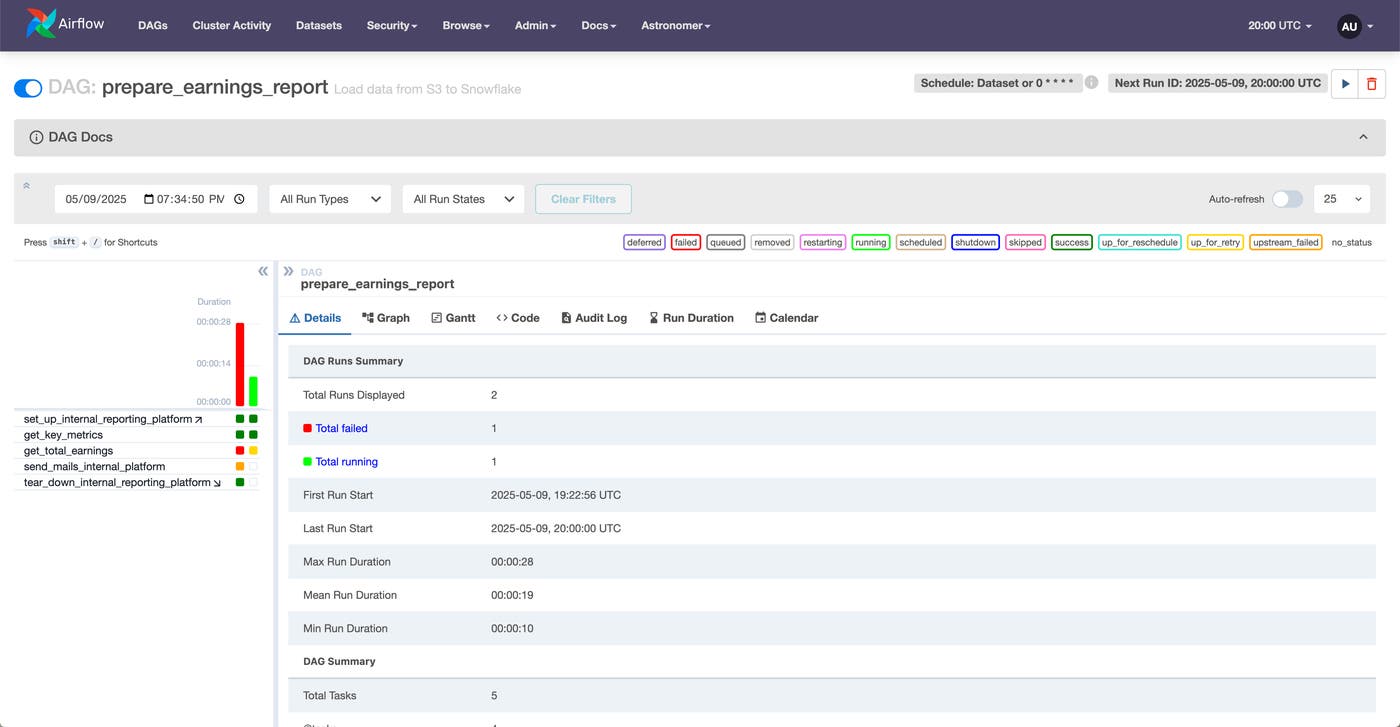
The Grid View lists DAG runs alongside their latencies and statuses. You can also use this view to drill into these metrics for specific task runs.
By using the Graph View, you can visualize the dependencies of your DAGs and spot latency and errors within them. For instance, the following screenshot shows the dependencies for the get_astronauts DAG, which contains two tasks: one that loads data about astronauts from a public dataset via an API, and another that processes and returns this data. If we see issues in either of these tasks, we can correlate them with event logs for task instances that accessed the database and look for underlying errors.
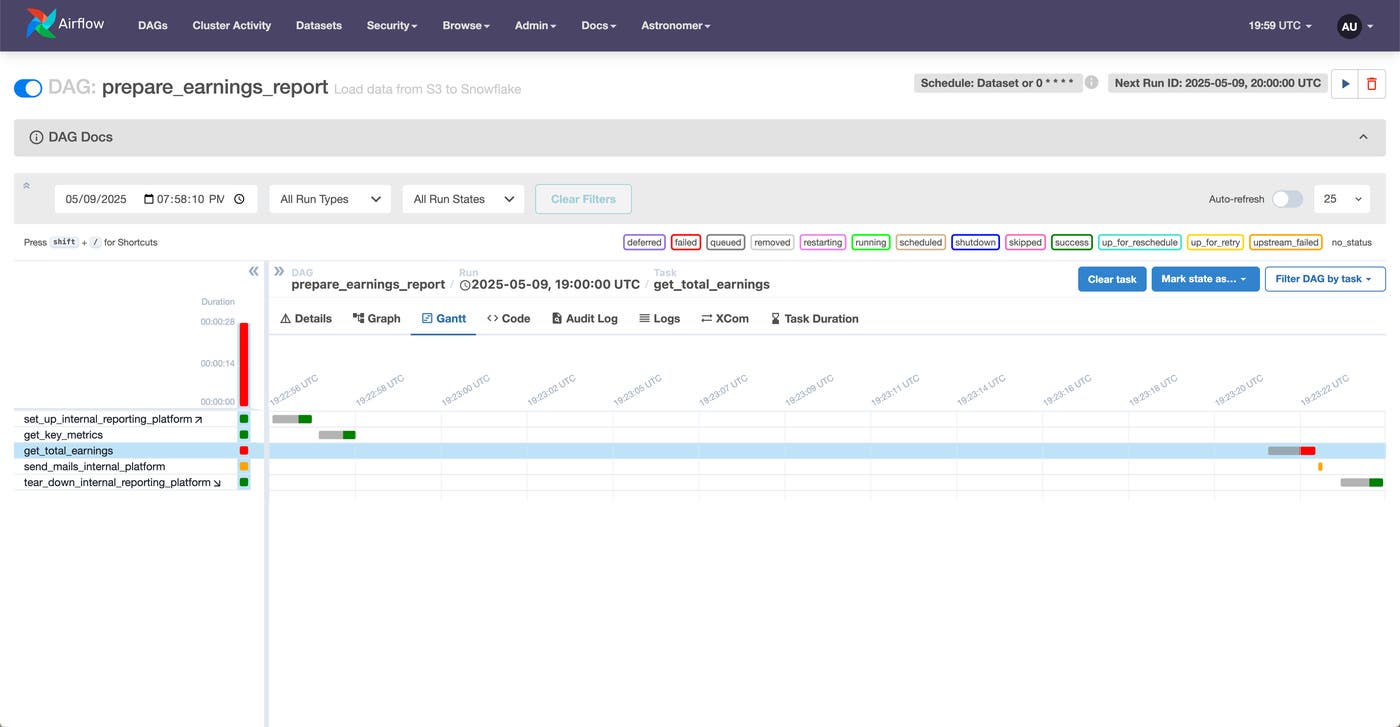
Finally, using the Gantt Chart helps you break down DAG run duration by task to spot the most significant sources of latency. For instance, you might see tasks spending an unusual amount of time in the queued state, which could suggest scheduling difficulties. You might see multiple tasks running concurrently for long periods of time, which could indicate throttling. Or, you might spot a single task taking an unusual amount of time to execute, which may reveal an opportunity for code optimization.
Logging DAG runs and Airflow component activity
By collecting logs from Airflow, you can more effectively troubleshoot and debug latency and errors in your pipelines. By default, Airflow writes logs to local file storage and the command line. You can use task handlers to enable writing Airflow logs to various cloud storage solutions, including Amazon S3, Azure Blob Storage, and Google Cloud Storage Buckets.
Airflow recommends FluentD as a logging solution for production workloads. FluentD is a simple, open source solution for adding a unified routing interface for log collection across multiple disparate sources. Using FluentD or a similar log collection service helps you more easily tune your log collection to reduce noise in your logs.
Next, we’ll discuss the two main log types—component logs and task logs—and explore what kinds of information you can glean from collecting them.
Component logs
Component logs record the activity of components, such as the scheduler, triggerer, and DAG processor. Airflow generates these component logs automatically, and you can configure them using the standard Python logging library’s filters and formatters. Many component logs are mostly useful for pre-production testing and debugging. To monitor a production Airflow system, logs should be collected for the scheduler and worker.
Next, we’ll talk about the kinds of data you can access by collecting scheduler and worker logs.
Scheduler logs
Scheduler logs contain critical information about the state of your task queue and the performance of DAG runs. The scheduler logs key Airflow runtime events, including:
- Routine DAG parsing to check for code changes
- Adding tasks to the queue and sending tasks to be executed
- Marking task instance successes and failures following execution
Collecting scheduler logs can help you troubleshoot issues with orphaned task cleanup, resource overconsumption in the scheduler, and other common scheduler problems.
Worker logs
Worker logs capture information about the runtimes of worker processes as tasks are submitted, run, and cleaned up. The worker pool logs key events such as:
- Starting and stopping the worker process
- Fetching a task from the queue to execute
- Beginning and completing execution of a task
- Any errors or exceptions that occurred during task execution
Collecting worker logs can help you diagnose task failures, spot mishandled zombie tasks, troubleshoot issues with workers going down or getting stuck due to resource overconsumption, and more.
Task logs
Task logs record data for specific DAG runs, enabling you to troubleshoot failed or retried task instances. Most operators include logging out of the box. By collecting these logs, you can trace the underlying causes of errors more quickly. The following example shows an error log for a PythonOperator task execution.
import loggingfrom airflow.decorators import task
task_logger = logging.getLogger("airflow.task")
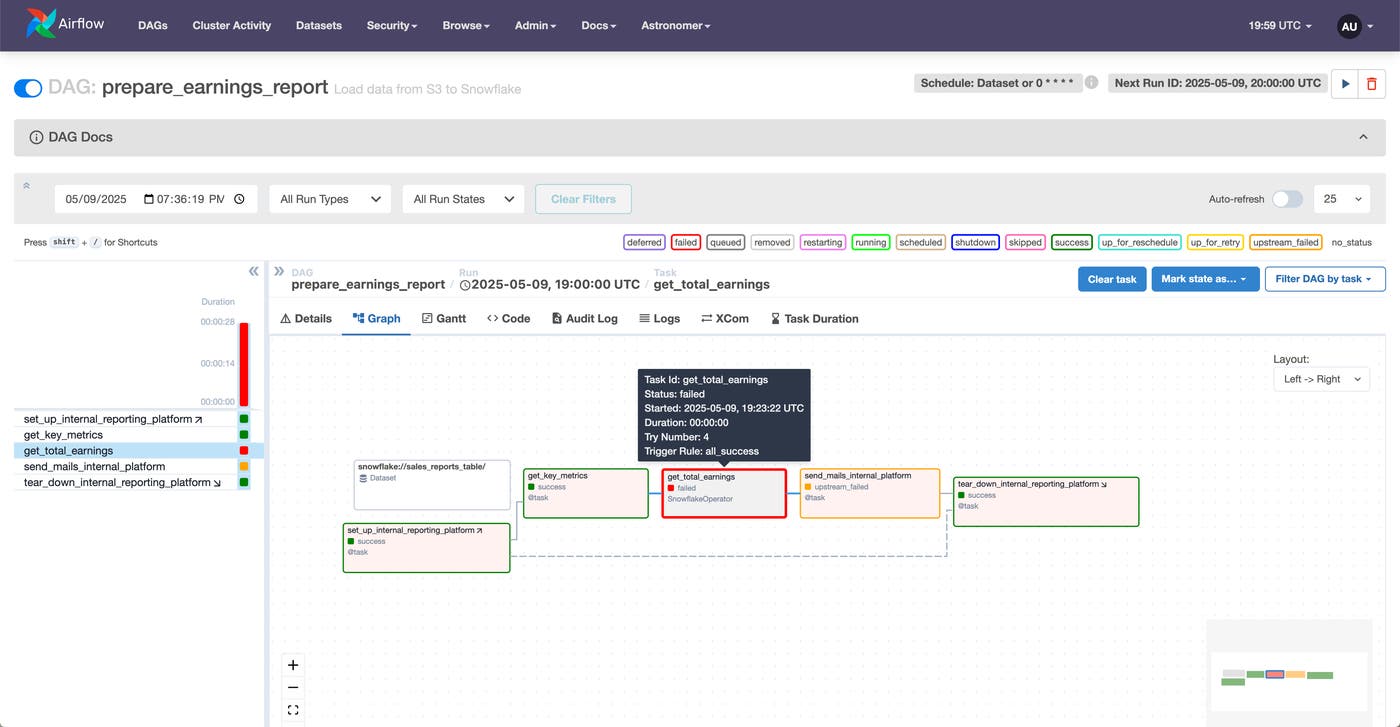
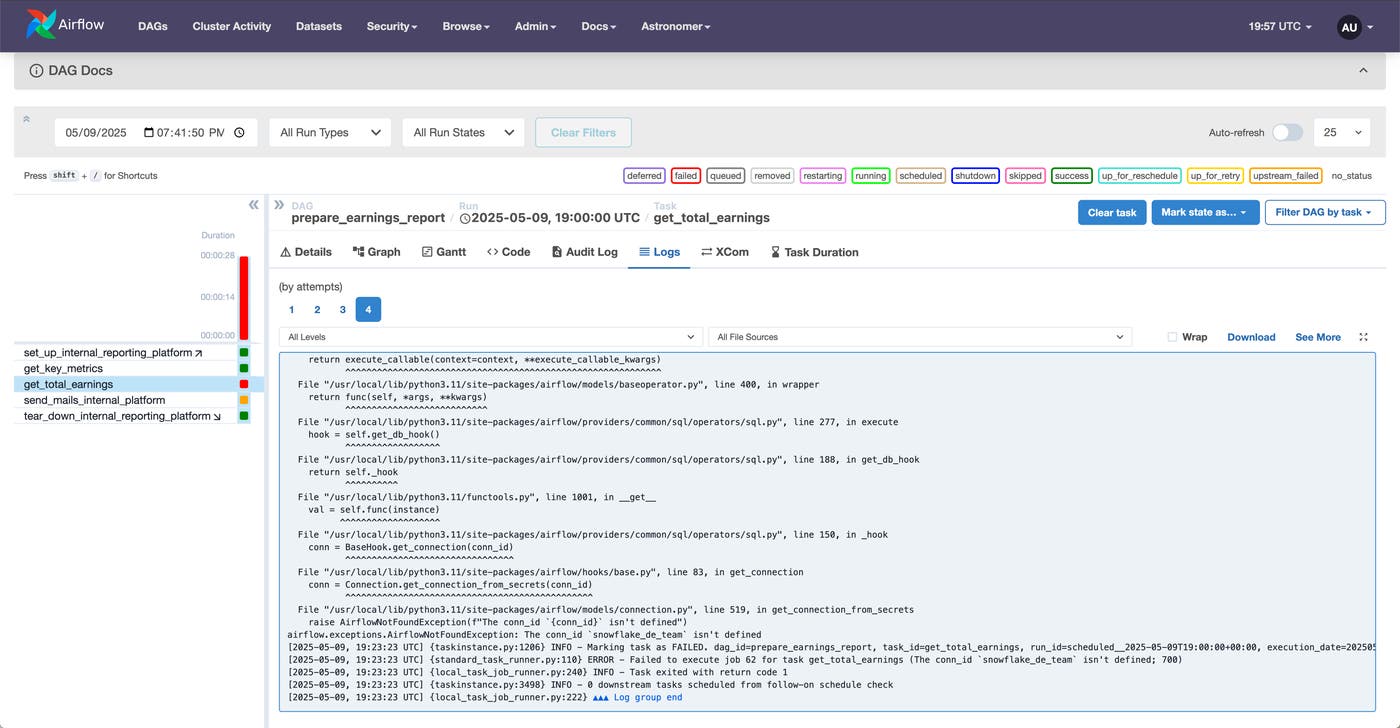
@task.external_python(python='/path/to/python')def my_task(param1, param2):# task code here task_logger.error("This log records an error")You can also write logs in your custom operators and tasks to ensure that these are also adequately monitored. To view task logs, you can select the corresponding task instance from the Airflow web UI’s Graph View for the corresponding DAG run and view that instance’s logs. For example, the following screenshot shows error logs for the get_total_earnings task of a failed prepare_earnings_report DAG run. We can see the full stacktrace for the error as well as task run logs showing how the system handled it.
Track Airflow data lineage with OpenLineage
Data lineage is a common method for tracing the activity of data pipelines. Lineage records the flow of data over time by creating events that record metadata for each pipeline step. This facilitates the mapping of dependencies in the data pipeline and provides tools for debugging data quality issues.
OpenLineage is a popular open-source solution for data lineage. Airflow includes an OpenLineage provider that enables you to send lineage events for task executions to record run metadata—including job start and end times, succeeded, failed, and paused states, etc.—and job metadata, such as data inputs and outputs, dataset names and namespaces, and job run context. This way, you can maintain a record of DAG activity that includes all data transformations made by your tasks, which can be monitored to spot points of failure in your pipeline and debug data processing errors.
You can configure the OpenLineage provider for your DAGs simply by installing the apache-airflow-providers-openlineage package and providing a Transport configuration in your airflow.cfg file, as shown in the following code snippet.
[openlineage]transport = {"type": "http", "url": "http://example.com:5000", "endpoint": "api/v1/lineage"}Many common Airflow operators are already set up to produce lineage data for OpenLineage instrumentation, including PythonOperator, BashOperator, SQLExecuteQueryOperator, various AWS, dbt, and Spark operators, and more. You can also collect lineage from your custom operators and PythonOperator by using hooks in Airflow 2.10+. You will need to set up a backend to store the lineage data and a frontend to visualize it. Marquez is a popular open source solution for this, or you can use a monitoring platform like Datadog. We’ll discuss this further in Part 3.
Monitor metrics, logs, and traces for your Airflow deployment
In this post, we looked at how you can use Airflow’s native monitoring tools to collect metrics, logs, and traces to monitor the health and performance of your Airflow pipelines. In Part 3, we’ll show how you can use Datadog’s Airflow integration, Log Management, APM, and Data Jobs Monitoring to get comprehensive visibility into Airflow.

