Jordan Obey
In part 1 of this series, we introduced the key Cloud Run metrics you should be monitoring to ensure that your serverless containerized applications are reliable and can maintain optimal performance. In part 2, we walked through a couple of Google Cloud’s built-in monitoring tools that you can use to view those key metrics and check on the health, status, and performance of your serverless containers. We also looked at different methods of accessing Cloud Run logs and distributed traces for a more complete view of your environment.
In this post, we’ll look at how you can use Datadog to collect and visualize Cloud Run metrics, traces, and logs. We’ll also look at how Datadog ties all of this telemetry together so that you can quickly pinpoint potential root causes of an issue and begin troubleshooting.
Enabling the Cloud Run integration and instrumenting your application
Datadog offers Cloud Run metric collection and visualization through its Google Cloud integration. To set up the Google Cloud integration, you need to use service account impersonation, which will enable Datadog to gain visibility into your serverless containerized workloads. You also need to make sure that this list of APIs are enabled and that none of the Google Cloud projects you plan to monitor are configured as scoping projects that pull in metrics from several other projects.
You can then follow these steps to create a service account, add a Datadog principal (allowing Datadog to access the Google Cloud resources you want to monitor), and complete setting up the integration.
In addition to our integration, you can get even deeper visibility with tracing, custom metrics, and direct log collection by instrumenting your Cloud Run application for Datadog Serverless monitoring. The default methodology for instrumenting a Cloud Run application is through a sidecar container, which will run alongside your Cloud Run Functions as it collects critical monitoring data.
You can also instrument a Cloud Run application through either a Dockerfile or buildpack. Instrumenting Cloud Run via a Dockerfile utilizes a lightweight serverless-init tool, which wraps your Cloud Run application and executes it as a subprocess, ensuring detailed metrics, traces, and logs are collected. The serverless-init tool starts a DogStatsD listener for performance metrics and a trace agent for distributed tracing, and captures logs by wrapping the stdout and stderr streams. This allows you to monitor the health and performance of your application in real time without altering your core code. For full instrumentation, make sure that datadog-init is set as the entrypoint or the first command in your Dockerfile, ensuring that all data is sent to Datadog for comprehensive monitoring of container instances.
For more guidance on instrumenting your Cloud Run application to enable tracing, custom metrics, and direct log collection, read our documentation.
Visualize Cloud Run metrics
Once the Cloud Run integration is enabled and set up, Datadog will automatically start collecting monitoring data from your serverless containers and populating an out-of-the-box dashboard with key metrics covered in part 1.
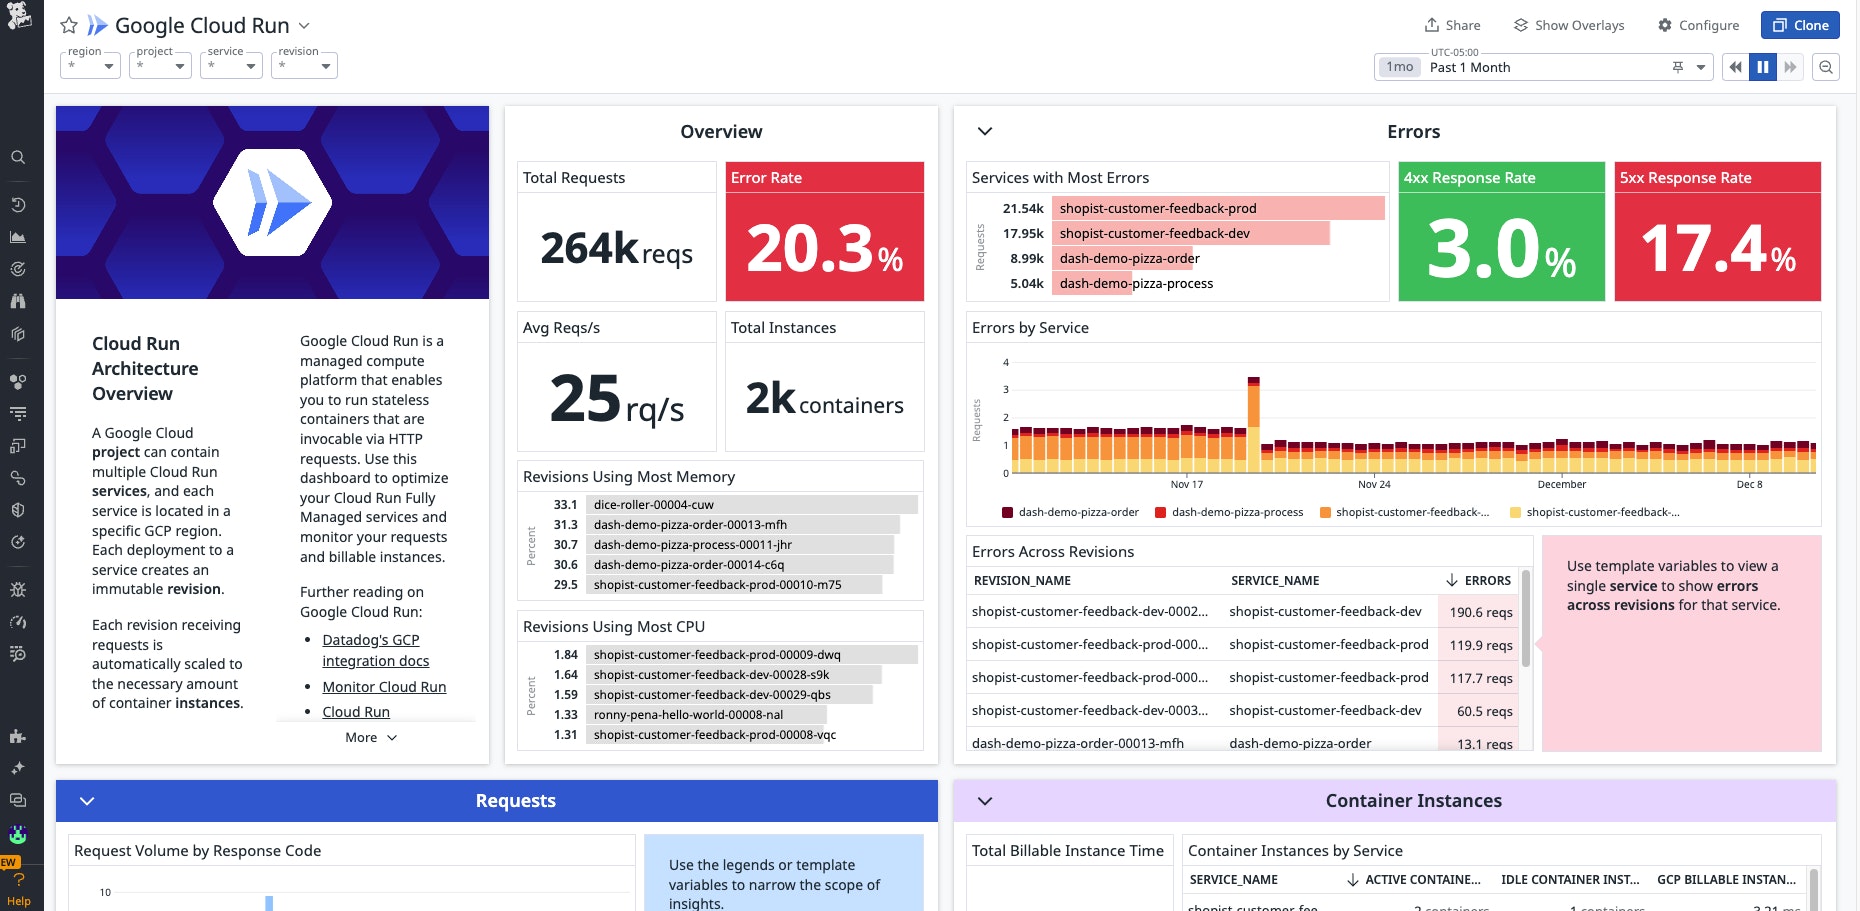
The Cloud Run dashboard includes an overview widget, enabling you to quickly gauge the state of your Cloud Run environment, including a count of serverless containers and requests, the rate of errors, and top lists of revisions using the most memory and CPU.
You can also use the dashboard’s region, project, service, and revision template variables to narrow your view down to monitoring data from the specific Cloud Run resources you want to investigate. For example, if you run an e-commerce site and want to focus on data from an ‘order-processing’ service, you can use the service template variable to investigate the health and performance of that specific service. By filtering your view down to a specific service, you can compare and contrast the resource usage and performance of different revisions of the same service to determine their health and efficiency.
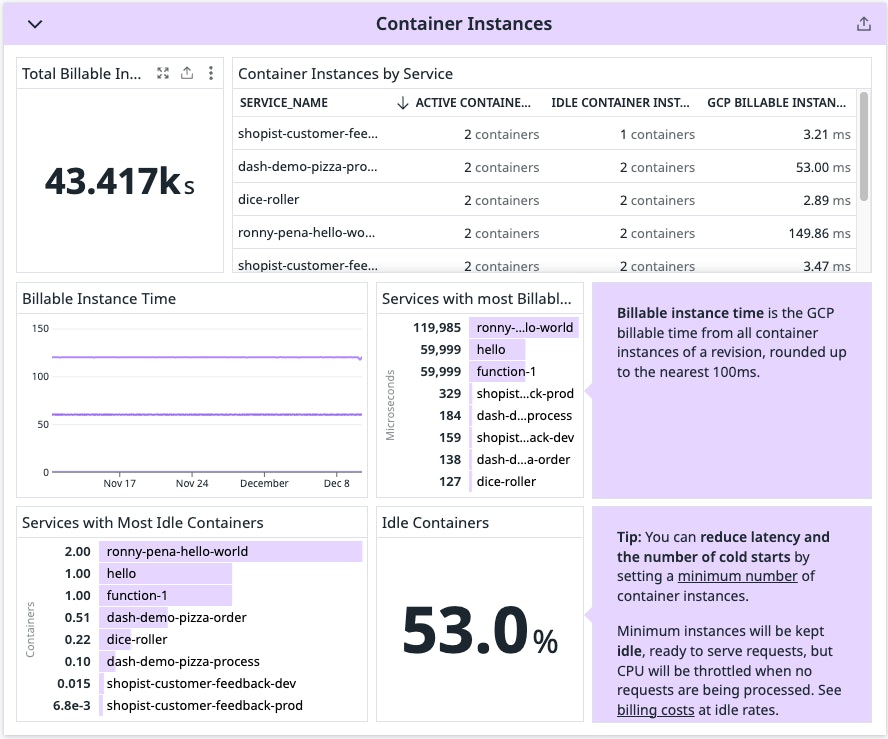
Monitor container metrics
Datadog’s out-of-the-box Cloud Run dashboard enables you to view key container data such as billable instance time, the number of containers allocated to each service, a breakdown of idle containers, and resource usage across your containers—all in a single location.

In addition to giving an overview of your Cloud Run health and performance, this data can help you rightsize and configure your containerized serverless application. For example, you can monitor the billable instance time and resource usage of a service to determine whether your instances are underutilized, which may indicate over-provisioning of resources, or overutilized, suggesting a need for more resources or adjustment of concurrency settings. By analyzing these metrics, you can adjust the allocated CPU and memory to better match your application’s needs, ultimately optimizing performance while reducing costs.
Monitor request metrics
To effectively manage Cloud Run services, it’s crucial to visualize the request metrics such as the volume and latency of incoming requests. For instance, by monitoring the volume of incoming requests, you can then correlate that data with the resource usage of a service, ensuring that allocated resources are sufficient to handle the traffic without over-provisioning.

Additionally, visualizing latency trends can help you identify bottlenecks or performance issues, enabling timely adjustments to resource allocations or concurrency settings to maintain a responsive service.
Monitor job metrics
Datadog can also collect and visualize critical Cloud Run job metrics such as a count of task attempts and completions, as well as a count of running and completed executions. Keeping track of these metrics helps you monitor the health, performance, and reliability of your Cloud Run jobs. By analyzing task attempts and completions, you can identify trends in job success rates and detect potential failures early. For example, if there is a sudden drop in a job’s execution completion rate, that may be a signal of a failure in the execution environment or a recent change in the job’s logic. Identifying these patterns early allows you to investigate and resolve issues before they escalate, minimizing downtime and ensuring consistent performance of your Cloud Run job.
Detect Cloud Run issues early with automatic alerts
Our Cloud Run integration allows you to set up critical alerts that help maintain the health and efficiency of your services. For instance, you can set up alerts for a high rate of 5xx or 4xx errors, enabling you to quickly address issues that may be negatively impacting user experience. Additionally, alerting on the billable instance time of a service helps you monitor cost efficiency by notifying you when instances are running longer than expected. In the screenshot below, we see that the billable instance time of a service has suddenly spiked above a set threshold of 2 seconds, which will trigger an alert and kick start mitigation.
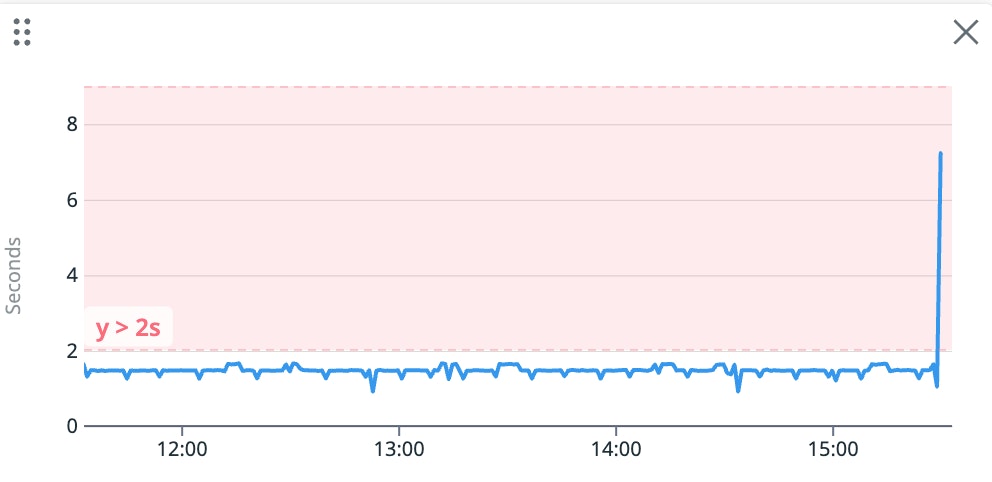
Alerts on resource usage, such as CPU and memory, ensure that your service is operating within optimal parameters, allowing you to take action before performance issues arise.
Monitor Cloud Run application performance with Datadog Serverless monitoring and distributed tracing
In addition to the out-of-the-box dashboard, you can view Cloud Run monitoring data within the Datadog Serverless view, which surfaces key metrics alongside traces and logs so you can spot errors and quickly pivot between them all.
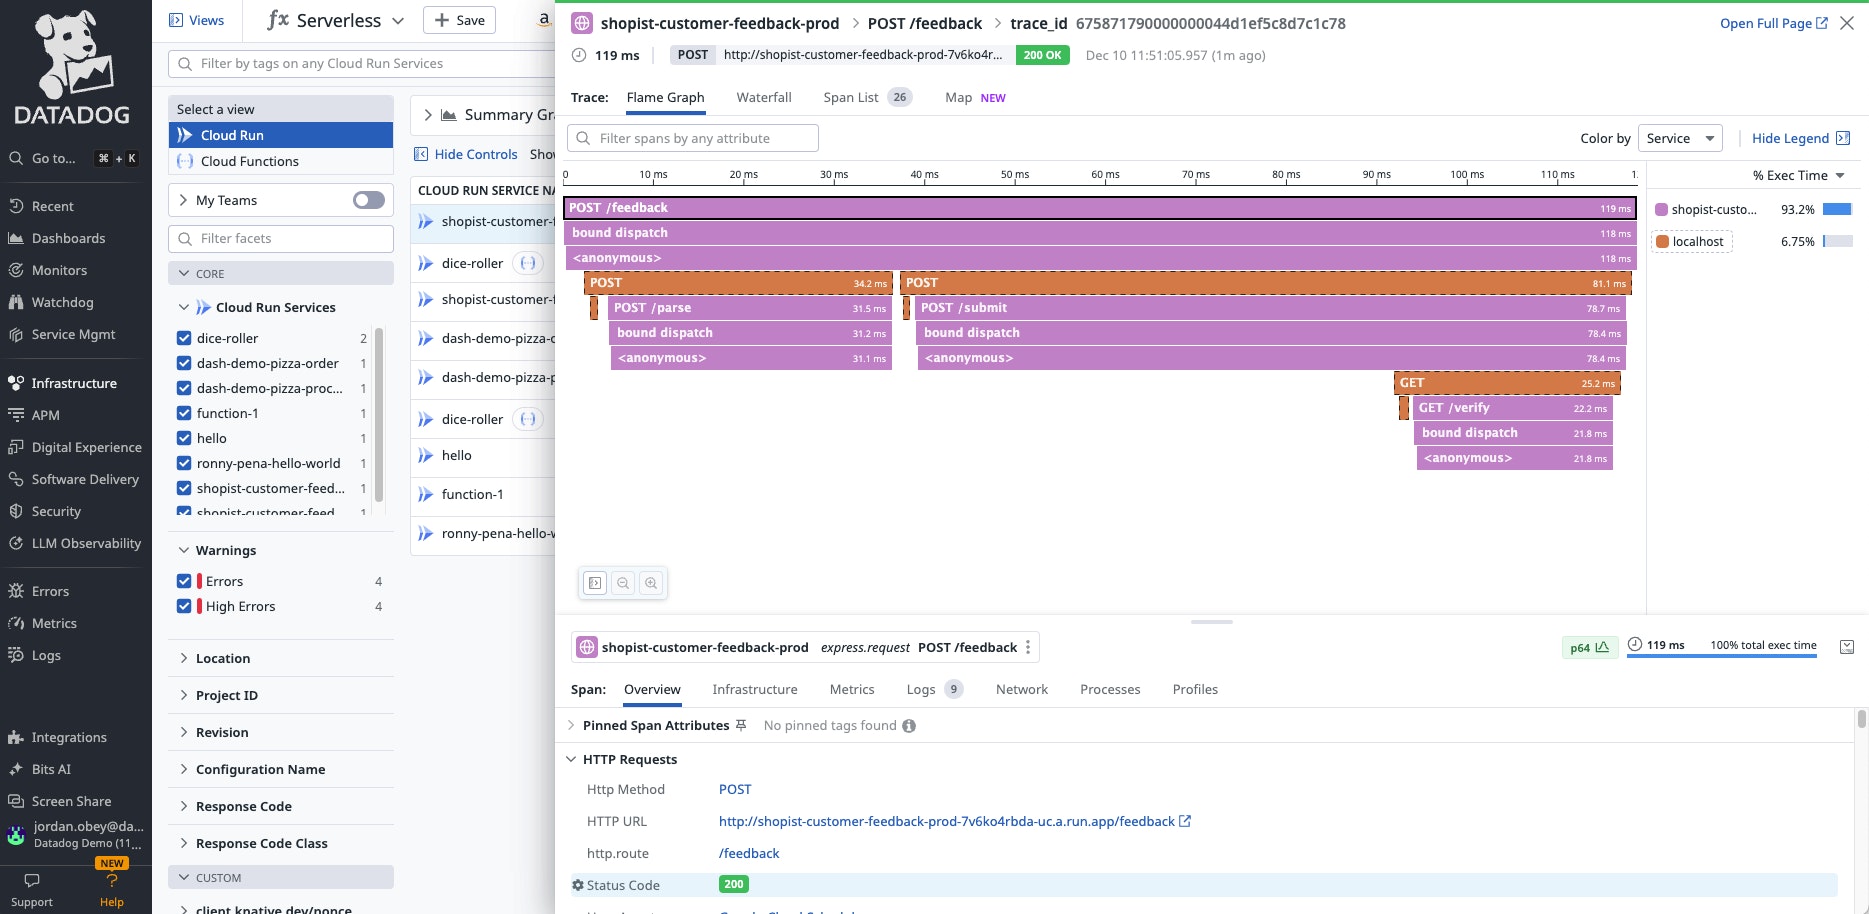
After you’ve instrumented your Cloud Run service, Datadog will automatically visualize Cloud Run request traces as flame graphs so that you can quickly spot when and where errors occur. You’re also notified of cold starts, prompting you to optimize your service configuration by adjusting the minimum instance setting to keep a warm instance ready—reducing the likelihood of future cold starts. Additionally, you can analyze the flame graph to identify bottlenecks during the cold start and explore other optimizations such as caching, pre-warming containers, or optimizing initialization code to further minimize startup latency.
Read here to learn more about using Datadog Serverless APM to monitor Cloud Run.
Collect Cloud Run logs
If you are already using the Datadog Google Cloud integration, then Cloud Run logs will automatically be collected. Otherwise, if you have instrumented your serverless application you will need to set the DD_LOGS_ENABLED environment variable true within your cloud provider’s environment settings or in your container configuration (such as your Dockerfile or deployment scripts) to ensure that application logs are captured and sent to Datadog.
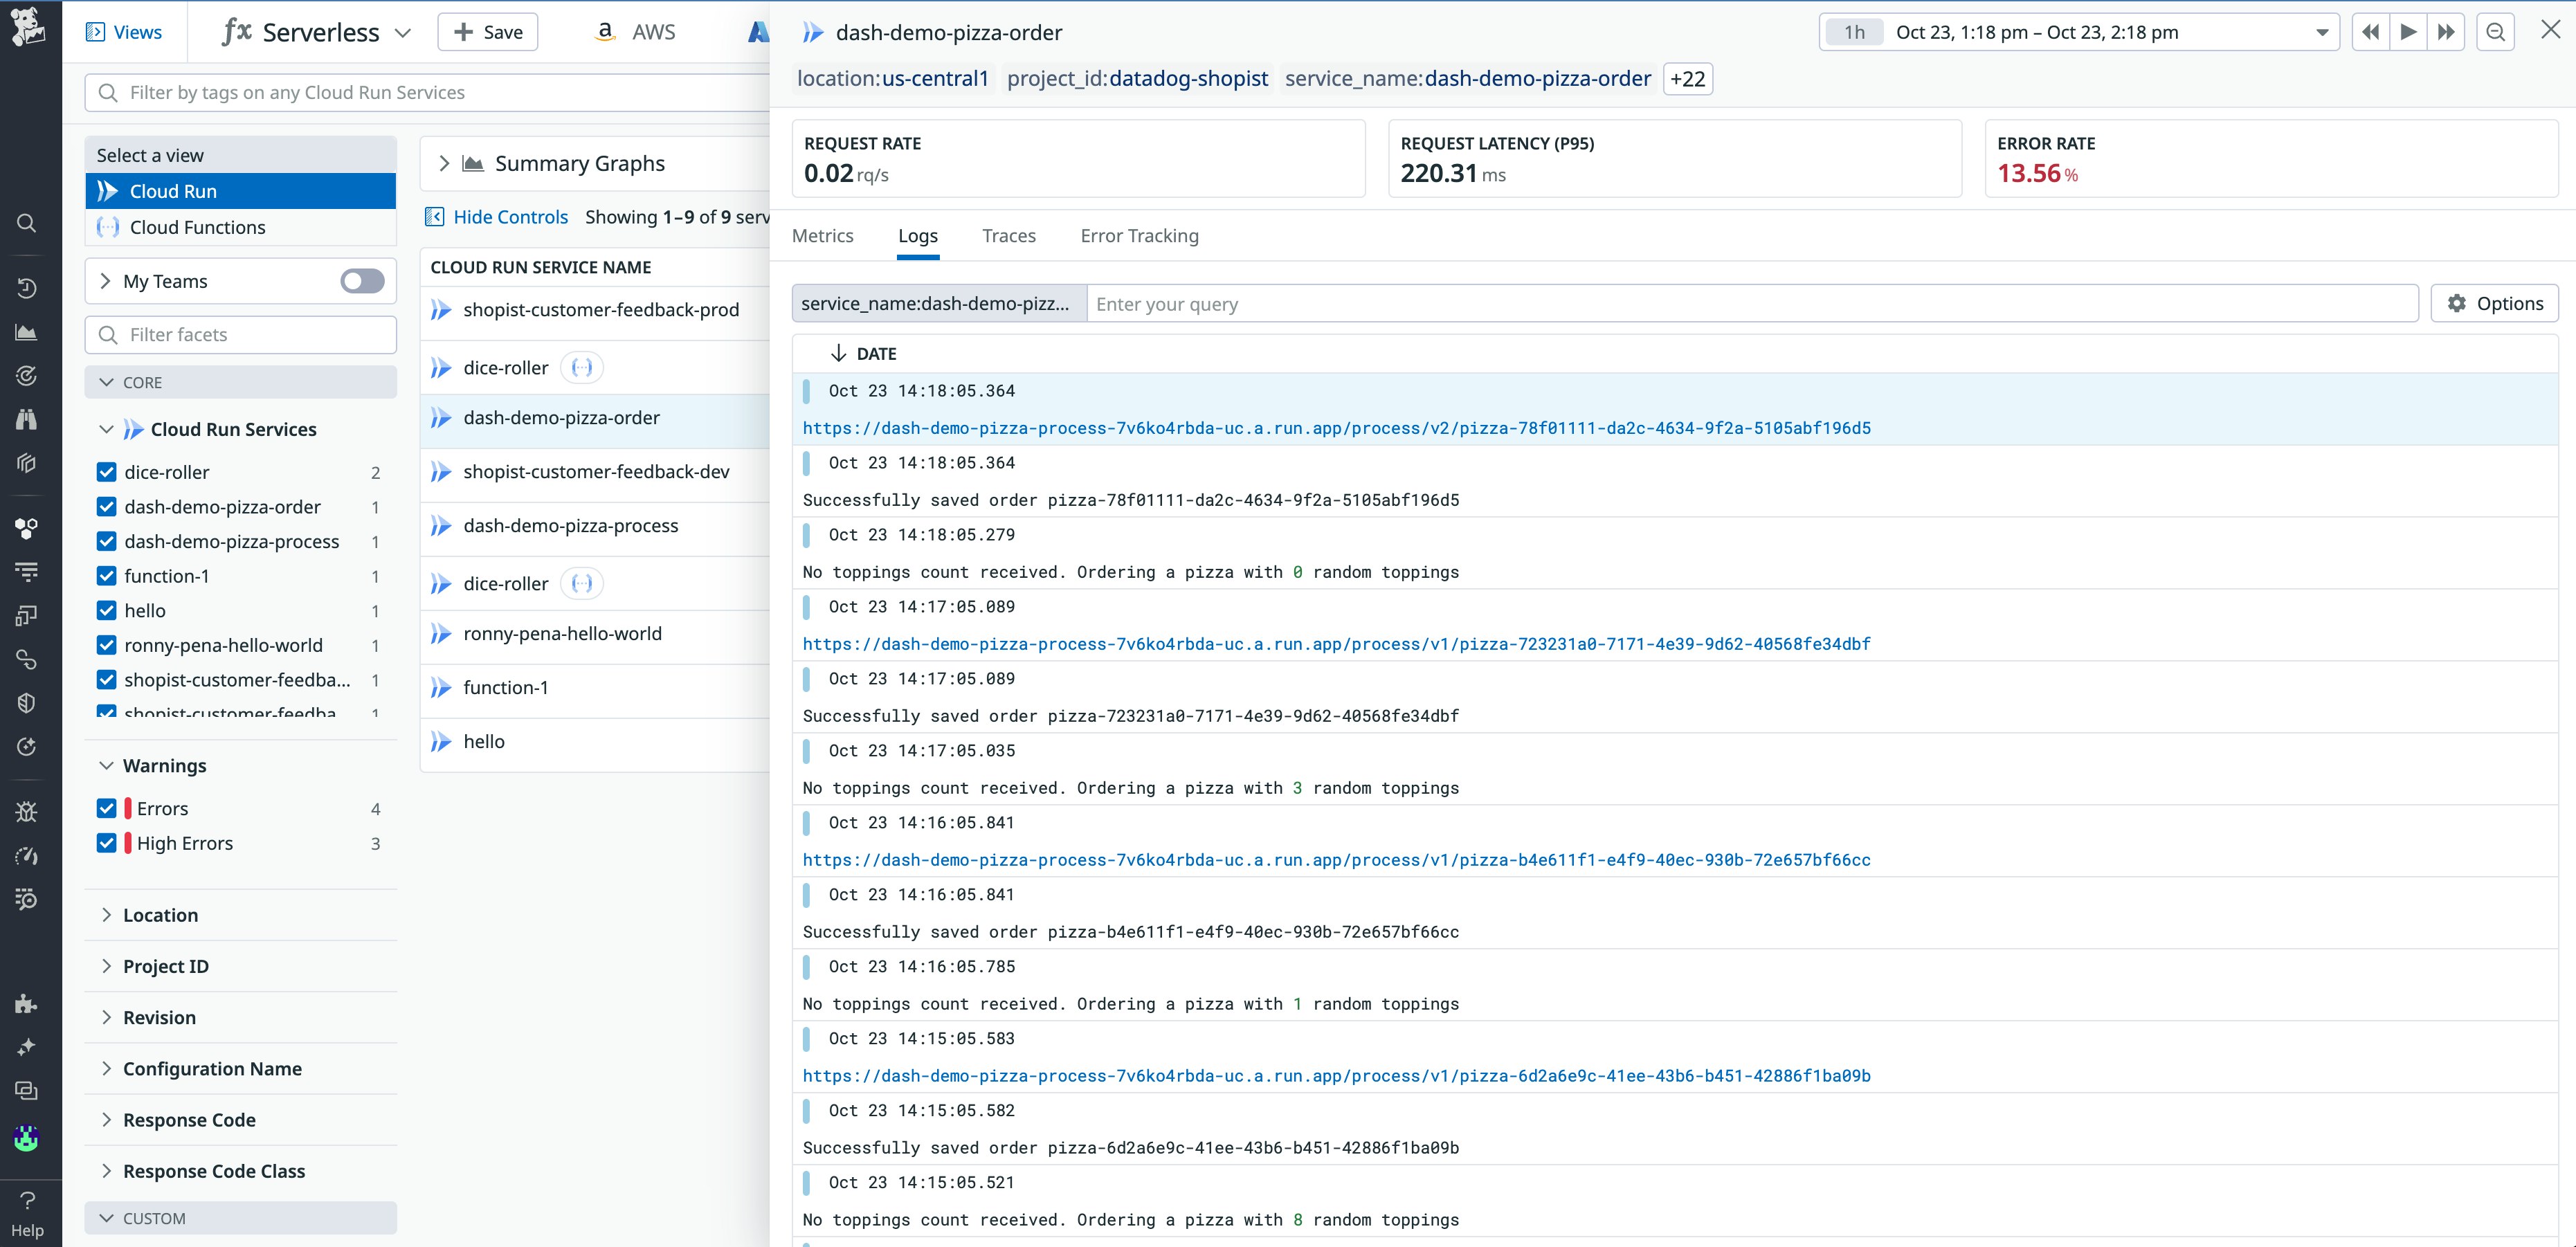
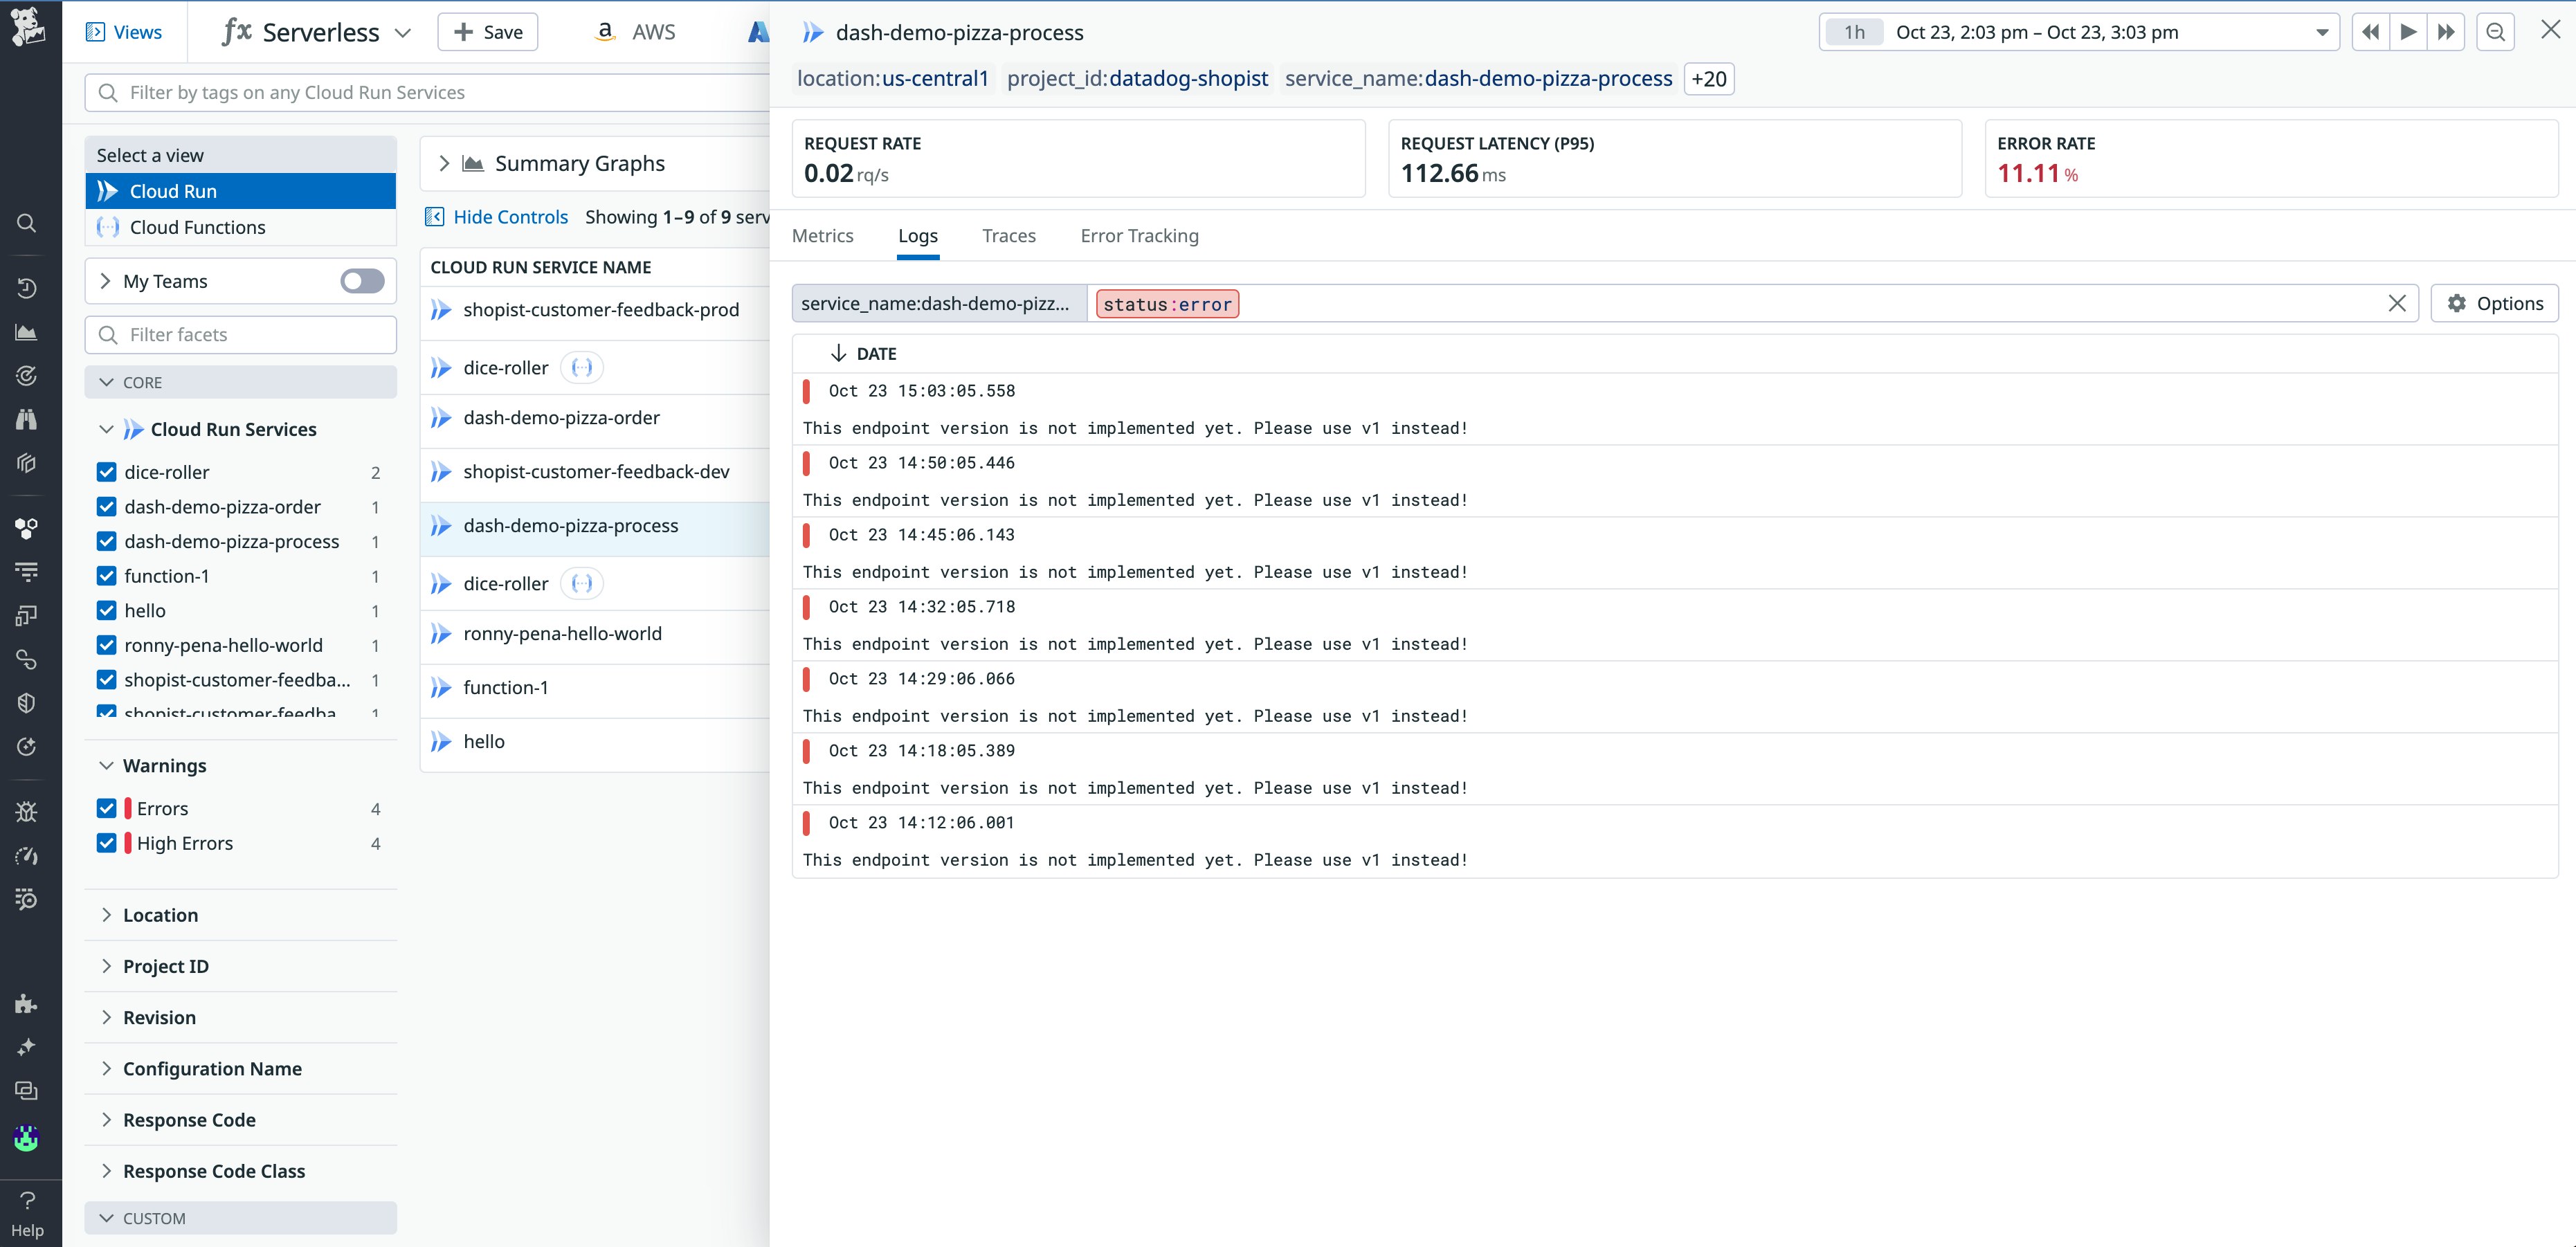
Once instrumented, Datadog will collect Cloud Run logs with Log Management and display them within the Log Explorer and the Serverless view. Cloud Run logs enable you to keep track of events and errors as they occur within your containerized serverless application. Cloud Run traces are automatically correlated to associated logs so you can quickly identify issues that may be occurring. For example, if a Cloud Run function is tagged with a High Errors warning, you can click on that function to navigate to its associated logs. From here, you can apply a status: error query in the log search bar to filter down to that function’s error logs to figure out what the problem may be. In the screenshot below, for instance, we can see that requests to a version of an API or service endpoint that hasn’t been implemented (or deprecated) is leading to errors in your Cloud Run application.
Start monitoring Cloud Run today
In this post, we looked at how you can get full visibility into your Cloud Run services by collecting and monitoring traces, metrics, and logs with Datadog’s unified platform. With Datadog, you can quickly understand the health and performance of your containerized serverless applications, rightsize your resources appropriately, and identify and troubleshoot any issues that may arise. And, with more than 1,000 integrations, you can easily use Datadog to monitor Cloud Run alongside any other cloud technologies and services your organization relies on. To get started monitoring Cloud Run, check out our documentation. Or, if you’re not already using Datadog, get started today with a 14-day free trial.
