What is OpenTelemetry?
OpenTelemetry (OTel) is an open source observability framework that provides IT teams with standardized protocols and tools for collecting and routing telemetry data. Created as an incubator project by the Cloud Native Computing Foundation (CNCF), OpenTelemetry provides a consistent format for instrumenting, generating, gathering, and exporting application telemetry data—namely metrics, logs, and traces—to monitoring platforms for analysis. In this article, we’ll explain how OpenTelemetry works, its benefits and challenges, and tools to get you started.
How OpenTelemetry Works
OpenTelemetry consists of vendor-neutral open source tools, APIs, and SDKs that can be implemented with a variety of programming languages, including Go, Java, and Python. These tools work together to specify what needs to be measured, gather the relevant data, clean and organize the information, and export it in the appropriate formats to a monitoring backend. OpenTelemetry’s components are loosely coupled, so you can easily pick and choose which parts of OTel you want to integrate.
The main OpenTelemetry components are:
- Application programming interfaces (APIs)
APIs instrument your code and coordinate data collection across your system. APIs are language-specific, so the API you use must match whatever language your code is written in.
- Software development kits (SDKs)
SDKs implement and support APIs via libraries that help with data gathering, processing, and exporting. Like APIs, SDKs are language-specific.
- Data specifications
The data specifications define the OpenTelemetry Protocol (OTLP) used to collect data, as well as relevant semantic conventions commonly used by applications.
- The OpenTelemetry Collector
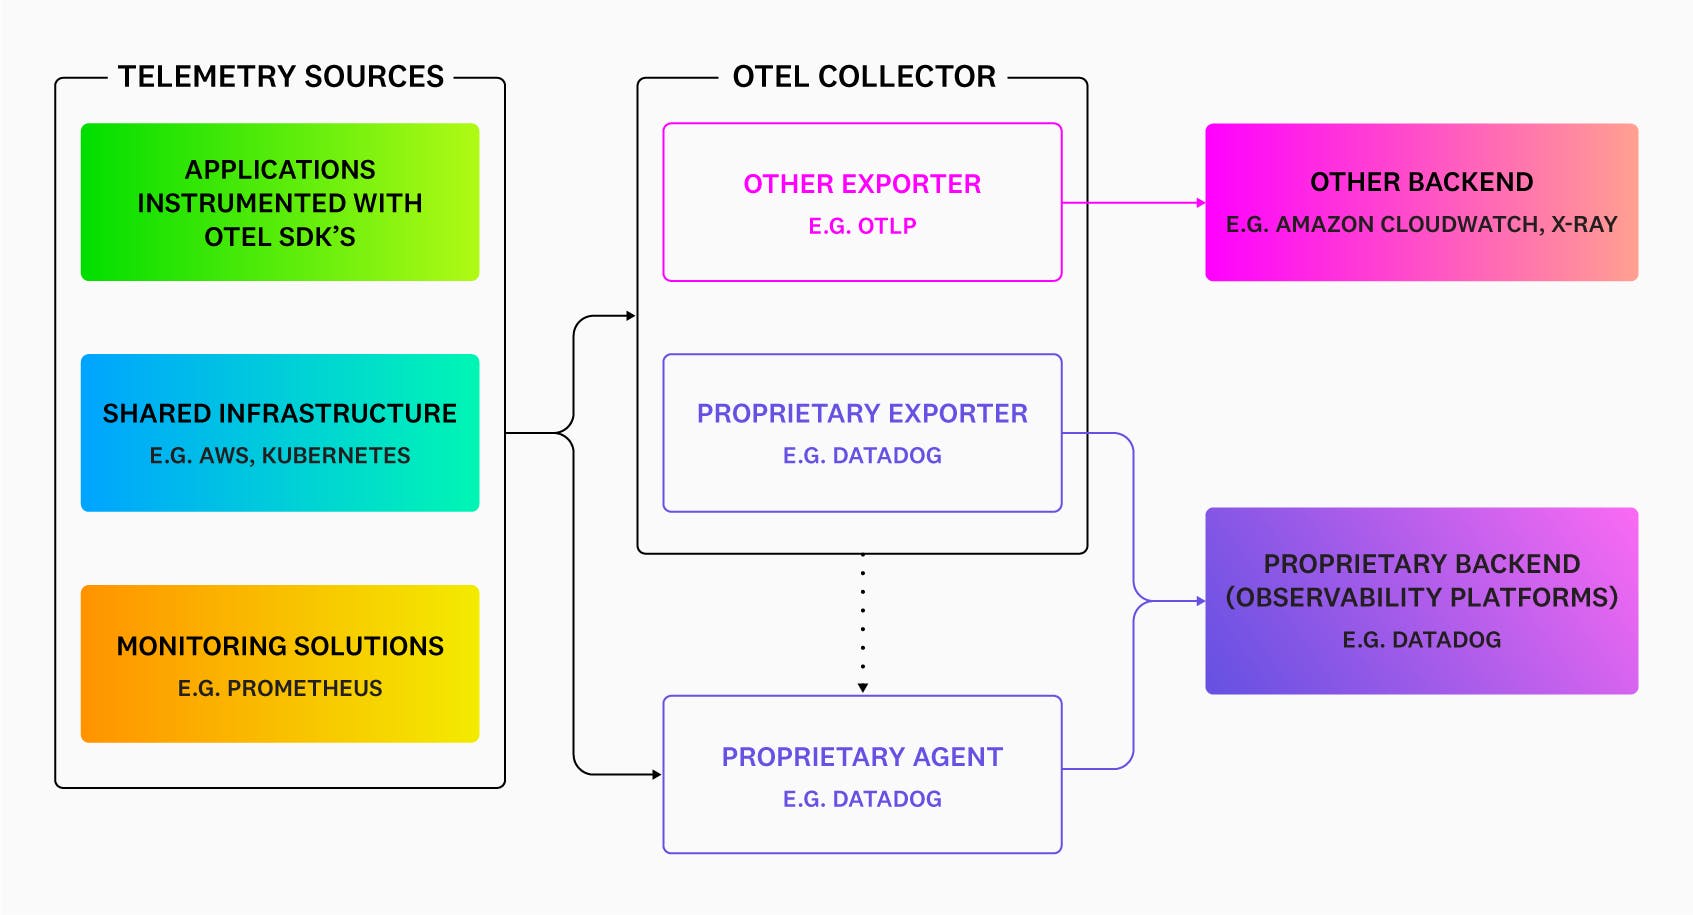
The Collector receives, processes, and exports telemetry data to one or more backends. It is designed to be universal, allowing it to work across multiple open source or commercial systems. The Collector has three components:
- Receiver
The receiver defines how data is gathered: either by pushing the data to the Collector during regular intervals or pulling it only when queried. If needed, the receiver can gather data from multiple sources.
- Processor
The processor performs intermediary operations that prepare the data for exporting, such as batching and adding metadata.
- Exporter
The exporter sends the telemetry data to an open source or commercial backend, depending on what the user has specified. Like the receiver, the exporter can push or pull this data.
Benefits of OpenTelemetry
Monitoring distributed systems means collecting data from a variety of sources, including servers, containers, and applications. In large organizations, individual teams may even use different stacks and platforms tailored to their needs, making it harder to get a single view into the performance of their entire system. By giving you a single, universal standard for collecting and sending telemetry data, OpenTelemetry helps you streamline your observability efforts, making it easier for teams to optimize performance and troubleshoot issues.
A few key benefits of OpenTelemetry are:
- Vendor Neutrality
With OpenTelemetry, you can collect telemetry data from different sources and send it to multiple platforms without significant configuration changes. This allows you to deliver insights to your teams using the tools or formats that work best for them. OTel also enables you to send your data to an alternative backend as needed, preventing vendor lock-in.
- Data Flexibility
OpenTelemetry allows you to control what telemetry data you send to your platforms. This helps you ensure that you are only capturing the information you need, reducing unnecessary noise and excess costs. Additionally, filtering makes it easier to also add custom tags to metrics for streamlined organization and searching.
- Easy Setup
By using OpenTelemetry, your organization doesn’t need to spend time developing an in-house solution or researching individual tools to use for the many different applications in your stack. You can also conserve effort on the part of your engineering teams if you switch to a different vendor or add tools to your system, as they won’t need to develop new telemetry mechanisms to support these.
Distributed tracing for AWS Lambda with Datadog APM
Challenges of OpenTelemetry
While OpenTelemetry can help you access high-quality telemetry, it does have some limitations. OpenTelemetry is a relatively young project and many features are still in development. Therefore, when implementing OTel at your organization, you should consider whether the available functionality will meet your observability needs.
Some challenges of OpenTelemetry include:
- Language stability
OpenTelemetry only supports certain languages at varying levels of stability. Some languages may still be in experimental or roadmap stages, meaning they may not be able to gather every type of telemetry data or may require time-consuming manual instrumentation.
- Data limitations
Certain forms of telemetry data also lack full support. For example, while distributed tracing is completely stable, many logging features are still being developed. Additionally, more specific use cases—such as code profiling and application security—may not be available.
- Implementation and maintenance
To use the OTel Collector like a commercial agent, you will need to provision resources for it and regularly perform maintenance tasks to keep it up to date. Therefore, even though OpenTelemetry itself is a free, open source solution, you will still need to allocate time and effort to running and managing it.
Monitoring Tools and OpenTelemetry
OpenTelemetry must be combined with an observability tool in order to make use of its powerful data collecting and routing capabilities. When searching for an observability tool to use alongside OpenTelemetry, you should look out for:
Seamless integration among the three pillars of observability—metrics, traces, and logs—as well as between backend telemetry data and frontend session information
Machine learning-based alerts and insights for quick anomaly, outlier, and root cause detection
Easy-to-use search and dashboard functionality that doesn’t require you to learn a custom query language
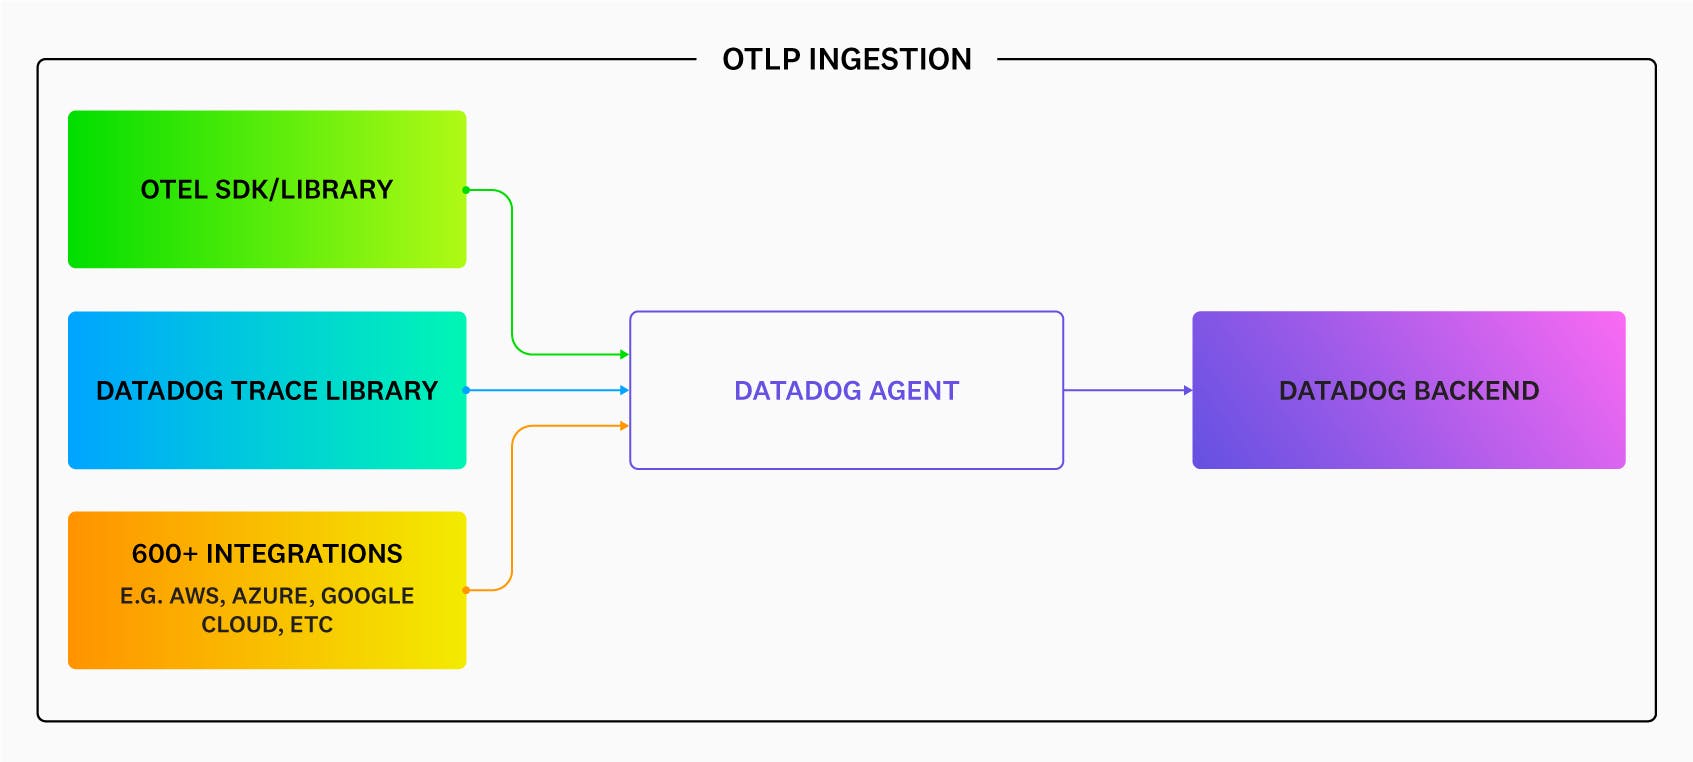
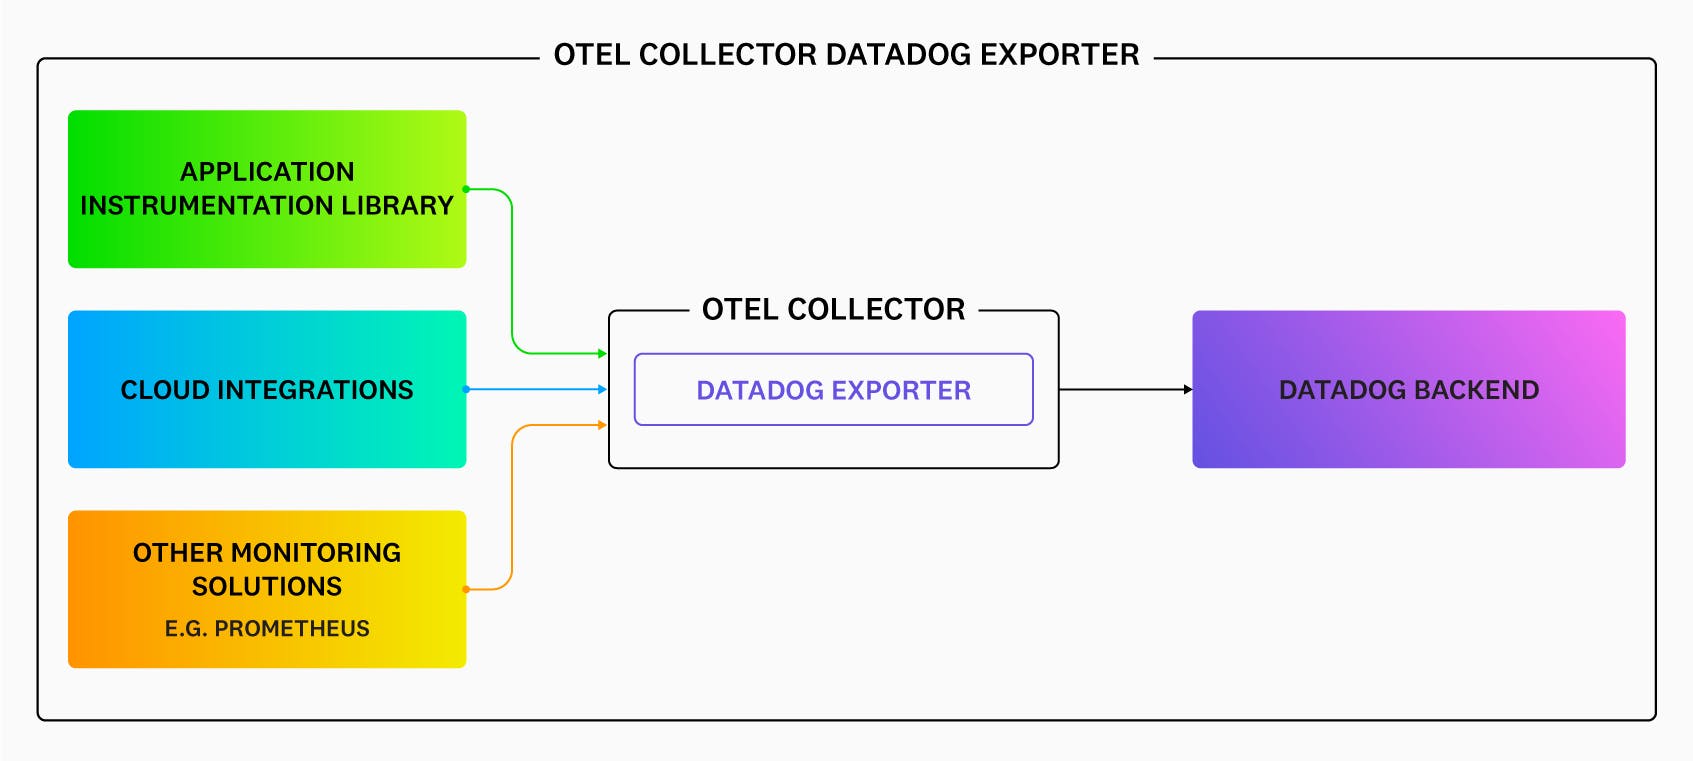
The option to choose between a dedicated exporter tool that gathers data from the OTel Collector and sends it to any backend destination, or proprietary agent-based ingestion that allows you to process, tag, and enrich your data without having to install the OTel Collector
Datadog makes it easy to gather, search, and analyze all your OpenTelemetry data. With full-stack visibility, you can view observability data from your entire system in a single pane of glass. Trace ID injection helps you streamline troubleshooting by connecting your traces to your logs. Additionally, you can quickly visualize, search, and analyze your data using tags—no custom query language needed—enabling teams to collaborate and resolve issues across your stack. The Datadog Agent supports OTLP ingestion, allowing you to efficiently collect telemetry data from OpenTelemetry APIs and SDKs and send it directly to the Datadog platform. You can also leverage the Datadog exporter to gather data in the OpenTelemetry Collector and then export it to Datadog.
For complete visibility into system health and performance, you can start using Datadog with OpenTelemetry today.


