Datadog Website Usage Analytics | Datadog

Real-Time Website Usage Analytics & Monitoring

Debug website errors quickly. Gain insight into your website usage analytics and other performance metrics with Datadog.

多くの企業で愛用され信頼を得ています

Samsung logo Ubisoft logo Deloitte Cloud logo Cybozuinc logo sansan logo Nginx logo Chef logo Nasdaq logo DreamWorks Animation logo Nikon logo Zynga logo Evernote logo Sonos logo Monotaroco logo

製品のメリット

Discover In-Depth Insights into Product Usage & User Behavior

  • Watch replays of user sessions and apply discoveries about user behavior to product and design decisions
  • Explore user behavior with funnels and rage clicks to uncover the impact of errors and performance bottlenecks and locate points of frustration with your UX
  • Gain and share insights without needing technical skills, thanks to a simple interface, shareable player, and out-of-the-box dashboards

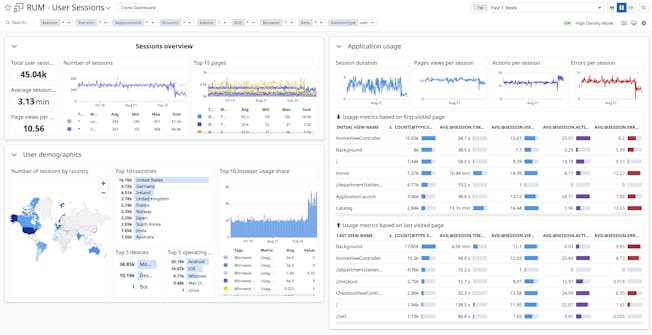
Easily Optimize Performance

  • Gain key insights into how your apps perform across geographies, browsers, or any custom dimension
  • Analyze page load times with First Contentful Paint, DOM Content Loaded, Time to Interactive, and other frontend performance metrics
  • Pinpoint the root cause of slow load times, whether it's an issue with the code, the network, or the infrastructure
  • Correlate performance metrics with usage metrics, user actions and business attributes
newoptimizeperformanceimage.png

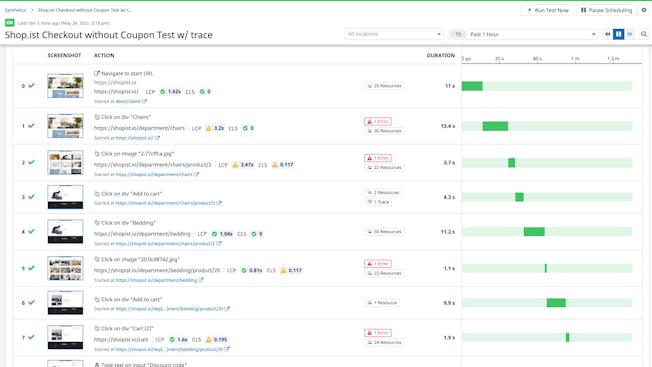
Resolve Front-End Issues Before Users Are Impacted

  • Ensure critical business workflows are functioning as expected with Browser tests
  • Create end-to-end tests with the codeless web recorder by clicking through applications just like end-users would
  • Test from various global locations, browsers, and devices
  • Expedite root cause analysis with test results components including screenshots, page performance data, errors, resources, and backend traces
dg/corewebvitals.png

Get Started in Minutes

  • Start receiving actionable insights quickly; install a single SDK to collect frontend metrics and telemetry
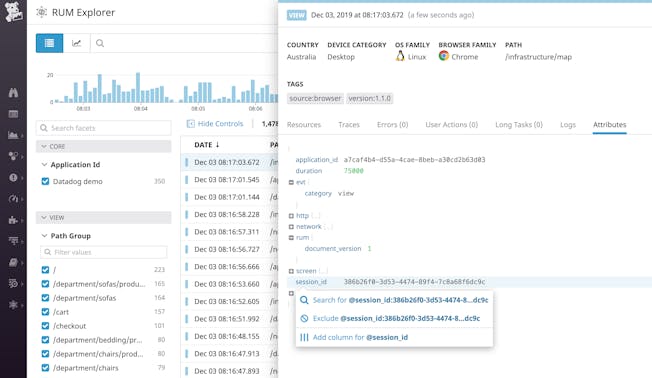
  • View critical RUM health metrics instantly with out-of-the-box, customizable, drag-and-drop dashboards
  • Explore rich real user monitoring data in an intuitive interface
  • Easily isolate regional or service specific performance problems without the need to use a query language
/blog/real-user-monitoring-with-datadog/datadog-rum-views-explorer.png

Datadogを始める5つのステップ

ステップ1
トライアル登録フォームに入力 わずか30秒で無料でアカウントを作成。クレジットカードは不要
ステップ2
技術スタックに関する基本的な質問に回答 約1分で完了
ステップ3
Datadog エージェントをインストール システムレベルのメトリクスをDatadogプラットフォームに送信
ステップ4
API経由で追加のメトリクスを取得するための認証情報を提供 AWS、Azure、GCPなどのクラウド環境を完全に可視化
ステップ5
すぐに使えるダッシュボードでパフォーマンスを視覚化 環境全体のパフォーマンスをリアルタイムで確認可能

クラウド時代に不可欠なモニタリングとセキュリティのプラットフォーム

Datadogは、エンドツーエンドのトレース、メトリクス、ログを統合し、アプリケーション、インフラストラクチャ、サードパーティ・サービスを完全に可観測にします。

Platform Diagram

なぜDatadogなのか?

カスタムアトリビュートとアクション

任意のイベントを関連するコンテキストとともに自動的に収集し、モニタリングします。


エラーの自動追跡

アプリケーションエラーを課題にグループ化し、根本原因の分析に必要なコンテキストを取得し、MTTRを削減します。


フロントエンドとバックエンドの相関関係

アプリケーションのバックエンド・サービスからのAPMトレースと、フロントエンドの主要なパフォーマンス指標を関連付けて確認できます。


すぐに使えるダッシュボード

セットアップ後すぐに、データがロードされ調査がはじまります