Datadog Real User Monitoring | Datadog

Track Feature Flags with Datadog RUM

Ensure safe releases with feature flag tracking—effortlessly isolate and measure the impact of releases with tags to accelerate development.

blog/feature-flag-tracking/feature-flags-tab

多くの企業で愛用され信頼を得ています

Samsung logo Ubisoft logo Deloitte Cloud logo Cybozuinc logo sansan logo Nginx logo Chef logo Nasdaq logo DreamWorks Animation logo Nikon logo Zynga logo Evernote logo Sonos logo Monotaroco logo

製品のメリット

Roll Out Releases Confidently with Feature Flags

  • Collect data for custom feature management solutions, or via our integration partners, including LaunchDarkly, Flagsmith, Devcycle, and more
  • Enrich visibility into user experience by using feature flag tags to search and drill down into associated user sessions and apps
  • Pinpoint issues to specific releases by viewing feature flags data in context with application performance metrics, traces, and logs
dg/flag_rum_details.png

Track Feature Flags in Real Time and Troubleshoot Faster

  • Easily investigate your feature flags' health and usage in dedicated dashboards to reduce incident recovery time
  • Isolate flaws in your releases before they become widespread issues, then turn off or roll back problematic features
  • Enable teams across your organization to test features and increase development velocity without risking code issues
blog/feature-flag-tracking/feature-flag-analysis.png

Monitor 100% of Frontend Errors and Performance Issues

  • Collect 100% of your user sessions (no sampling) and receive actionable alerts in real time
  • Track Single Page Applications (SPAs) and identify any client-side or server-side errors
  • Intelligently group high-volume application errors into a small number of issues with Error Tracking
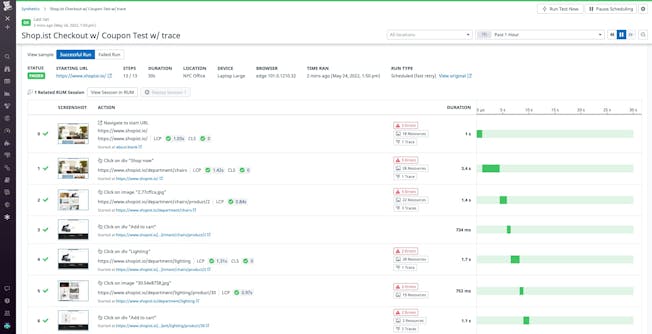
  • Surface the root cause, down to the line of code, and watch replays to instantly recreate issues
products/error-tracking/newerrortrackingimage.png

Discover In-Depth Insights into Product Usage & User Behavior

  • Watch replays of user sessions and apply discoveries about user behavior to product and design decisions
  • Explore user behavior with funnels and rage clicks to uncover the impact of errors and performance bottlenecks and locate points of frustration with your UX
  • Gain and share insights without needing technical skills, thanks to a simple interface, shareable player, and out-of-the-box dashboards

Enhance End-User Experience and Customer Satisfaction

  • Uncover performance problems before they affect your customers with machine-learning powered alerting, uptime checks, and self-maintaining browser tests
  • Discover front-end issues, such as Javascript or network errors, and quickly resolve them by identifying the root cause, down to the line of code
  • Proactively prevent issues from occurring with synthetic monitors and alerts on metric forecasts
enhanceenduserimage.jpeg

Datadogを始める5つのステップ

ステップ1
トライアル登録フォームに入力 わずか30秒で無料でアカウントを作成。クレジットカードは不要
ステップ2
技術スタックに関する基本的な質問に回答 約1分で完了
ステップ3
Datadog エージェントをインストール システムレベルのメトリクスをDatadogプラットフォームに送信
ステップ4
API経由で追加のメトリクスを取得するための認証情報を提供 AWS、Azure、GCPなどのクラウド環境を完全に可視化
ステップ5
すぐに使えるダッシュボードでパフォーマンスを視覚化 環境全体のパフォーマンスをリアルタイムで確認可能

クラウド時代に不可欠なモニタリングとセキュリティのプラットフォーム

Datadogは、エンドツーエンドのトレース、メトリクス、ログを統合し、アプリケーション、インフラストラクチャ、サードパーティ・サービスを完全に可観測にします。

Platform Diagram