Try Datadog, Get a Free T-Shirt | Datadog | Datadog

Real-Time Kubernetes Monitoring

Enhance visibility into the performance of your entire containerized environment and investigate issues quickly. Start your trial today, create a dashboard, and we’ll send you a free Datadog t-shirt!

登録にかかる時間はわずか30秒。クレジットカードは不要です。

Due to unforeseen shipping charges to the recipient we are no longer able to send t-shirts to India. Full rules and eligible countries here.

tshirt/190509_generic-tshirt_hero_shirt

800+ 以上のすぐに使えるインテグレーション

多くの企業で愛用され信頼を得ています

Samsung logo Ubisoft logo Deloitte Cloud logo Cybozuinc logo sansan logo Nginx logo Chef logo Nasdaq logo DreamWorks Animation logo Nikon logo Zynga logo Evernote logo Sonos logo Monotaroco logo

製品のメリット

Monitor Your Containerized Environment in a Single Screen

  • Analyze the health of all your containers by pod, namespace, and node distributed across any cloud environment
  • Avoid resource contention and deficiency by drilling into individual containers running hot with 1 click
  • Automatically collect, monitor, and visualize high-granularity metrics from all your containers at 15s. granularity for 15 months

Manage High-Scale K8s Environments with Confidence

  • Enable low impact monitoring of 10,000+ nodes with the cluster agent
  • Optimize horizontal auto-scaling by connecting Datadog to your HPA and collecting request rate, latency, and available network bandwidth
  • Gain visibility into container orchestration and easily manage Kubernetes pods over or under-allocating available resources via the real-time live container view and auto-generated container map
  • Improve operational costs and reduce excess capacity based on high-granularity historical data

Troubleshoot Performance Issues Quickly and Minimize Downtime

  • Gain complete visibility into any Kubernetes environment, along with all of the applications running on it, with end-to-end tracing and continuous profiling
  • Easily verify that containers and services maintain high availability through dashboard reporting, synthetic tests, and App Analytics
  • Test hypotheses in seconds by overlaying Deployment events onto time-synchronized metric graphs

Eliminate False-Positives and Receive Alerts for Only the Issues that Matter

  • Set up threshold and rate of change alerts for service-level metrics that won’t panic as containers scale down
  • Create smarter alerts that account for daily, weekly, and seasonal fluctuations
  • Proactively prevent outages and errors by forecasting system-level metrics
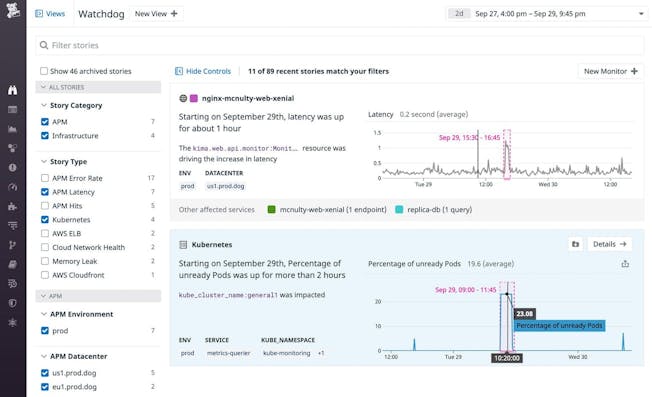
  • Automatically detect unanticipated outliers, anomalies, and errors with Watchdog
dg/datadog-watchdog-story.jpeg

Enhance Visibility with Datadog

  • Monitor your full stack in one place and create custom, drag-and-drop, real-time dashboards within seconds
  • Seamlessly navigate between your logs, infrastructure metrics, and application traces
  • Quickly deploy the agent across your entire cluster through our helm chart or daemonset
  • Automatically detect services running in Kubernetes clusters and monitor them no matter where they spin up

Track Changes in Your Containerized Infrastructure

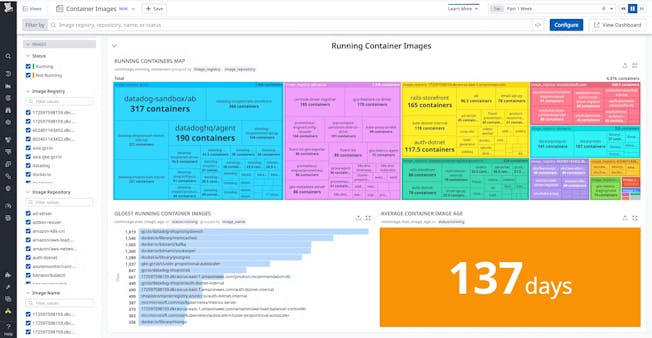
  • Gain key insights into every container image used in your environment—and about your entire container image ecosystem
  • Understand large-scale trends in security posture and resource utilization with image-specific metric dashboards
  • Reduce costs by spotting cloud registries that you may be paying for but not actively using, as well as images that are taking up unnecessary disk space in your hosts
dg/container-image-trends-image-2.png