Datadog AKS Monitoring | Datadog

Azure Kubernetes Service Monitoring

Gain complete visibility into your AKS infrastructure with metrics, traces, and logs from Azure, Kubernetes, Docker, and every other service supporting your containerized environment.

case-studies/resources_nttdocomo_casestudy

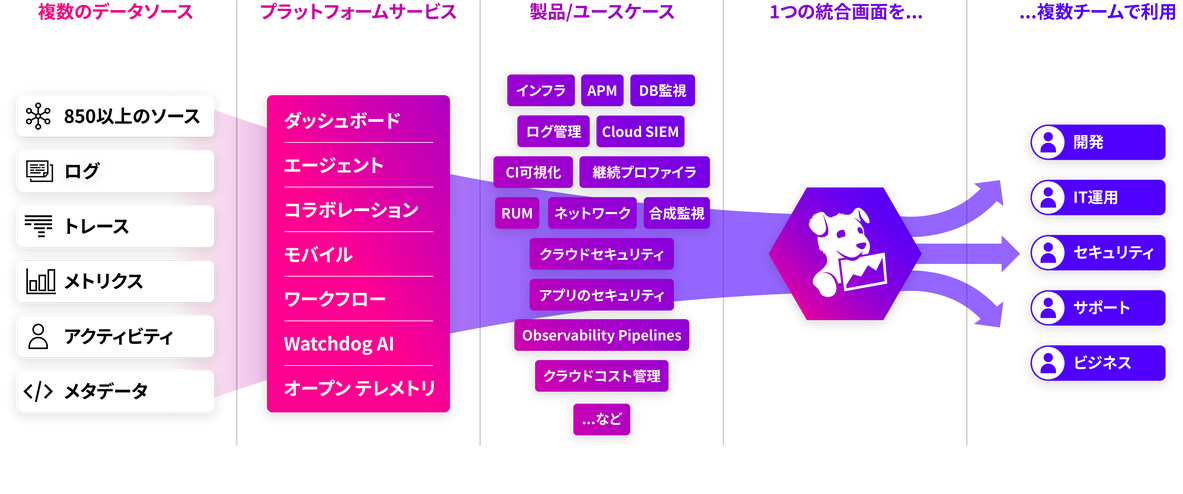
「クラウドでの開発と運用を進めるなか、Datadogを導入した目的 は統合監視ツールで様々な事象を関連付けて分析することです。 可観測性が上がり、問題の切り分けから対応までが迅速化するだ けでなく、開発者はAPMでただちに性能試験もできて、ボトルネ ックをすぐ発見できる。我々はビジネスロジックに集中し、アジ リティを高めたい。そうした要件があるなかDatadogはSaaSで提 供されているので運用負荷が低く、マルチクラウドにも対応し ているところがよかった。」

株式会社NTTドコモ

サービスデザイン部 第三クラウド推進

担当部⻑ 三井 力 氏


課題

かつて現場では、開発と運用間のコミュニケーションに課題があった。トラブルの切り分けに時間が かかっていた。運用で問題が起きたらすぐに解 決したかった。

Datadog による効果

Datadogは様々な事象を関連付けて分析ができて、可観測性が高まり、対処までの時間を短縮できる。ダッシュボードの表現力、使い勝手、人気ランキングが表示されるなどの機能がメンバーを魅了し、有益なダッシュボードが次々と生まれた。DatadogがSaaS型で運用負荷が低く、マルチクラウド対応しているところもよかった。

case-studies/resources_ikyu_casestudy

「システムの健全性を把握するために必要な情報(メトリクスやログ)が散在していたため、異常発生時には複数のツールにまたがり原因を探す必要があり、職人技と運が必要でした。また、リリースのタイミングでパフォーマンスが落ちることがあり、クエリーやロジックをレビューするなど試行錯誤していました」

植竹 剛人 氏

CISO 兼データサイエンス部 部⻑ 兼CTO室 エンジニア

株式会社 一休


課題

メトリクスやログなどあちこちに情報があり、障害が起きたときにどこに問題があるのか職人技で探す必要があった。リリースのタイミングでパフォーマンスが落ち、サイトがタイム・アウトしてユーザーから見えないこともある。最優先の課題は、リアルタイムな統合モニタリングでエンドユーザーが気づく前に問題を解決可能になることでした。

Datadog による効果

システムのクラウド移行に伴い、SaaS型で運用負荷が少ない監視ツールを探したところ、Datadogが目についた。メトリクスが豊富で、ダッシュボードから必要な情報を一覧できて、Slackとの連携しやすいさなどが魅力だった。【問題対処を迅速化】プロダクト開発が責任をもって運用までおこなっている。インフラや外形監視でほぼリアルタイムで通知を受け、APMで問題解決とシームレスに対応ができるようになった。【デプロイが10倍以上に】2週間に1度だったデプロイをDatadog導入とともに自動化を進めた結果、1日数回へと大幅に頻度を上げられた。

case-studies/resources_softbank_casestudy

「Datadogを活用したDevOps基盤が構築できて、豊富なモニタリングとコスト最適化が実現できました。Datadogはマルチクラウドを意識することなく可視化できて、アプリとインフラ担当の共通言語となっています。今後はセキュリティ強化にも役立てていきたいと考えています」

ソフトバンク株式会社

コアネットワーク本部

クラウド基盤R&D統括部 クラウドネイティブ技術部

担当部⻑

山根 武信 氏


課題

ビジネスニーズの変化はめまぐるしく、開発現場は度重な る仕様変更に翻弄されていた。 そこで2018年、仕様変更に柔軟かつ素早く対応するため、アジャイル開発とDevOps環境構築に乗り出した。開発サイクルを加速させるためには、 DevOps環境における運用監視作業の省力化はもちろん、開発の様々な場面で可視化を実現する必要があった。

Datadog による効果

新たに構築したアジャイル開発 とDevOps基盤はクラウドのコン テナ Kubernetes環境なので、そ れまで使用していた監視ツール では不向きだった。コンテナに 対応した監視ツール各種で比較 したところ、Datadogは構築工 数やオンプレ連携、必要な機能 が揃い管理工数を低く抑えられ る統合ツールだったため採用。 開発から運用まで、あらゆる段 階で幅広く可視化できるのも大 きなメリットとなった。

case-studies/resources_assetforce_casestudy

「取れる指標でなく、「人」を中心に通知を設計したことがDatadogの導入成功の鍵でしょう。適切な人に、次のアクションに繋がる情報を緊急度に応じた媒体で伝えることが重要です。通知が多すぎると、人は慣れて無視されて、肝心なときに役に立ちません。」

三井住友ファイナンス&リース株式会社

デジタル開発室 リードスペシャリスト 森本 悠太 氏


課題

三井住友ファイナンス&リースグループは、短期間でモニタリング環境を構築して、開発と運用を一体化し、システムの稼働を安定させる必要がありました。

Datadog による効果

三井住友ファイナンス&リースグループは、短期間でのモニタリング環境導入のため、シンプル、必要な機能を最初から使える、初期設定のまますぐに使えるダッシュボード、APIで細かくTwillioの通知フローを設定できる、機密性が高いログの除外に対応しているという 5つの理由からDatadogを選定しました。

多くの企業で愛用され信頼を得ています

Samsung logo Ubisoft logo Deloitte Cloud logo Cybozuinc logo sansan logo Nginx logo Chef logo Nasdaq logo DreamWorks Animation logo Nikon logo Zynga logo Evernote logo Sonos logo Monotaroco logo

製品のメリット

Visualize Kubernetes Cluster Health and Performance Out-of-the-Box

  • Within minutes of installing Datadog’s Azure integration, get full visibility into your clusters’ health and performance at cluster, node, and pod levels
  • Keep tabs on your containerized workloads and visualize trends anywhere in your AKS clusters
  • Monitor and alert on important AKS resource utilization metrics like CPU, memory, and storage usage, as well as cluster health information like pod phase and state

Manage High-Scale K8s Environments with Confidence

  • Enable low impact monitoring of 10,000+ nodes with the cluster agent
  • Optimize horizontal auto-scaling by connecting Datadog to your HPA and collecting request rate, latency, and available network bandwidth
  • Gain visibility into container orchestration and easily manage Kubernetes pods over or under-allocating available resources via the real-time live container view and auto-generated container map
  • Improve operational costs and reduce excess capacity based on high-granularity historical data

Quickly Troubleshoot Container Orchestration Issues

  • Visualize control plane data from your API server to get valuable insights into your AKS cluster’s orchestration layer
  • Get alerted on elevated error rates in API server logs and seamlessly correlate with rising inflight request counts to measure latency
  • Diagnose potential AKS workload issues such as spikes in the number of failed schedule attempts
blog/azure-kubernetes-service-cluster-visibility-with-aks-dashboard/aks-dash-api-server.png

Eliminate False-Positives and Receive Alerts for Only the Issues that Matter

  • Set up threshold and rate of change alerts for service-level metrics that won’t panic as containers scale down
  • Create smarter alerts that account for daily, weekly, and seasonal fluctuations
  • Proactively prevent outages and errors by forecasting system-level metrics
  • Automatically detect unanticipated outliers, anomalies, and errors with Watchdog
dg/datadog-watchdog-story.jpeg

Enhance Visibility with Datadog

  • Monitor your full stack in one place and create custom, drag-and-drop, real-time dashboards within seconds
  • Seamlessly navigate between your logs, infrastructure metrics, and application traces
  • Quickly deploy the agent across your entire cluster through our helm chart or daemonset
  • Automatically detect services running in Kubernetes clusters and monitor them no matter where they spin up

Track Changes in Your Containerized Infrastructure

  • Gain key insights into every container image used in your environment—and about your entire container image ecosystem
  • Understand large-scale trends in security posture and resource utilization with image-specific metric dashboards
  • Reduce costs by spotting cloud registries that you may be paying for but not actively using, as well as images that are taking up unnecessary disk space in your hosts
dg/container-image-trends-image-2.png

Ensure a Successful Migration with Microsoft’s Cloud Adoption Framework

  • Datadog provides critical visibility into your environment at each of the phases recommended in the Microsoft Cloud Adoption Framework
  • Ensure your environment is ready to move to the cloud and safely migrate your workloads
  • Better plan and track your migration’s progress and immediately identify problems with Datadog - a single source of truth
dg/azure-dashboard-2023.png

Take Control of Your Cloud Costs on Azure

  • Migrate to the cloud without any unexpected cost overages using granular, accurate Azure cost data across multiple billing accounts and subscriptions
  • Provide each team with cost data scoped to their services and applications to help empower engineers to take action
  • Identify cost optimization opportunities with unit economics and combine cost data with telemetry to visualize the full story
dg/azureccm2.png

Datadogを始める5つのステップ

ステップ1
トライアル登録フォームに入力 わずか30秒で無料でアカウントを作成。クレジットカードは不要
ステップ2
技術スタックに関する基本的な質問に回答 約1分で完了
ステップ3
Datadog エージェントをインストール システムレベルのメトリクスをDatadogプラットフォームに送信
ステップ4
API経由で追加のメトリクスを取得するための認証情報を提供 AWS、Azure、GCPなどのクラウド環境を完全に可視化
ステップ5
すぐに使えるダッシュボードでパフォーマンスを視覚化 環境全体のパフォーマンスをリアルタイムで確認可能

クラウド時代に不可欠なモニタリングとセキュリティのプラットフォーム

Datadogは、エンドツーエンドのトレース、メトリクス、ログを統合し、アプリケーション、インフラストラクチャ、サードパーティ・サービスを完全に可観測にします。

Platform Diagram

850+ 以上のすぐに使えるインテグレーション