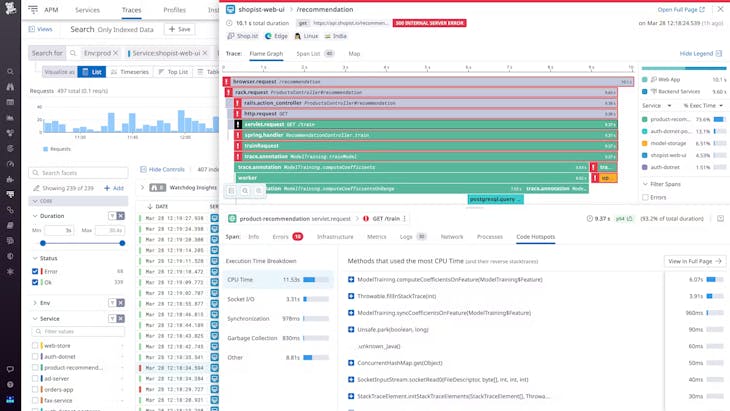
Quickly Pinpoint Application Performance Issues
- Gain full visibility into your application code performance with end-to-end tracing, full latency breakdowns, and flamegraphs showcasing request-level details
- Adopt canary, blue-green, or any other deployment strategy by automatically tracking performance changes before, during, and after the release
- Resolve active incidents faster with real-time service maps and alerts on code-level + service-level performance issues
- Detect the source of service issues rapidly with a centralized view of health metrics and dependencies alongside telemetry from your infrastructure and databases
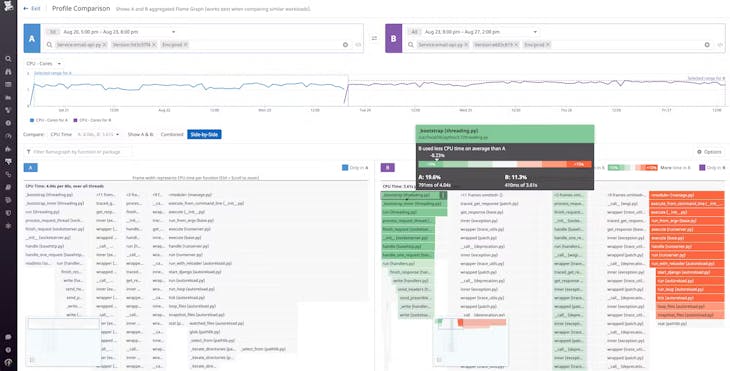
Optimize Your Production Code for Peak Performance, Cost-Effectiveness, and Efficiency
- Analyze 100% of your code in production including methods, classes, and threads across your entire stack
- Seamlessly pivot between profiles and distributed traces with 1-click with unmatched time resolution of 10,000s of thread-level events per minute
- Get deeper insights and easily investigate exceptions, parallelization, deadlocks, garbage collection, and I/O with continuous detailed breakdown by call stack, stack trace, and flamegraph
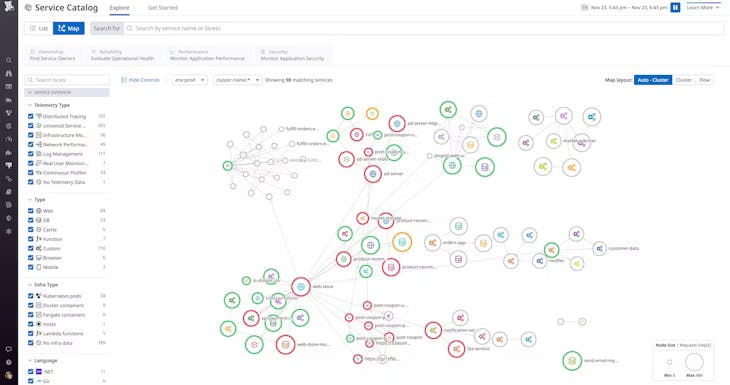
Instantly Discover, Map, and Monitor Every Service—Without Changing Code
- Eliminate system blindspots by automatically discovering all your services, whether first- or third-party, without instrumenting any code
- Improve application reliability and formalize adoption of DevSecOps best practices to increase collaboration amongst teams
- Gain instant visibility into the health of every service and dependency through real-time RED metrics and automatically correlated telemetry
- Detect issues faster with a unified source of observability and standardized SLOs for all teams across an organization
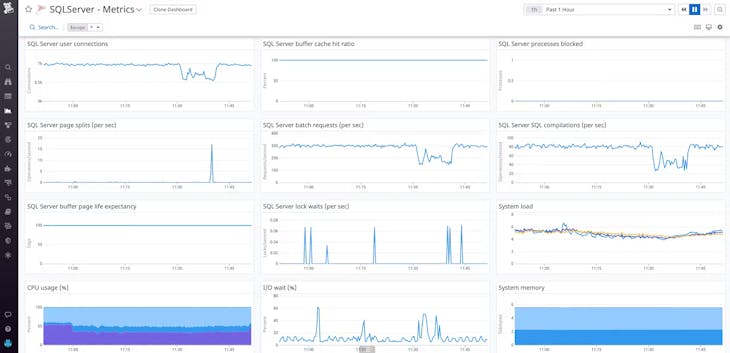
Monitor Database Performance At Scale
- Isolate SQL query performance issues in seconds by visualizing query metrics and explain plans over time
- Monitor all your databases together with your cloud services, containers, and serverless functions in one place with Datadog’s 850+ vendor-backed integrations
- Diagnose root causes faster and see anomalous behavior across all your systems by correlating database queries automatically with traces and infrastructure metrics
- Scale and manage a large number of databases while keeping all your sensitive data secure
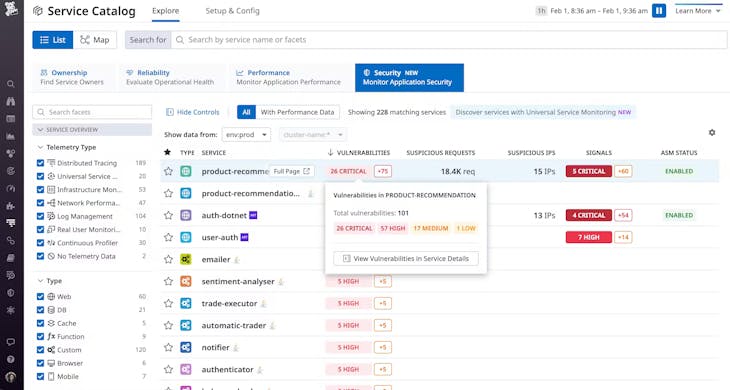
Full-Stack Defense Across Apps, Workloads, and Infrastructure
- Track your security posture easily with out-of-the-box threat activity, exposure, and Datadog Severity Score
- Triage vulnerability impact in full context with continuous runtime scans across 3rd party libraries
- Remediate issues with out-of-the-box actionable guidance and automatic correlation between application and infrastructure
- Increase collaboration by sharing a single language between developer, operation, and security teams