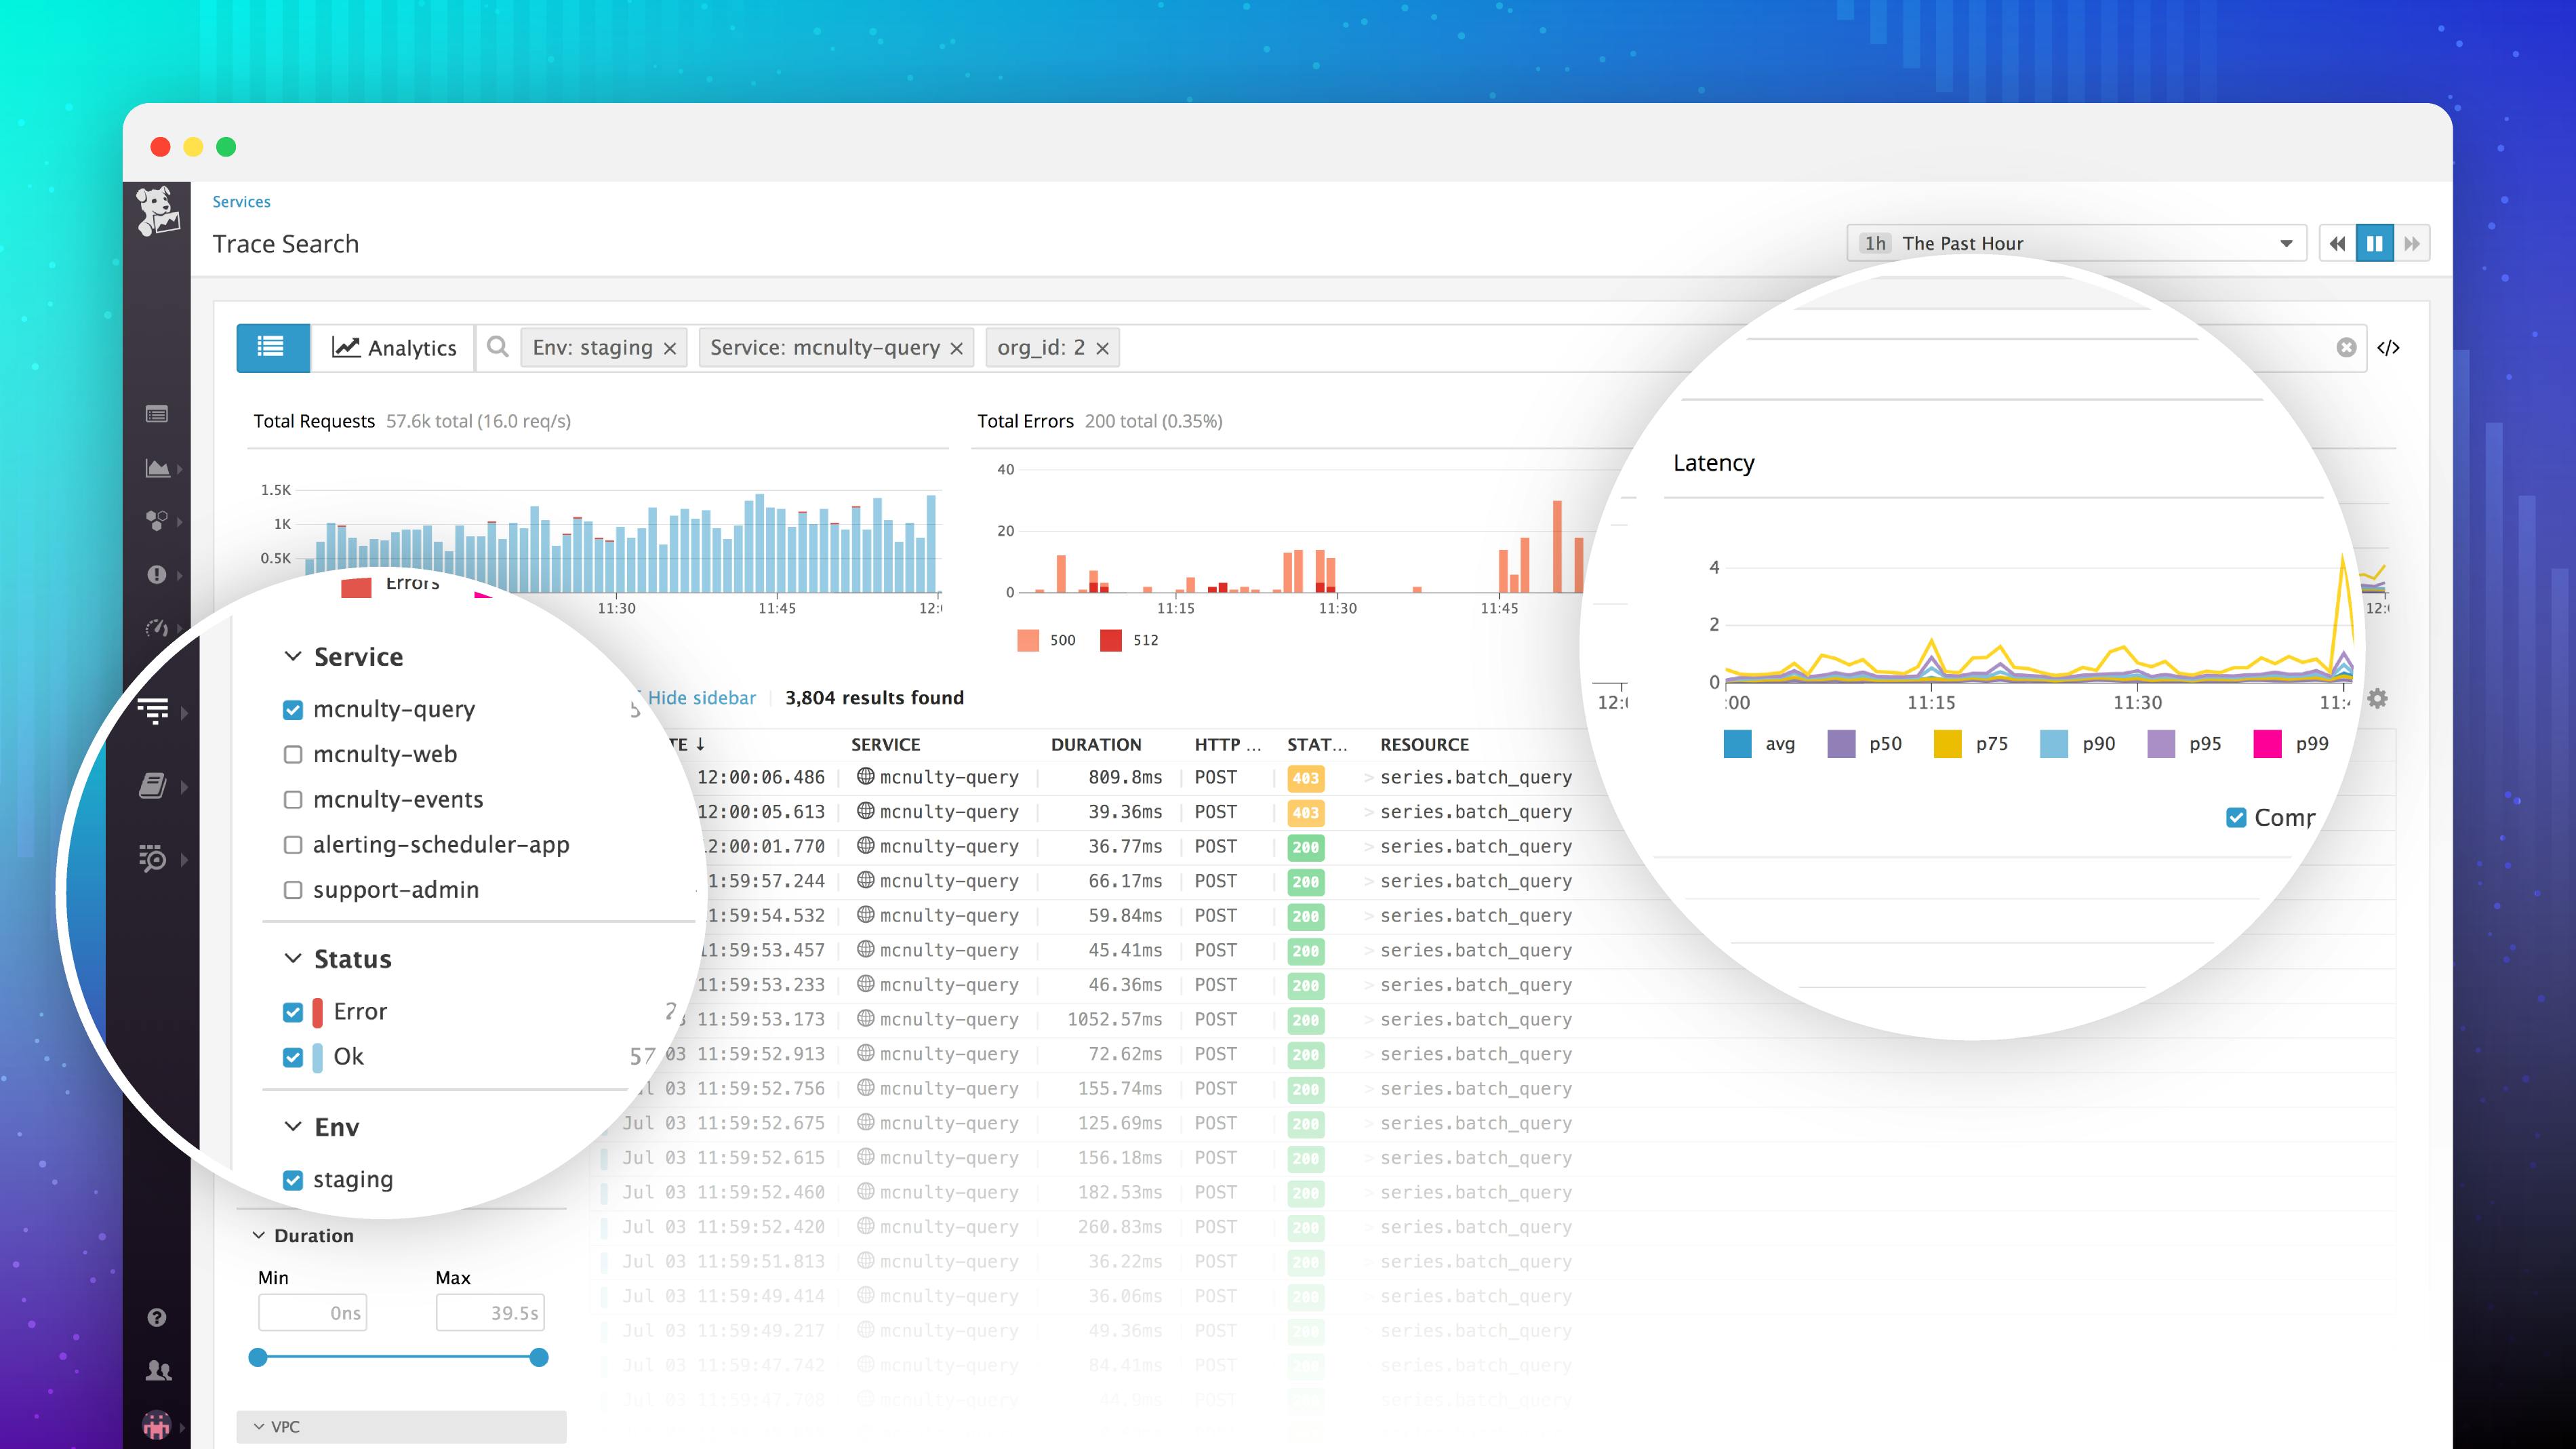
Distributed tracing provides a detailed view into application performance. Each trace shows you how an individual request was executed in your app: which user did what, which services were involved, how long it took, and whether the request executed successfully. Capturing that level of detail across hundreds or thousands of services provides a vast trove of information for troubleshooting and performance optimization, but it’s not always easy to find the exact spans you need. The challenge is compounded when you want to filter or aggregate your data using high-cardinality dimensions like customer ID, user ID, or checkout value.
We are excited to unveil App Analytics to make it easy to explore and analyze all your spans in one place. App Analytics puts tagging front-and-center in APM, so you can quickly filter down to find traces from any service, endpoint, customer, group of customers, or any other subset of your data. And because App Analytics is built around the same tags you already use to filter and aggregate infrastructure metrics and logs in Datadog, it seamlessly unifies the three pillars of observability—metrics, traces, and logs.
Drill down and analyze every span, fast
Even if you have thousands of services or millions of users, App Analytics enables you to pinpoint the exact traces you need for troubleshooting or debugging in seconds. Drill down and filter using any tags applied to your analyzed spans, whether they are automatically applied by Datadog or customized to your own applications and business.
Any dimension, any tag, infinite cardinality
Traces carry tags that not only relate to your infrastructure and your code, such as application version or cluster name, but also to who your users are and what they’re doing in your product. Datadog automatically applies tags based on the application and infrastructure, such as the name of the service, the requested endpoint, the status code of the response, the host, and the availability zone where it is running. You can additionally apply custom tags such as customer IDs, transaction types, product SKUs, and so on, so you can instantly search and filter by any dimension that matters to your product and business.
Slice performance aggregates on the fly
Any way you slice your traces, App Analytics returns top-level performance statistics along with the list of analyzed spans. So you can quickly determine the 99th-percentile latency for a single customer, or the number of errors for an individual user on a specific service. Those performance aggregates allow you to identify the impact of a performance issue, for all your users or for a particular subset, and then dive directly into the analyzed spans for request-level detail.
Investigate traces from any subset of data with App Analytics.
Analytics and graphing
App Analytics provides a brand-new Analytics interface that allows you to aggregate and visualize your data using high-cardinality attributes. So you can compute the number of unique users per customer account that are accessing the beta version of your app, to determine which customers are making the most use of new functionality. Or you can graph the 90th-percentile latency for the customers seeing the slowest response times over the past hour, to quickly assess who is being most affected by performance problems.
Add to dashboards and monitor over time
The real-time Analytics views in App Analytics are invaluable for on-the-fly troubleshooting and spot-checking, but you can also save these views for continuous monitoring by adding them to your dashboards. You can export a query directly from App Analytics to an existing dashboard, or build an APM query widget in the drag-and-drop dashboard editor. These widgets allow you to monitor the data from your analyzed spans alongside your metrics and log events, so you have total visibility into your applications and infrastructure—not just in a single platform, but in a single dashboard.
Tags: Unifying the three pillars of observability
By putting tags at the center of APM, App Analytics unites the three pillars of observability—metrics, traces, and logs—more completely than ever before. Not only can you visualize data from all three sources in a single dashboard, but you can pivot between related data sources using common tags. From any analyzed span, you can pivot immediately from the request trace to system-level metrics that can reveal resource issues on the application host, or to relevant logs emitted at the same time as the analyzed span.
Drill down, analyze, visualize
If you’re already using Datadog APM to monitor the performance of your applications, App Analytics is now available for you to use. If you aren’t yet using Datadog APM, you can start an APM trial today and see how App Analytics gives you unparalleled visibility into your applications and how your customers interact with them.
If you aren’t yet a Datadog customer, get started with a two-week, full-featured trial today.


