AWS Step Functions allows you to coordinate activity from hundreds of services—including AWS Lambda, Amazon EKS, and Amazon API Gateway—to build and orchestrate serverless workflows. With Step Functions, you organize work into workflows known as state machines, in which each state defines a task or decision and specifies the next state in the workflow.
You can track the performance of your Step Functions by monitoring individual states in your workflow—for example, by tracking Lambda metrics or API Gateway requests. But to fully understand your state machine’s performance—and to troubleshoot errors, latency, and unexpected behavior—you need to see all of its states, the relationship between them, and the data that describes their performance.
Datadog’s State Machine Map provides a high-level visualization of your Step Functions workflow, along with execution details from each state—including logs, errors, and latency metrics. In this post, we’ll show you how the State Machine Map provides valuable context and actionable data for each Step Functions execution and helps you monitor your state machine’s performance and troubleshoot workflow issues. We’ll show you how the State Machine Map can help you:
- Get a high-level view of your Step Functions executions
- Understand the branches in your state machine
- Drill down to view monitoring data for any state on the map
Visualize your Step Functions on the State Machine Map
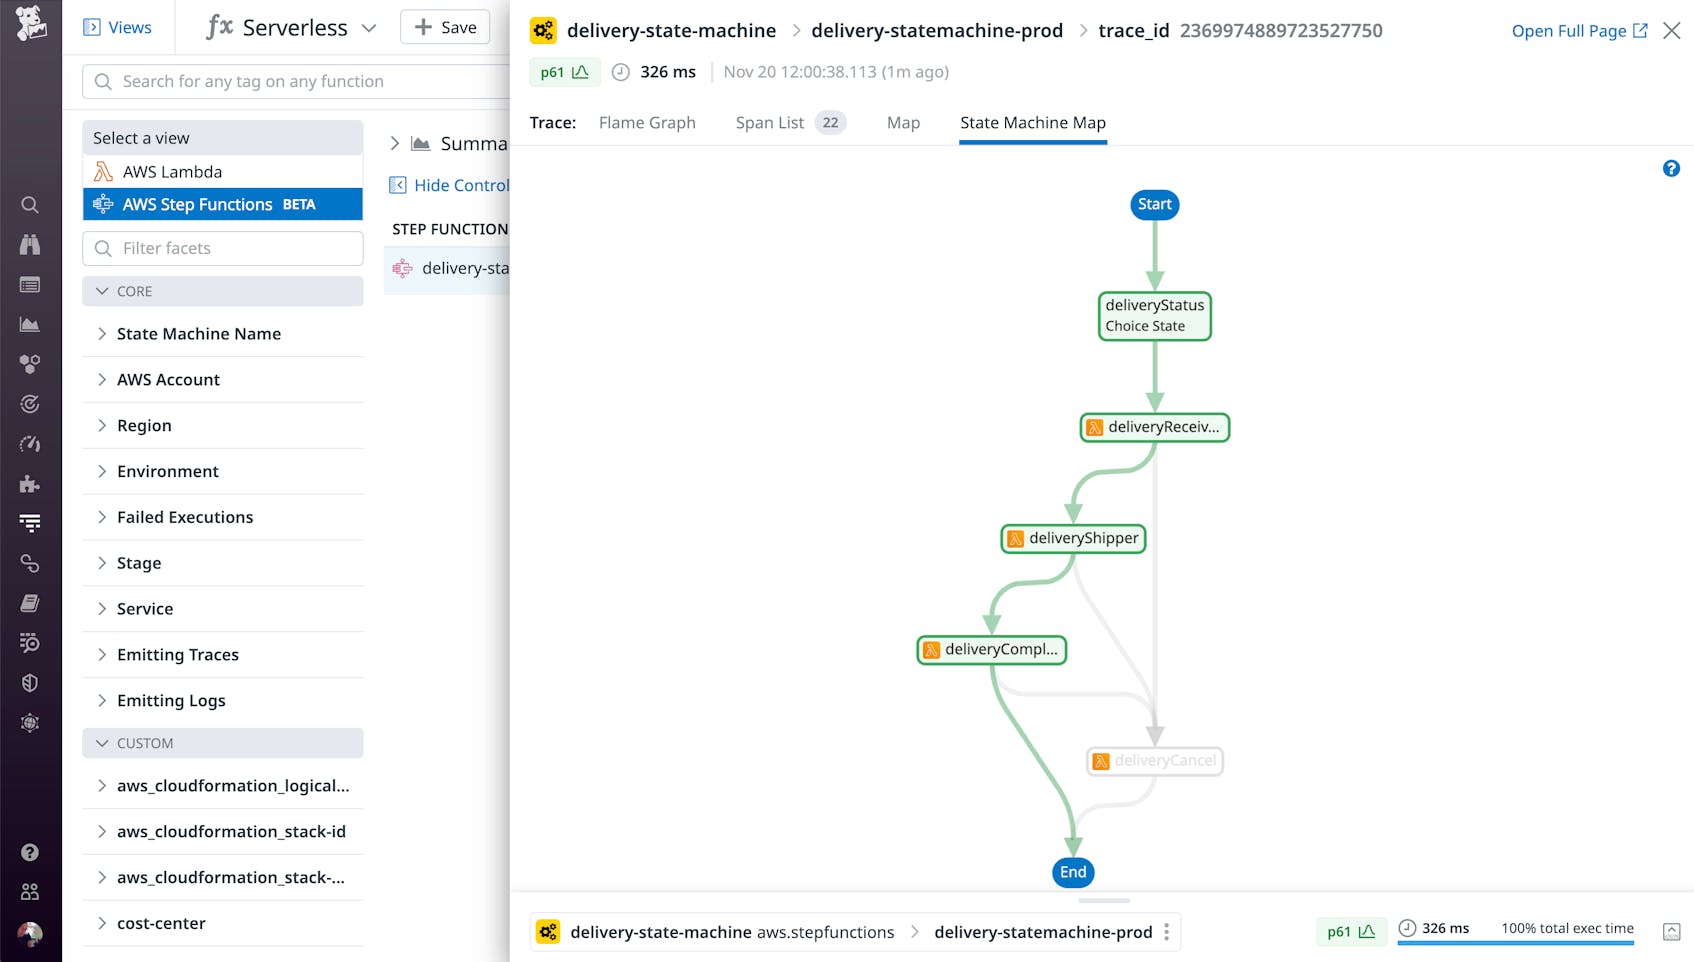
The State Machine Map provides an illustration of any single execution of a workflow. It can help you validate the performance of your state machine by visually confirming that the execution transitioned through all states without errors and completed successfully. If an execution fails, you can troubleshoot by reviewing its map, which clearly identifies any states that returned an error during the execution.
In the screenshot below, the State Machine Map shows the successful execution of a workflow comprising four states. Color-coding shows that each state in the workflow has succeeded, and arrows show that each state passed the execution to the next state downstream.
The State Machine Map visualizes a single execution of a workflow, but you can also troubleshoot that workflow’s performance over time by viewing its map through successive executions. For example, if a workflow fails following a code deployment, you can compare the map of the failed execution to an earlier one to surface any differences in the performance of the states. If the states show different outcomes across executions, you can use this information to focus your troubleshooting efforts (e.g., look for specific code changes that may have introduced errors in the states that began to fail).
Understand your Step Functions workflows’ branches
You can create a workflow that comprises multiple branches of execution—for example, to use conditional logic to transition to one state if an input value is present or a different state if the value is not present. This allows you to model complex logic by determining dynamically which state will be executed next.
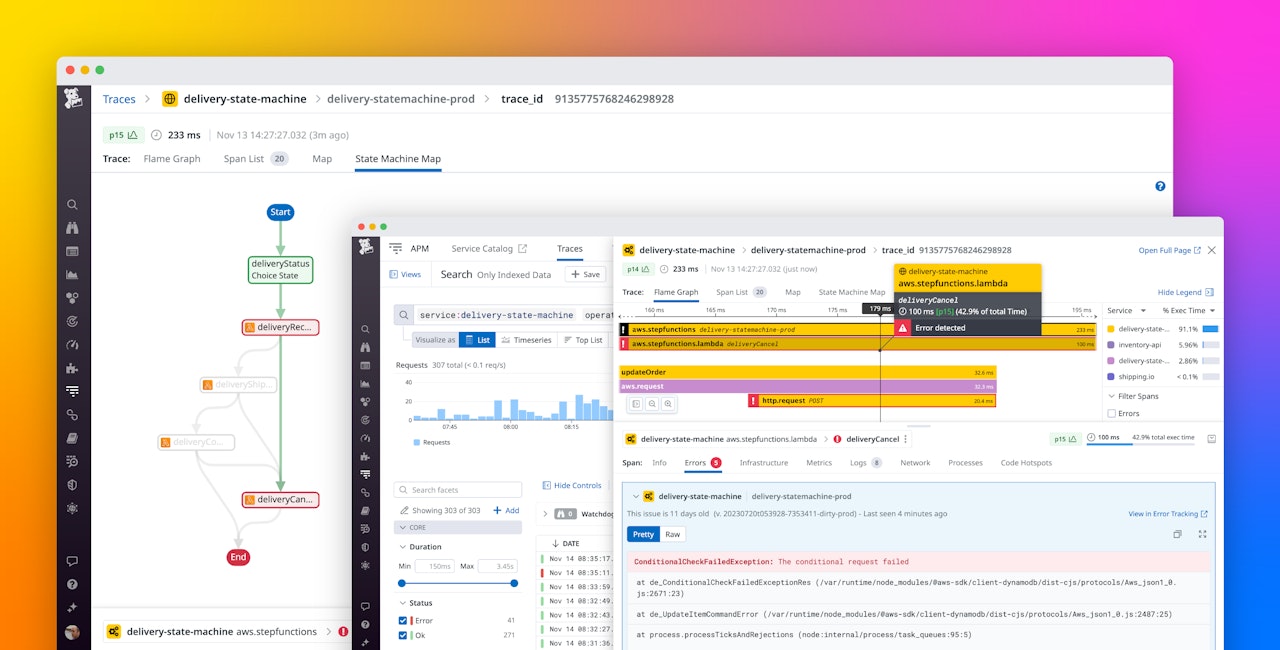
In the screenshot below, the second state in the workflow—deliveryReceiver—uses conditional logic to determine which state is triggered next. In the execution shown, the deliveryReceiver state failed with an error. As a result, the execution proceeded on the branch that led to the deliveryCancel state and did not trigger the deliveryShipper or deliveryComplete states along the opposite branch. By default, an execution fails when any of its states return an error. The end state shown here is color-coded to indicate that the workflow execution failed.
In a state machine that includes multiple branches, any single execution will follow only one of the available branches. Understanding which branches were part of an execution and which states contributed to the performance of your workflow allows you to narrow down the states you need to troubleshoot. If the execution follows an unexpected branch, you may need to troubleshoot your states’ conditional logic to ensure that they’re transitioning to the right states under the given conditions. And by comparing different executions that involve different branches, you can further refine your troubleshooting to quickly see whether a bug is present in only one of the branches.
Troubleshoot errors in your state machine
Once you know which states comprise your workflow and which of them were triggered, you can quickly drill down into any state’s data to troubleshoot errors and performance issues. You can easily see whether any states are adding latency or resulting in errors that cause the state machine to fail.
To dig even deeper, you can quickly pivot from the State Machine Map to the flame graph to see how the affected state depends on other services. Spans in the flame graph are tagged with data including each state’s input and output values, which you can use to quickly reproduce errors that are causing your workflows to fail. You can also view logs from each span to gather even more information about the state’s activity and errors. In the screenshot below, the flame graph shows that the deliveryReceiver service has made an HTTP request to a dependency, and that call resulted in a ConditionalCheckFailedException error. This example shows how—by leveraging both the State Machine Map and the flame graph—you can quickly detect a failed workflow, spot the affected state, and determine a root cause.
Quickly debug Step Functions with the State Machine Map
The State Machine Map combines a high-level view of your Step Functions with actionable data about your workflow states to speed up troubleshooting. To begin using the State Machine Map, enable the AWS Step Functions integration and then install serverless monitoring for Step Functions. See the documentation for more information, and if you’re not already using Datadog, start today with a free trial.


