Editor’s note: OpenShift uses the term “master” to describe its architecture and certain metric names. Datadog does not use this term. Within this blog post, we will refer to this term as “primary”, except for the sake of clarity in instances where we must reference a specific metric name.
In Part 1 of this series, we looked at the key observability data you should track in order to monitor the health and performance of your Red Hat OpenShift environment. Broadly speaking, these include cluster state data, resource usage metrics, and information about cluster activity such as control plane metrics and cluster events. In this post, we’ll cover how to access this information using tools and services that come with a standard OpenShift installation. In particular we will show how to:
- perform more detailed monitoring and analysis with the OpenShift web console
- make command line spot checks on your cluster metrics
- view OpenShift control plane and pod logs and events
First, it’s useful to look at the OpenShift monitoring stack and how it provides out-of-the-box access to all the important data you need to monitor your clusters.
OpenShift monitoring stack
As of version 3.11, OpenShift Container Platform installations provide a preconfigured monitoring system that is based on a Kubernetes monitoring stack that uses Prometheus. Note that this stack is separate from OpenShift Telemetry, which collects data about your cluster and forwards it to Red Hat. We will not be covering OpenShift Telemetry in this post.
Versions of OpenShift prior to 3.11 used a monitoring system based on Heapster and Hawkular Metrics. As OpenShift no longer supports versions below 3.11, we will not be discussing that type of setup.
The OpenShift monitoring stack includes the Cluster Monitoring Operator, which actively manages and updates the rest of the stack. It also includes a number of components for exposing metrics from the various objects in your cluster (kube-state-metrics, node-exporter, Prometheus Adapter), collecting those metrics (Prometheus), alerting on them (Alertmanager), and visualizing them (Grafana).
The two components most relevant to the key metrics we discussed in Part 1 are kube-state-metrics and the Prometheus Adapter, as these access the two primary pipelines for cluster monitoring data available in Kubernetes: the Kubernetes API and the Metrics API. We will briefly cover these pipelines because methods for collecting data from each differ.
Where Kubernetes metrics come from
The Kubernetes API exposes information about the state of the cluster (object counts, resource requests and limits, quotas, etc.). The control plane uses this information to schedule workloads and maintain the desired configuration of cluster objects.
By default, cluster state information is not available in metric format, but can be viewed with tools that directly access the Kubernetes API, such as the oc command line utility. The kube-state-metrics service is a Kubernetes add-on that polls the Kubernetes API for this cluster state data and uses that information to generate metrics that can be collected by an external monitoring service.
The Metrics API makes resource usage and custom metrics from your nodes and containers available to external services. In order to expose metrics through this API, you must deploy a service to your cluster that aggregates that data from the nodes. The OpenShift monitoring stack uses the Prometheus Adapter for this purpose.
Deploying the OpenShift monitoring stack includes both kube-state-metrics and the Prometheus Adapter, ensuring that you have access to the information from the data pipelines that are vital to monitoring OpenShift. Now, we’ll cover how to access more in-depth monitoring and alerting with the OpenShift web console and Prometheus backend. Then, we’ll look at spot checking metrics and cluster data with the OpenShift CLI tool.
Monitor your cluster with the OpenShift web console
The OpenShift web console is a UI that runs as a pod on a primary node. It lets administrators and developers interact with and manage the cluster and their applications. It provides visualizations of cluster object data and, using Prometheus and Grafana, resource and control plane metrics (assuming the monitoring stack is deployed).
Unlike using oc commands, the web console takes advantage of the OpenShift monitoring stack’s persistent storage so that you can retain metric data for dashboarding and historical analysis.
View cluster data in the web console
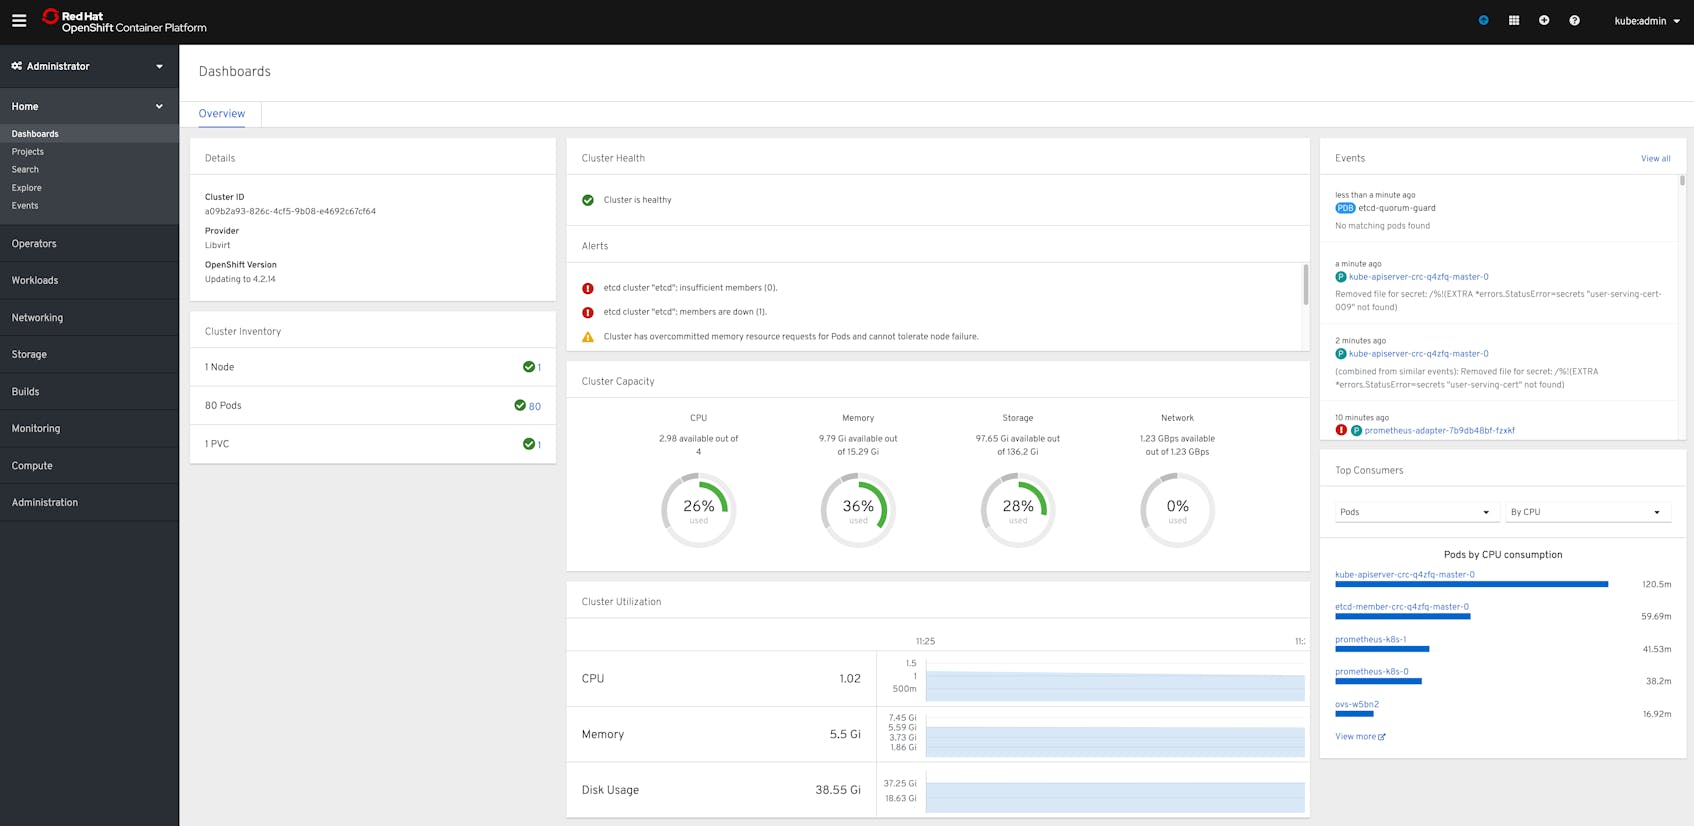
The administrator view of the web console provides visualizations of metrics and cluster data (which you can also query using oc commands). The main dashboard for the web console displays a high-level overview of your cluster, including:
- Object counts broken down by status
- Cluster resource capacity and utilization
- Cluster events
- Triggered alerts
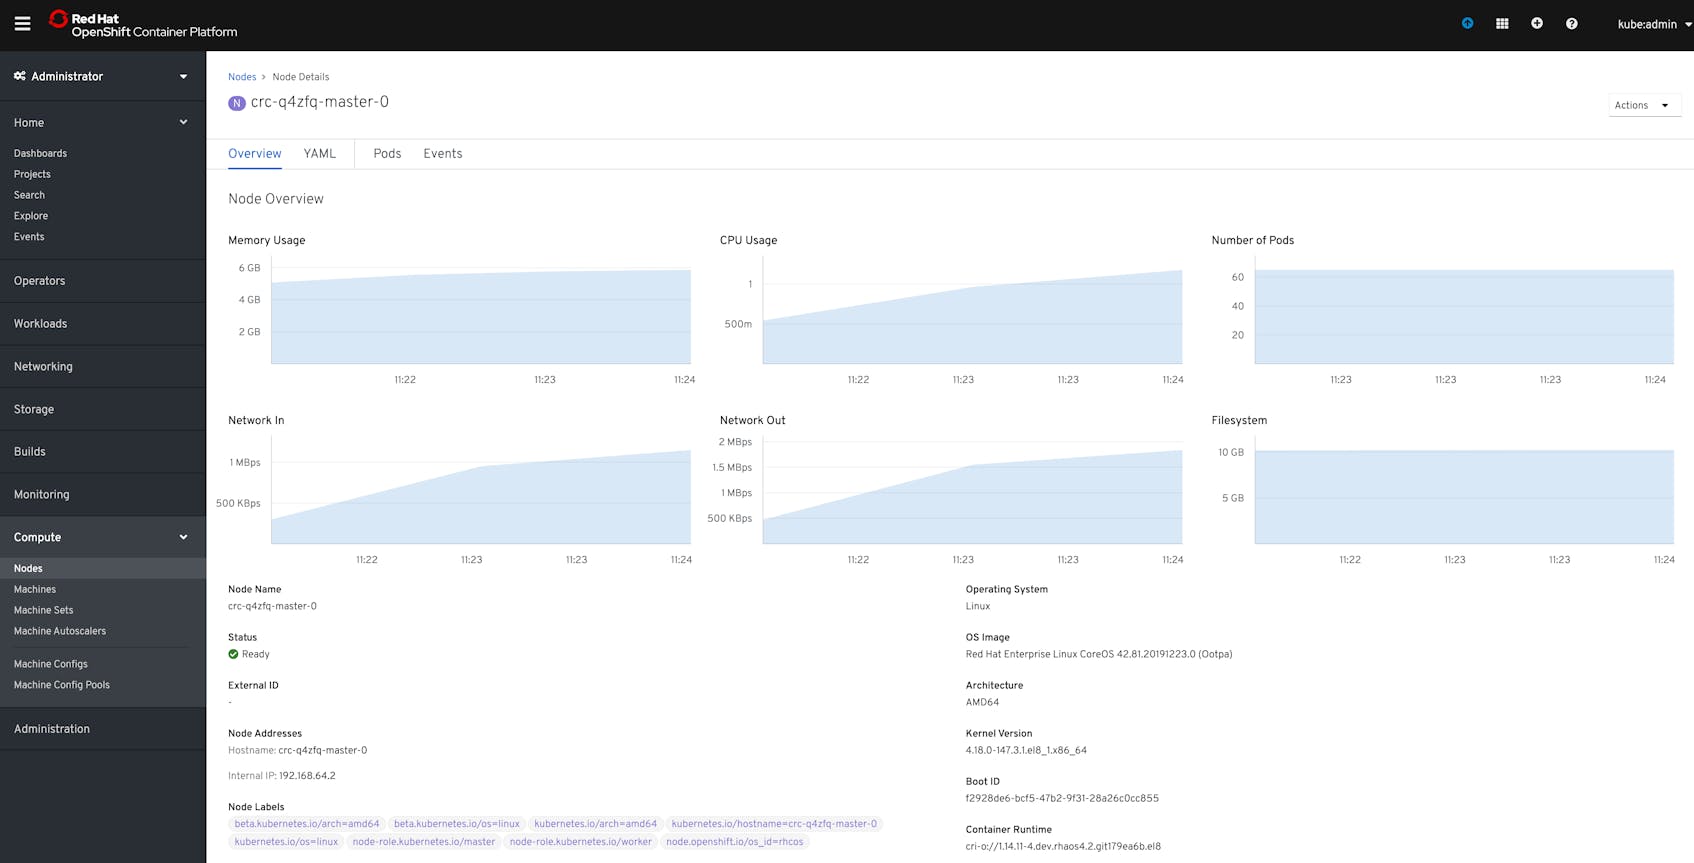
From here, you can navigate to other views to get more detailed data about different objects. For example, from the Nodes tab you can inspect individual nodes to see breakdowns of resource utilization.
From the web console, you can also access additional components of the Prometheus monitoring stack—which we’ll look at in the next section—to manage alerts, view metrics, and create dashboards.
Use Prometheus to monitor your cluster
The components included in the OpenShift monitoring stack allow Prometheus to aggregate metrics from across your cluster. In addition to cluster state data, this includes resource usage data from your nodes and pods, as well as metrics from your control plane.
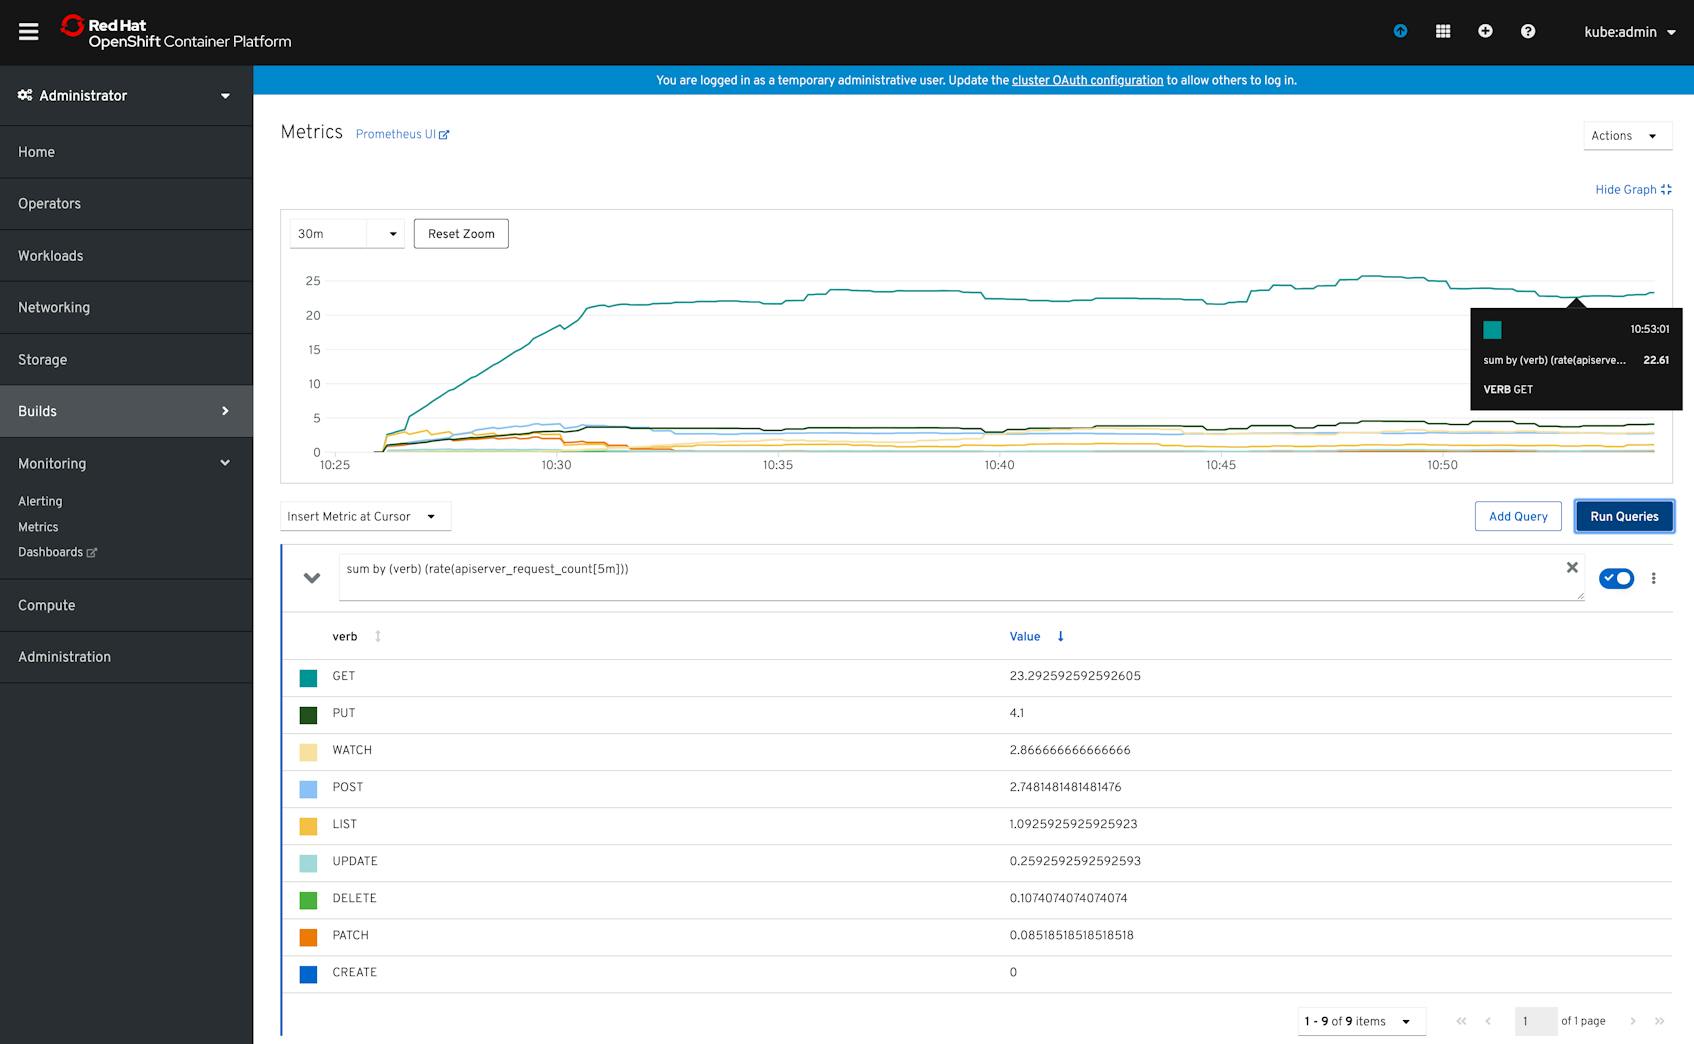
The Metrics tab in the OpenShift web console lets you use the Prometheus UI to query and graph available metrics using the Prometheus Query Language (PromQL). For example, the graph below visualizes the rate of total requests to the API server, broken down by the type of request (e.g., GET, PUT, etc.).
Another component of the OpenShift monitoring stack, Alertmanager, uses Prometheus queries to provide a built-in set of alerts that can help surface issues with the health and performance of your cluster.
Alertmanager
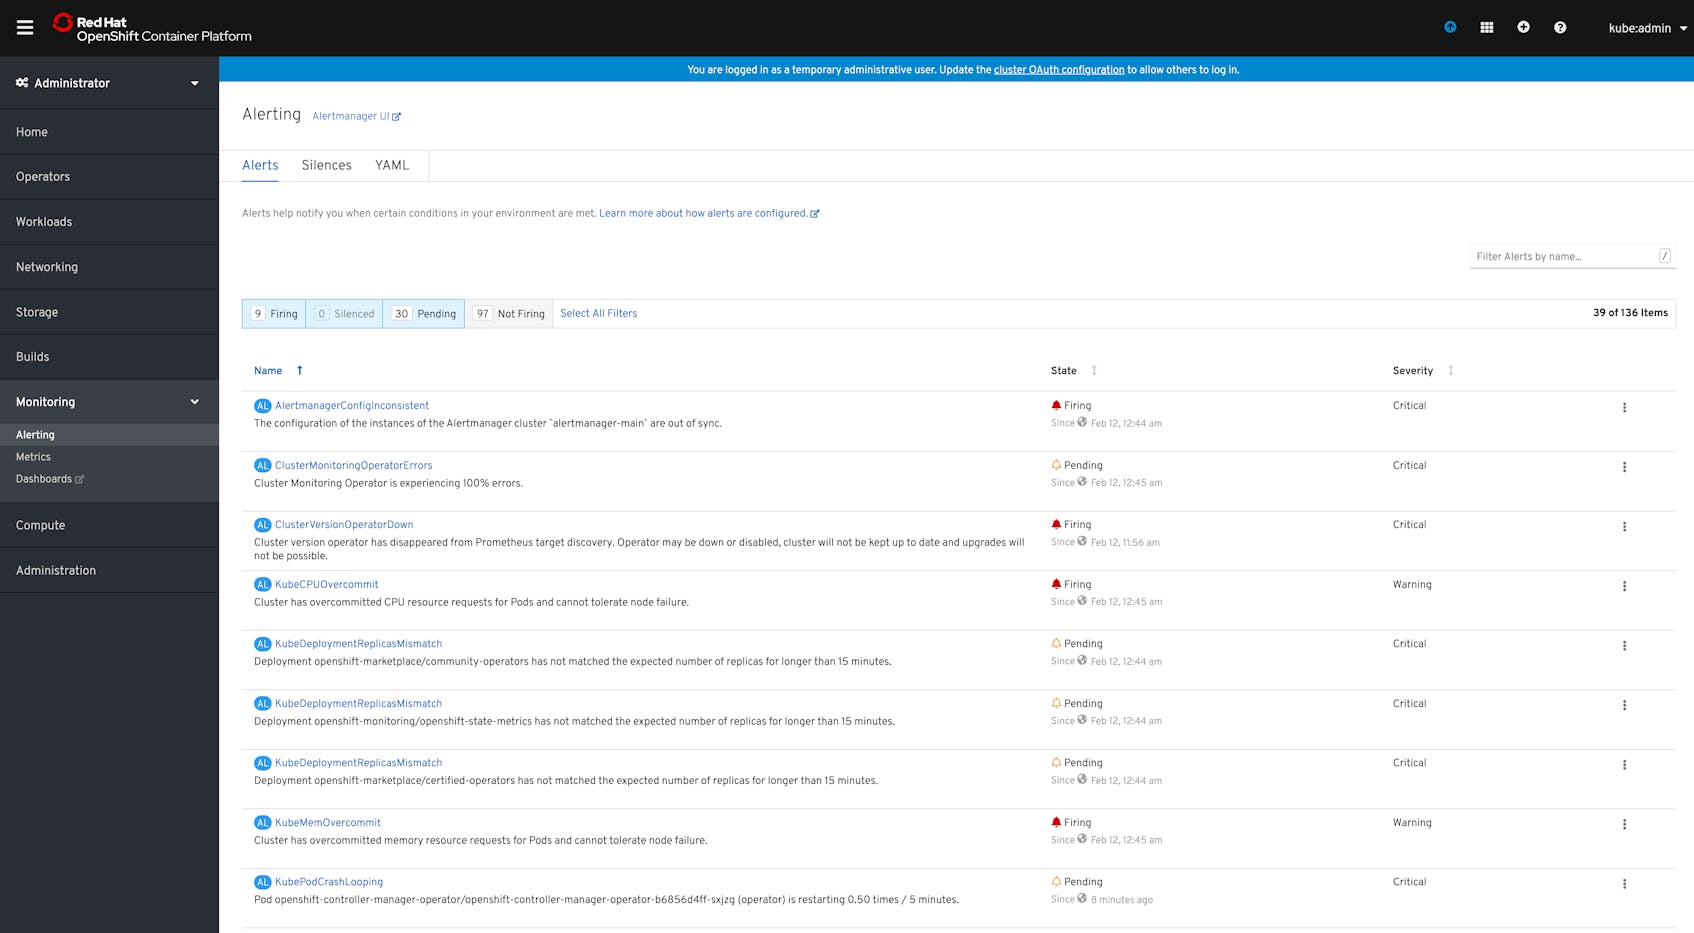
Alertmanager’s pre-built alerts monitor for issues such as inconsistencies in the status of your cluster objects, lack of connectivity with Operators, or failures in Deployments and other pipelines. There are also alerts that can notify you if your nodes’ resources are overcommitted, meaning that your cluster lacks capacity to failover pods if a node crashes.
The main overview dashboard of the web console includes a list of any alerts that are firing. You can also use the Alerting tab in the console to view alerts organized by status, such as firing, not firing, or pending. The pending status occurs when an alert’s conditions are true, but they must remain so for a specified period of time before the status changes to firing.
Spot check metrics and data with oc
Like kubectl, the standard Kubernetes CLI, oc gives OpenShift administrators and developers the ability to interact with their cluster’s APIs. While you can use kubectl natively with OpenShift clusters, oc provides full support for OpenShift’s extended resources and features. If you do not already have it installed, see OpenShift’s documentation for steps to install it in your specific environment.
OpenShift administrators and developers can use oc commands to perform spot checks on the status of the cluster and the resource usage of its objects:
oc getto query object statusoc adm topto view object resource usageoc describeto view resource allocation data
When we discuss collecting logs and events from your cluster, we will also cover using the oc logs and oc adm node-logs commands to get log events from your pods and nodes.
Note that OpenShift differentiates between commands that require developer-level permissions (tasks related to app management, including deployment and debugging), and administrator-level permissions (node- and cluster-level management tasks). In the commands we cover below, we will note when it requires administrator-level cluster access.
Query object status with oc get
The oc get <OBJECT> command will retrieve cluster state metrics for the requested object or type of object. For example:
# Get a list of all Deployments
$ oc get deployments

NAME       READY   UP-TO-DATE   AVAILABLE   AGE
app        3/3     3            3           17s
nginx      1/1     1            1           23m
redis      1/1     1            1           23m
The above example shows three Deployments on our cluster, with a breakdown of how many replicas within each are ready, up to date, and available for connection.
The information returned by oc get depends on the type of object you are querying and can give you a snapshot of the status of your cluster objects so that you can begin investigating if, for example, pods within a specific Deployment are not launching or becoming available.
This command applies to any type of cluster object. For example, you can request a list of resource quotas:
# Get a list of all resource quotas
$ oc get resourcequota

NAME                 CREATED AT
core-object-counts   2020-02-21T19:35:22Z
Get resource usage snapshots with oc adm top
This command requires administrator-level cluster permissions. The oc adm top command gives you a snapshot of resource usage of objects in your cluster, including nodes, pods, and images. For example:
# Get a list of nodes sorted by resource usage
$ oc adm top nodes

NAME                       CPU(cores)   CPU%   MEMORY(bytes)   MEMORY%
crc-q4zfq-master-0         973m         27%    5082Mi          68%
crc-q4zfq-worker-0         865m         25%    3320Mi          44%
Here we can see our cluster nodes with their CPU (m for millicores) and memory usage (Mi for mebibytes) at that moment, as well as what percentage of available resources that usage represents.
Get object details with oc describe
If you want to see details about the resource capacity and the resources that have been allocated to your nodes, rather than the current resource usage, use the oc describe command. This can be particularly useful for checking the resource requests and limits (as explained in Part 1) of all of the pods on a specific node. For example, to view details about a specific OpenShift host returned by the oc adm top node command above, you would run the following:
# Get details for the specified node
$ oc describe node crc-q4zfq-master-0
The output is verbose, containing a full breakdown of the node’s workloads, system info, and metadata, such as labels and annotations. Below, we’ll excerpt the portions of the output that display information about the node’s status and resource capacity, and that show resource requests and limits at the pod level, as well as for the entire node:
Conditions:
  Type             Status  LastHeartbeatTime                 LastTransitionTime                Reason                       Message
  ----             ------  -----------------                 ------------------                ------                       -------
  MemoryPressure   False   Tue, 18 Feb 2020 12:54:13 -0500   Tue, 11 Feb 2020 11:28:24 -0500   KubeletHasSufficientMemory   kubelet has sufficient memory available
  DiskPressure     False   Tue, 18 Feb 2020 12:54:13 -0500   Tue, 11 Feb 2020 11:28:24 -0500   KubeletHasNoDiskPressure     kubelet has no disk pressure
  PIDPressure      False   Tue, 18 Feb 2020 12:54:13 -0500   Tue, 11 Feb 2020 11:28:24 -0500   KubeletHasSufficientPID      kubelet has sufficient PID available
  Ready            True    Tue, 18 Feb 2020 12:54:13 -0500   Tue, 18 Feb 2020 09:20:52 -0500   KubeletReady                 kubelet is posting ready status
Addresses:
  InternalIP:  192.168.64.2
  Hostname:    crc-q4zfq-master-0
Capacity:
  cpu:            4
  hugepages-1Gi:  0
  hugepages-2Mi:  0
  memory:         8163928Ki
  pods:           250
Allocatable:
  cpu:            3500m
  hugepages-1Gi:  0
  hugepages-2Mi:  0
  memory:         7549528Ki
  pods:           250

[...]

Non-terminated Pods:                                     (62 in total)
  Namespace                                              Name                                                               CPU Requests  CPU Limits  Memory Requests  Memory Limits  AGE
  ---------                                              ----                                                               ------------  ----------  ---------------  -------------  ---
  openshift-apiserver-operator                           openshift-apiserver-operator-7bcd69678-6xtt7                       10m (0%)      0 (0%)      50Mi (0%)        0 (0%)         19d
  openshift-apiserver                                    apiserver-48lkj                                                    150m (4%)     0 (0%)      200Mi (2%)       0 (0%)         19d
  openshift-authentication-operator                      authentication-operator-55f4b64744-pb2xd                           10m (0%)      0 (0%)      50Mi (0%)        0 (0%)         19d
  openshift-authentication                               oauth-openshift-79b6c9f645-fx64q                                   10m (0%)      0 (0%)      50Mi (0%)        0 (0%)         6d1h
  openshift-authentication                               oauth-openshift-79b6c9f645-gczw9                                   10m (0%)      0 (0%)      50Mi (0%)        0 (0%)         6d1h
[...]

Allocated resources:
  (Total limits may be over 100 percent, i.e., overcommitted.)
  Resource           Requests      Limits
  --------           --------      ------
  cpu                2560m (73%)   300m (8%)
  memory             7305Mi (99%)  587Mi (7%)
  ephemeral-storage  0 (0%)        0 (0%)
Among other data, we can see that oc describe returns:
- a summary of the node’s status the node’s overall and allocatable (overall minus system process overhead) resource capacity
- a list of pods running on the node, their CPU and memory requests and limits, and the percentage of the total existing requests and limits each represents
- a sum of allocated resources broken down by requests and limits, along with the percentage of the total allocatable capacity each represents
View OpenShift logs
Viewing metrics and metadata about your nodes and pods can alert you to problems with your cluster. For example, you can see if replicas for a Deployment are not launching properly, or if your nodes are running low on available resources. But troubleshooting a problem may require more detailed information and application-specific context, which is where logs can come in handy.
Pod logs
The oc logs command dumps or streams logs written to stdout from a specific pod or container:
$ oc logs <POD_NAME> # query a specific pod's logs
$ oc logs <POD_NAME> -c <CONTAINER_NAME> # query a specific container's logs
If you don’t specify any other options, this command will simply display all available stdout logs from the specified pod or container. And this does mean all, so filtering or reducing the log output can be useful. For example, the --tail flag lets you restrict the output to a certain number of the most recent log messages:
$ oc logs --tail=25 <POD_NAME>Another useful flag is --previous, which returns logs for a previous instance of the specified pod or container. You can use this, for example, to view the logs of a crashed pod for troubleshooting:
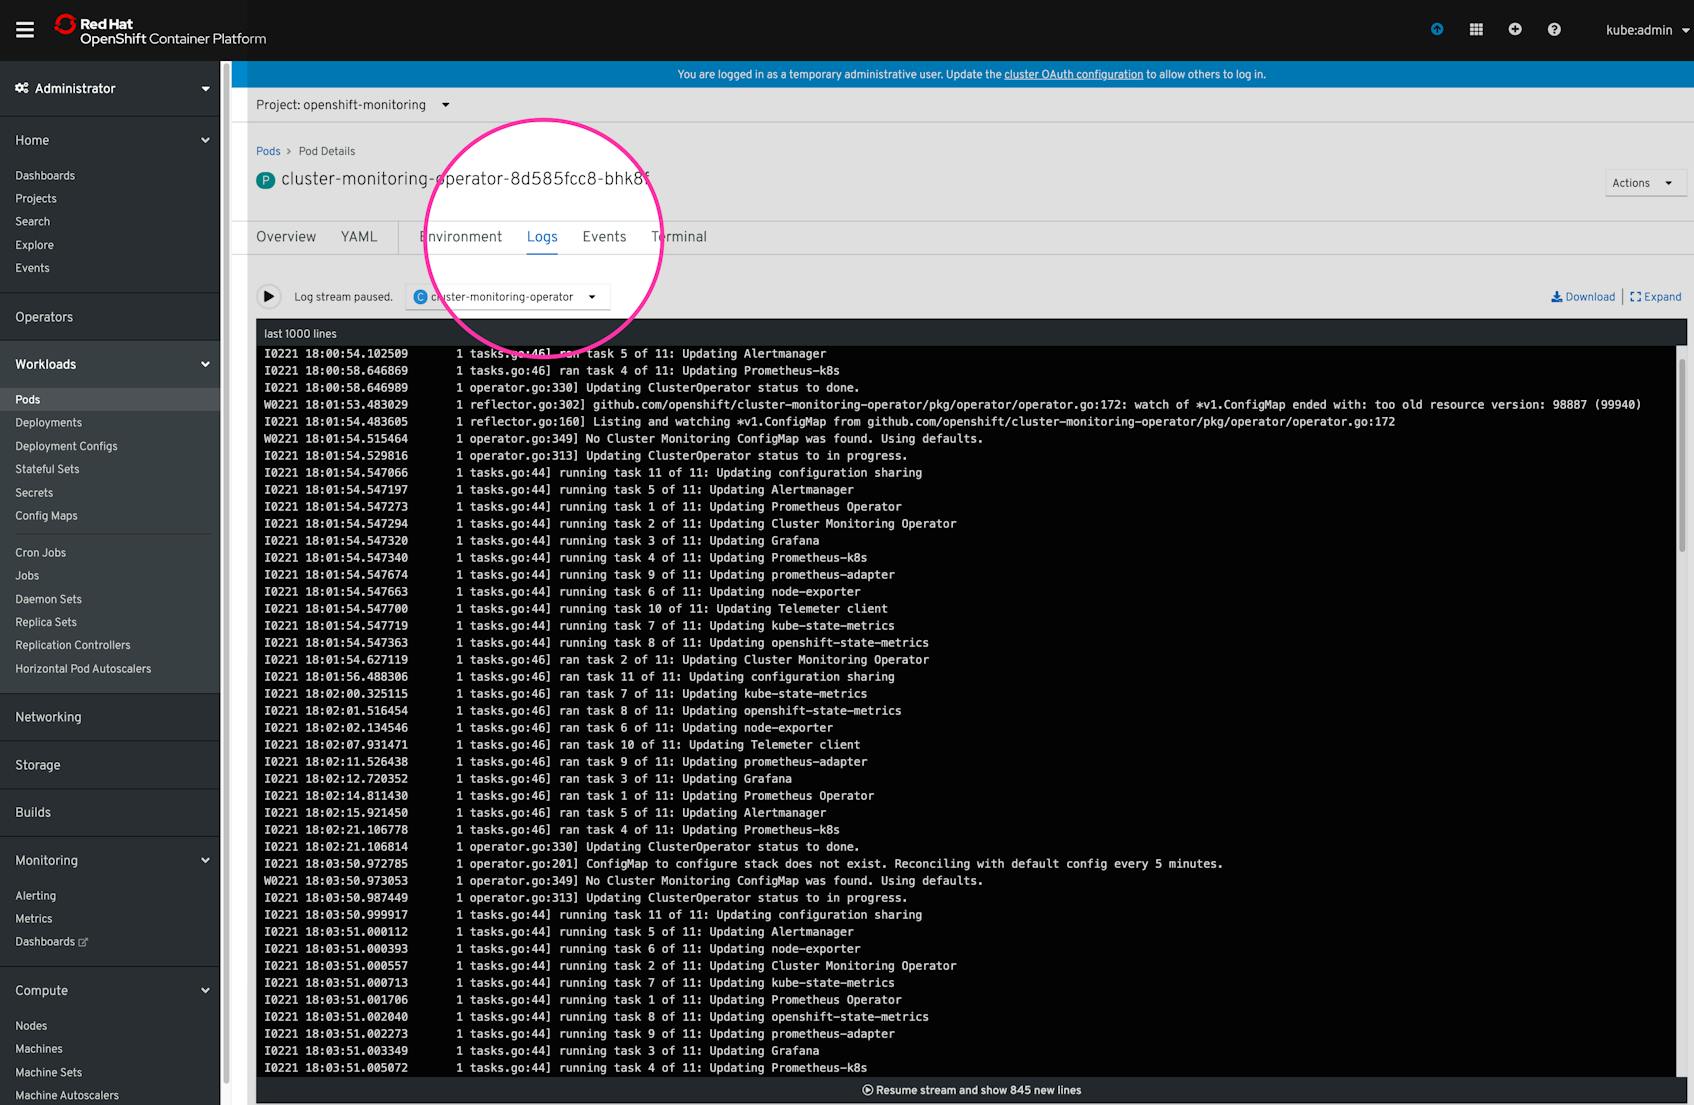
$ oc logs <POD_NAME> --previousNote that you can also view the stream of logs from a pod in the OpenShift web console. When viewing details of a specific pod, click on the “Logs” tab to access a log stream from the pod in the browser, which can be further segmented by container if the pod comprises multiple containers.
Node logs
This command requires administrator-level cluster permissions. The oc adm node-logs command can return logs from the system services running on your nodes.
By itself, this command would give you all available logs from all of your nodes. You can narrow things down with additional parameters. For example, you can query only your primary nodes using the --role parameter:
$ oc adm node-logs --role=masterYou can also query a specific node:
$ oc adm node-logs test-nodeIf you want to see logs emitted by a certain system service, you can filter to only those logs:
$ oc adm node-logs --role=master -u NetworkManager.serviceAPI audit logs
Audit logs record all requests to the Kubernetes API server. This means that they can provide valuable insight into cluster events by recording which users or services requested access to cluster resources—and why the API server authorized or rejected those requests. This is particularly important for ensuring your cluster remains secure and available for legitimate requests.
In OpenShift 3.11, audit logs are disabled by default. To enable them, edit your host configuration options using Ansible. You can then find audit log files on each primary host.
Audit logging is enabled by default in OpenShift 4.x. You can use the oc adm node-logs command to access them. First, use the following command to identify which primary node you want to query as well as the name of the log file. This will return a list of all primary nodes in your cluster along with what files are available in the openshift-apiserver directory, which is where OpenShift writes audit log files.
$ oc --insecure-skip-tls-verify adm node-logs --role=master --path=openshift-apiserver/You can then use that information to view that specific log file from an individual primary node. For example:
$ oc adm node-logs crc-q4zfq-master-0 audit.log --path=openshift-apiserver/audit.log OpenShift logging stack
Similar to the OpenShift monitoring stack, OpenShift provides a logging stack that lets you collect, store, and visualize logs from your pods and nodes. This stack includes several components, such as Fluentd for aggregation and processing, Elasticsearch for storage, and Kibana for visualization. The logging stack is not deployed by default. You can find steps for deploying it in OpenShift’s documentation. Note that these steps are for OpenShift version 4.1 and above.
Full cluster monitoring with Datadog
As we’ve shown in this post, OpenShift extends Kubernetes’s built-in monitoring features to give you access to cluster health and performance data. But for monitoring production environments, you need visibility into your OpenShift infrastructure as well as your containerized applications themselves, with much longer data retention and lookback times. Datadog provides full-stack visibility into OpenShift environments, with:
- seamless integrations with Kubernetes, CRI-O, and all your containerized applications, so you can see all your metrics, logs, and traces in one place
- the ability to monitor applications in large-scale dynamic environments
- advanced monitoring features including outlier and anomaly detection, forecasting, and automatic correlation of observability data
From cluster status and resource metrics to distributed traces and container logs, Datadog brings together all the data from your infrastructure and applications in one platform. Datadog automatically collects labels and tags from Kubernetes and your containers, so you can filter and aggregate your data across the different types of objects and layers that make up your cluster, such as by Deployment, node, or project. The next and last part of this series describes how to use Datadog for monitoring OpenShift clusters, and shows you how to start getting visibility into every part of your containerized environment in minutes.
Source Markdown for this post is available on GitHub. Questions, corrections, additions, etc.? Please let us know.


