Multi-line logs such as stack traces give you lots of very valuable information for debugging and troubleshooting application problems. But, as anyone who has tried knows, it can be a challenge to collect stack traces and other multi-line logs so that you can easily parse, search, and use them to identify problems. This is because, without proper configuration, log management services and tools do not treat multi-line logs as a single event. Instead, each line is processed separately, increasing logging overhead and making it difficult to interpret your applications’ activity, since related information gets separated across disparate logs instead of appearing in a single log message.
In this post, we will go over strategies for handling multi-line logs so that you can use them to identify and solve problems that arise in your environment.
The multi-line logging problem
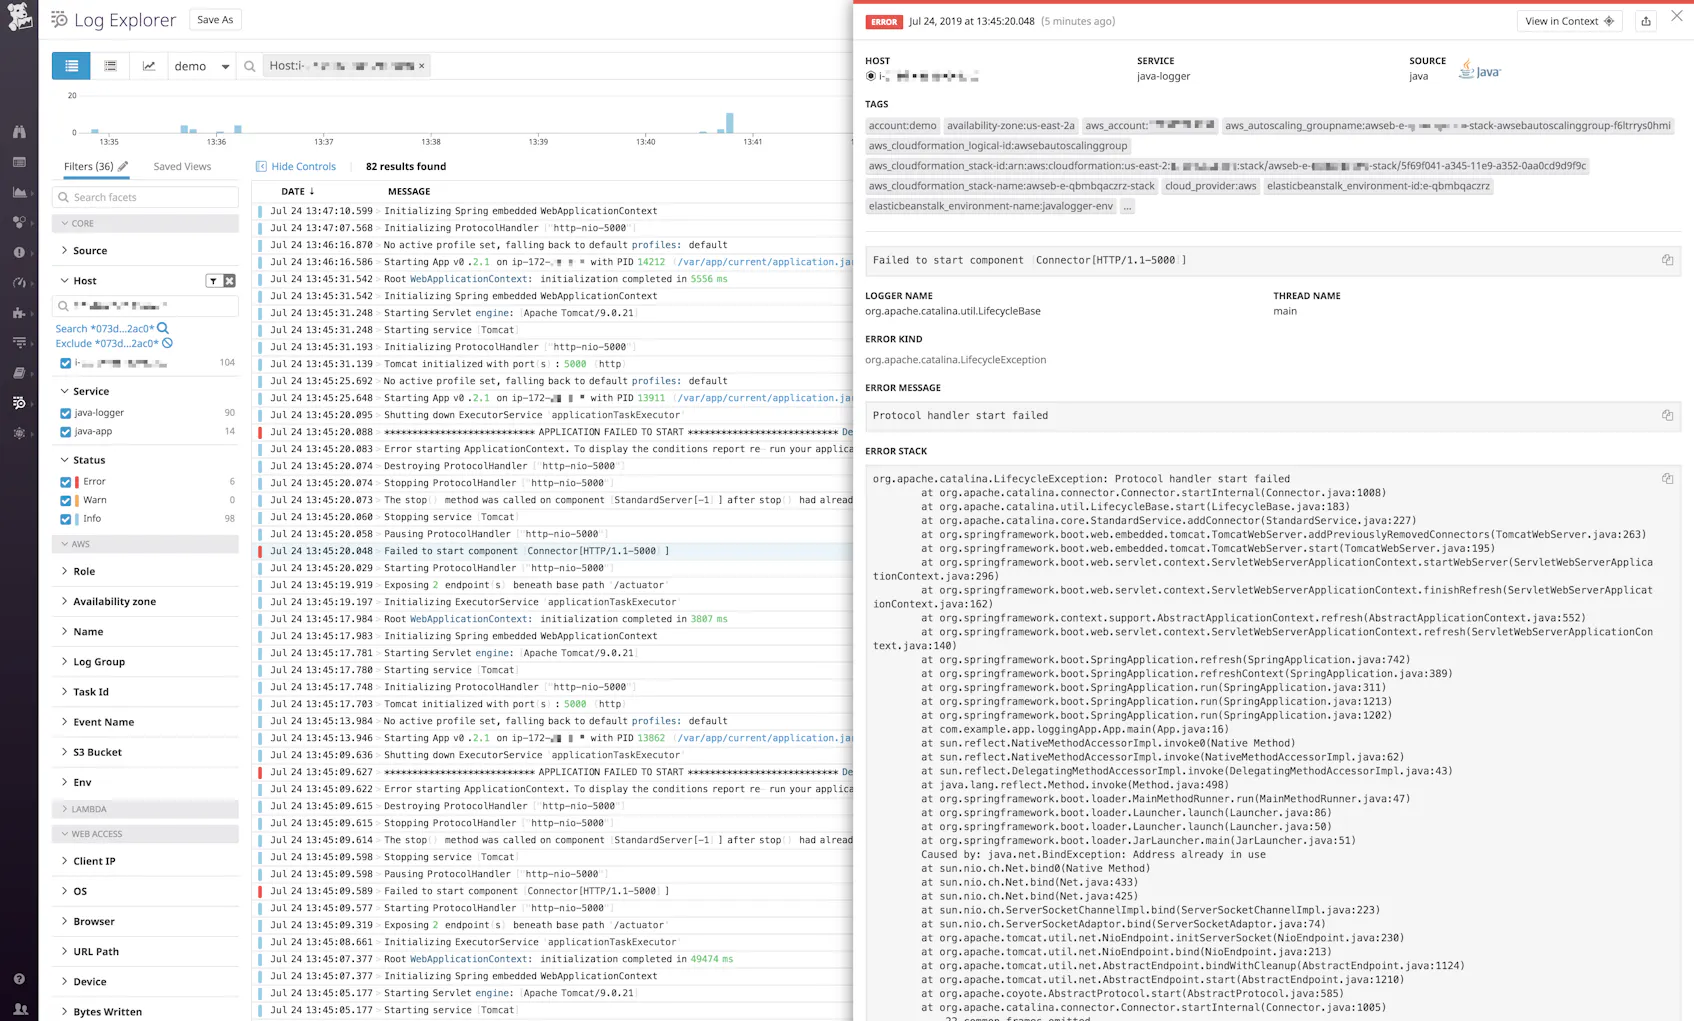
Below, we can see a log stream in a log management service that includes several multi-line error logs and stack traces. Each line is treated as an individual log event, and it’s not even clear if the lines are being streamed in the correct order, or where a stack trace ends and a new log begins.
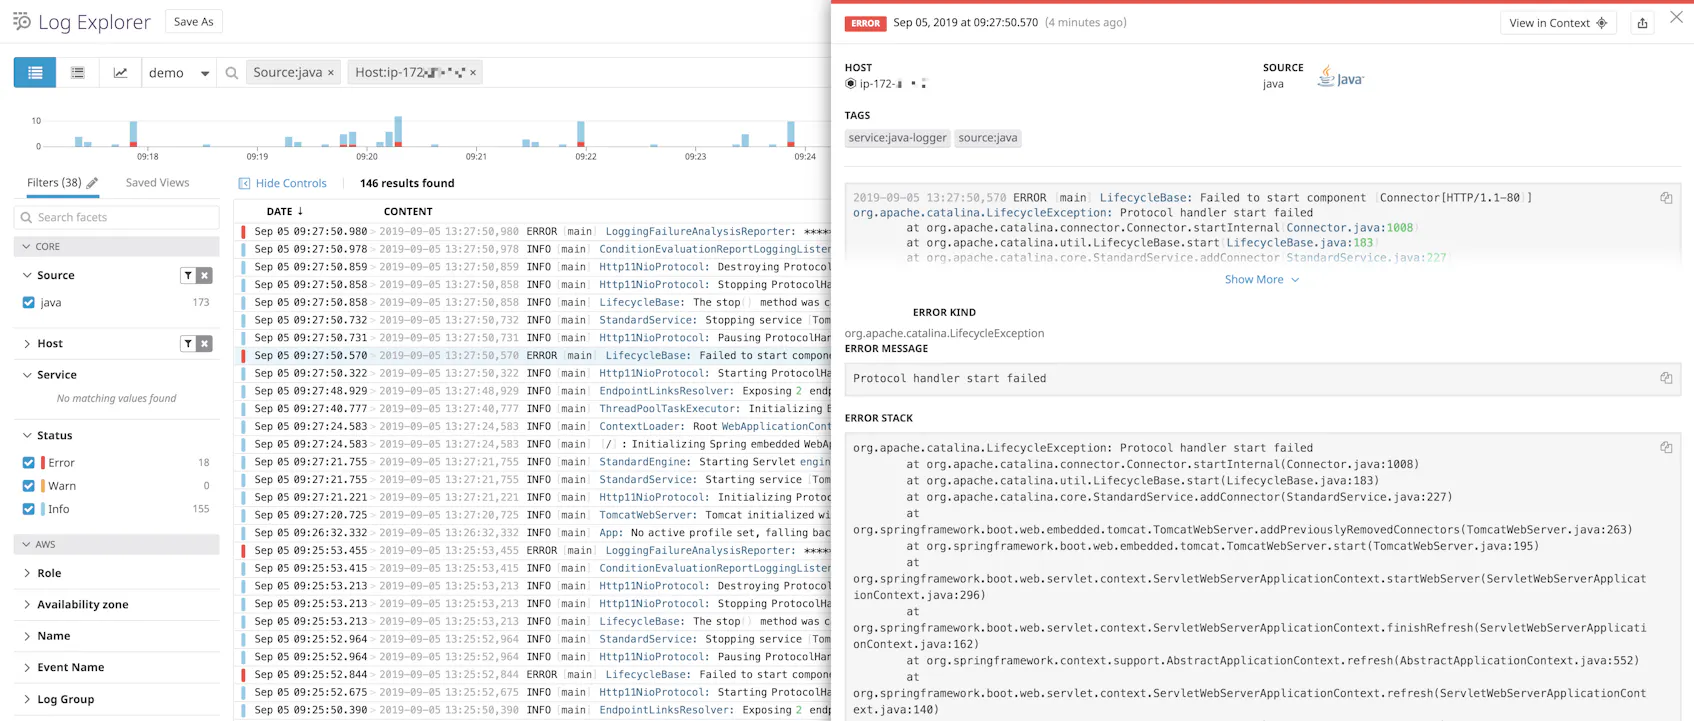
This in turn means troubleshooting your problems is much harder. In order for multi-line logs to be useful, we need to aggregate each of them as a single event, as shown below. Now that each stack trace is collapsed into a single log line, you can easily identify the initial function that generated an error. Or, you can use a search term to identify an entire log instead of just the single line that contains the term.
Handling multi-line logs
We will go over two primary methods for collecting and processing multi-line logs in a way that aggregates them as single events:
In either case, we generally recommend that you log to a file in your environment. This has several benefits over other logging methods. First, it ensures that log lines are written sequentially, in the correct order. Second, it means that issues with your network connectivity won’t affect your application’s ability to log events. Finally, it reduces overall application overhead as your code will not be responsible for forwarding logs to a management system.
Note that if you have a containerized environment, we recommend logging to STDOUT so that your orchestrator can aggregate and write them to a file.
Logging to JSON
The simplest way to ensure that your multi-line logs are processed as single events is to log to JSON. For example, the following is an example of a Java stack trace log written to a file without JSON:
javaApp.log
2019-08-14 14:51:22,299 ERROR [http-nio-8080-exec-8] classOne: Index out of range
java.lang.StringIndexOutOfBoundsException: String index out of range: 18
	at java.lang.String.charAt(String.java:658)
	at com.example.app.loggingApp.classOne.getResult(classOne.java:15)
	at com.example.app.loggingApp.AppController.tester(AppController.java:27)
	at sun.reflect.NativeMethodAccessorImpl.invoke0(Native Method)
	at sun.reflect.NativeMethodAccessorImpl.invoke(NativeMethodAccessorImpl.java:62)
	at sun.reflect.DelegatingMethodAccessorImpl.invoke(DelegatingMethodAccessorImpl.java:43)
	at java.lang.reflect.Method.invoke(Method.java:498)
	at org.springframework.web.method.support.InvocableHandlerMethod.doInvoke(InvocableHandlerMethod.java:190)
	at org.springframework.web.method.support.InvocableHandlerMethod.invokeForRequest(InvocableHandlerMethod.java:138)
[...]
This log would appear in a log management service as multiple log lines. Instead, we can log the same message to JSON. Note that if you are using Log4J2, you must include the compact="true" flag. This removes end-of-line characters and indents. The resulting JSON would look like the following:
javaApp.log
{"@timestamp":"2019-08-14T18:46:04.449+00:00","@version":"1","message":"Index out of range","logger_name":"com.example.app.loggingApp.classOne","thread_name":"http-nio-5000-exec-6","level":"ERROR","level_value":40000,"stack_trace":"java.lang.StringIndexOutOfBoundsException: String index out of range: 18\n\tat java.lang.String.charAt(String.java:658)\n\tat com.example.app.loggingApp.classOne.getResult(classOne.java:15)\n\tat com.example.app.loggingApp.AppController.tester(AppController.java:27)\n\tat sun.reflect.NativeMethodAccessorImpl.invoke0(Native Method)\n\tat sun.reflect.NativeMethodAccessorImpl.invoke(NativeMethodAccessorImpl.java:62)\n\tat sun.reflect.DelegatingMethodAccessorImpl.invoke(DelegatingMethodAccessorImpl.java:43)\n\tat java.lang.reflect.Method.invoke(Method.java:498)\n\tat org.springframework.web.method.support.InvocableHandlerMethod.doInvoke(InvocableHandlerMethod.java:190)\n\tat org.springframework.web.method.support.InvocableHandlerMethod.invokeForRequest(InvocableHandlerMethod.java:138)\n\tat
[...]
}
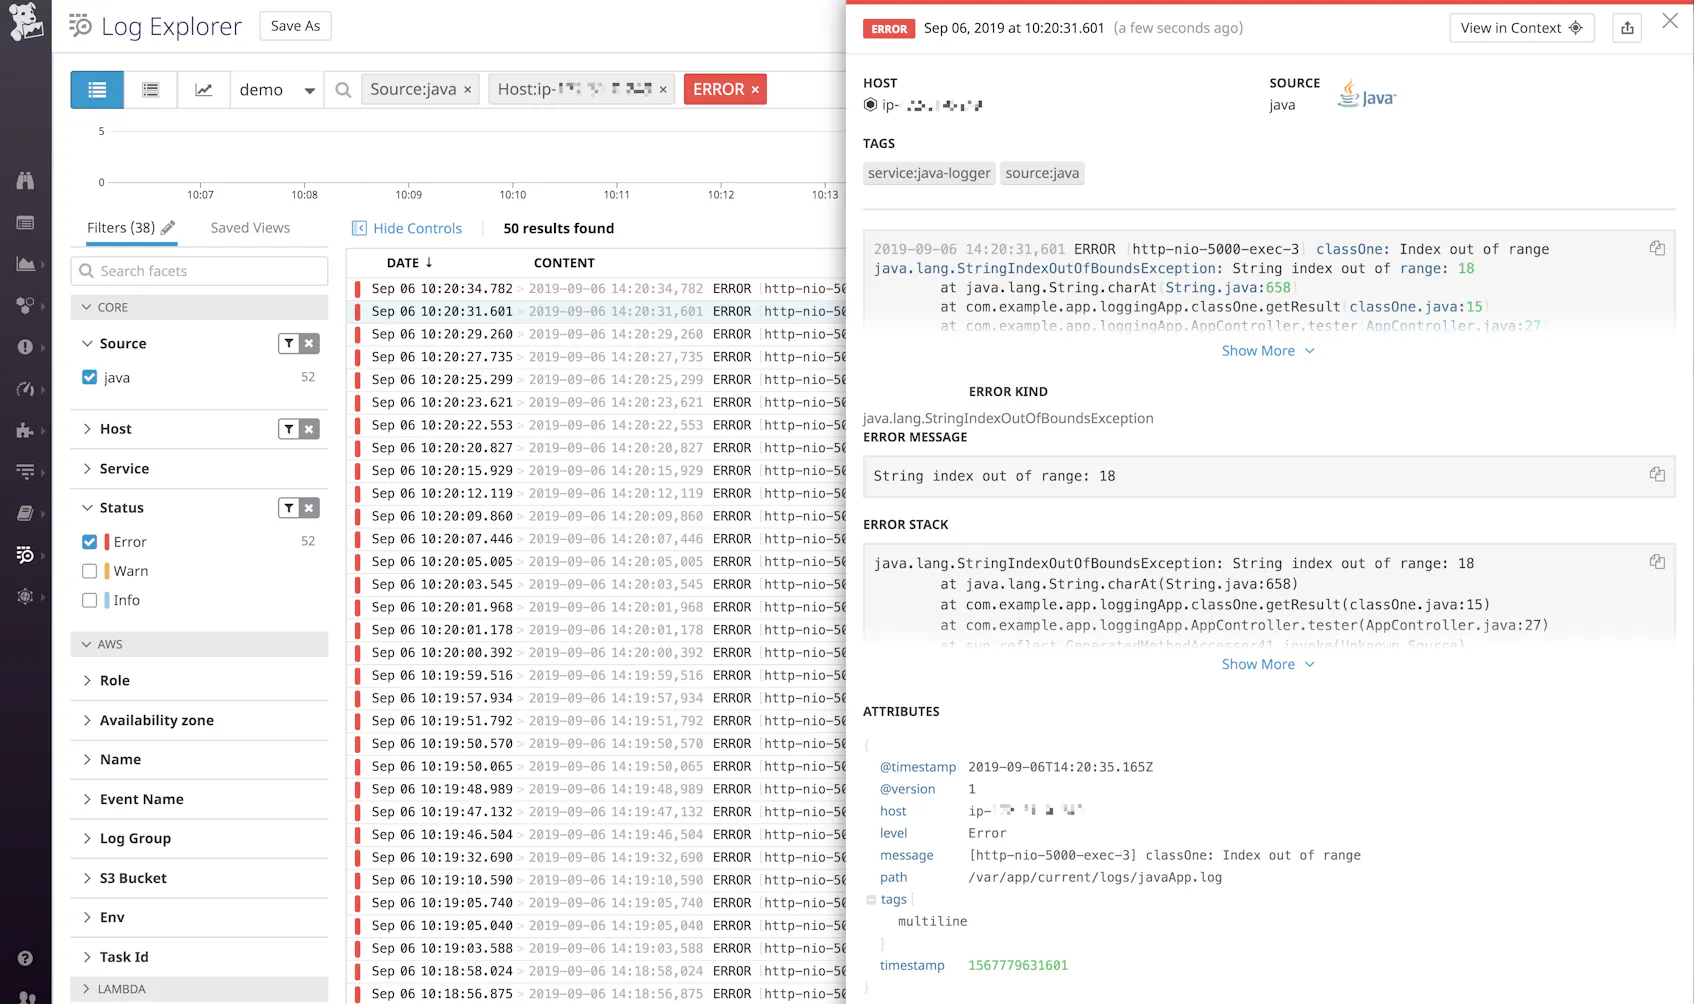
Now the entire log message is contained within a single JSON object with the full stack trace included as an entry. A log management service like Datadog can automatically parse this so that you can use the information to filter, search, and sort your logs for faster troubleshooting:
Use a log shipper
There may be situations where you can’t log to JSON. For example, it might require changes to your code or logging strategies that you’re not in a position to make. Or, your environment might use a third-party logging tool that you are not able to configure to write to JSON. In this case, you can configure a log shipper to handle multi-line logs by looking for specific patterns to indicate the beginning of a new log entry. For example, you might configure the log shipper to look for a timestamp since only the beginning of a log entry contains this field.
We will briefly touch on configuring popular log shippers to handle multi-line logs, including:
- Logstash’s multi-line codec
- Rsyslog’s
startmsg.regex - Fluentd’s multi-line parser plugin
- Fluent Bit’s multi-line configuration options
- Syslog-ng’s regexp multi-line mode
- NXLog’s multi-line parsing extension
- The Datadog Agent’s multi-line aggregation
Logstash
Logstash parses multi-line logs using a plugin that you configure as part of your log pipeline’s input settings. For example, the following instructs Logstash to search your log file for an ISO 8601–formatted timestamp (e.g., a date formatted as 0000-00-00). When it finds one, it collapses everything before it that doesn’t begin with a timestamp into the previous log entry:
logstash-sample.conf
input {
  file {
    path => "/var/app/current/logs/javaApp.log"
    mode => "tail"
    codec => multiline {
      pattern => "^%{TIMESTAMP_ISO8601} "
      negate => true
      what => "previous"
    }
  }
}
We can see that Logstash has combined and shipped the full contents of a Java stack trace in a single element:
Rsyslog
Rsyslog is an open source extension of the basic syslog protocol with enhanced configuration options. As of version 8.10, rsyslog added the ability to use the imfile module to process multi-line messages from a text file. You can include a startmsg.regex parameter that defines a regex pattern that rsyslog will recognize as the beginning of a new log entry. If rsyslog detects the pattern, it will aggregate all subsequent log entries into the same event until it finds another matching line.
By default, rsyslog can send and receive log messages up to 8 KB. Multi-line messages can potentially be much larger than this. In order to make sure rsyslog properly handles large multi-line messages, you can increase the maximum message size to 64 KB by adding the following to the very top of your rsyslog.conf file:
$MaxMessageSize 64k
If you don’t already have it, add the imfile module by adding the following to your rsyslog.conf file:
module(load="imfile" mode="inotify")
Then, in the configuration file for your specific log handlers, you can specify the startmsg.regex pattern that indicates the beginning of a new log event:
file-logger.conf
# For each file to send
input(type="imfile" ruleset="infiles" Tag="python-logger" File="/var/log/pythonApp.log" startmsg.regex="^[0-9]{4}-[0-9]{2}-[0-9]{2}")
This configuration tells rsyslog to tail a file, pythonApp.log. Let’s say we use this file to log exception tracebacks for a Python application. Without our custom configuration, rsyslog would have processed these lines as separate logs by default.
Note that, because we have not provided a template for rsyslog to use when writing log lines, it defaults to the syslog format and prepends each line with the standard syslog header. This header includes a timestamp, the host where the log came from, and the application name that originated the message. Our rsyslog output would look like the following:
pythonApp.log
Aug  2 12:58:13 ip-172-31-3-222 python-logger 2019-08-02 12:58:13,661 ERROR:Exception on main handler
Aug  2 12:58:13 ip-172-31-3-222 python-logger Traceback (most recent call last):
Aug  2 12:58:13 ip-172-31-3-222 python-logger  File "python-logger.py", line 9, in make_log
Aug  2 12:58:13 ip-172-31-3-222 python-logger    return word[13]
Aug  2 12:58:13 ip-172-31-3-222 python-logger IndexError: string index out of range
When rsyslog looks for the startmsg.regex, it will search the raw logs, which do not have the syslog header. Our configuration specifies that new log messages in our log file begin with an ISO 8601–formatted date (0000-00-00). Note that only the first line in our stack above includes that type of timestamp. So now rsyslog aggregates the lines into a single event, and then prepends the syslog header to that log:
pythonApp.log
Aug 2 12:56:07 ip-172-31-3-222 python-logger 2019-08-02 12:56:06,494 ERROR:Exception on main handler\nTraceback (most recent call last):\n File "python-logger.py", line 9, in make_log\n return word[13]\nIndexError: string index out of rangeFluentd
Similar to Logstash, Fluentd allows you to use a plugin to process multi-line logs. You can configure the plugin to accept one or more regex patterns that symbolize the beginning of a new log. For example, take the Python traceback from our previous example:
pythonApp.log
2019-08-01 18:58:05,898 ERROR:Exception on main handler
Traceback (most recent call last):
  File "python-logger.py", line 9, in make_log
    return word[13]
IndexError: string index out of range
Without the multi-line parser, Fluentd forwards each line separately. To change this, we can add some parsing rules to our source configuration. You must include a format_firstline parameter to specify what a new log entry starts with. You may also use regex grouping and captures to parse attributes from your logs, as seen in the example below:
td-agent.conf
<source>
  @type tail
  path /path/to/pythonApp.log
  tag sample.tag
  <parse>
    @type multiline
    format_firstline /\d{4}-\d{1,2}-\d{1,2}/
    format1 /(?<timestamp>[^ ]* [^ ]*) (?<level>[^\s]+:)(?<message>[\s\S]*)/
  </parse>
</source>
As with our rsyslog example, we have configured Fluentd to look for an ISO 8601 date using the format_firstline parameter. Then, we specified patterns to look for in the rest of the log entry and assigned labels to them. In this case, we’ve broken the log down into timestamp, level, and message labels.
Fluentd now collects each traceback as a single log event like the following:
pythonApp.log
{"timestamp":"2019-08-01 19:22:14,196","level":"ERROR:","message":"Exception on main handler\nTraceback (most recent call last):\n File \"python-logger.py\", line 9, in make_log\n return word[13]\nIndexError: string index out of range"}The log has been formatted as JSON, with the labels we identified set as keys. See more examples of parsing multi-line logs in Fluentd’s documentation.
Fluent Bit
Fluent Bit also provides configuration options for processing multi-line logs with their tail input plugin. Using the Python traceback from our previous examples:
pythonApp.log
2019-08-01 18:58:05,898 ERROR:Exception on main handler
Traceback (most recent call last):
  File "python-logger.py", line 9, in make_log
    return word[13]
IndexError: string index out of range
Fluent Bit will forward each line of the traceback separately without a multi-line parser. In order to create a single log, you can configure the plugin to use Fluent Bit’s built-in regex parser in order to structure the multi-line log:
td-agent.conf
  [PARSER]
      Name         log_date
      Format       regex
      Regex        /\d{4}-\d{1,2}-\d{1,2}/

  [PARSER]
      Name        log_attributes
      Format      regex
      Regex       /(?<timestamp>[^ ]* [^ ]*) (?<level>[^\s]+:)(?<message>[\s\S]*)/

   [INPUT]
      Name              tail
      tag               sample.tag
      path              /path/to/pythonApp.log
      Multiline         On
      Parser_Firstline  log_date
      Parser_1          log_attributes
Similar to our FluentD example, the Parser_Firstline parameter should specify the name of the parser that matches the beginning of the multi-line log entry. You can also include extra parsers to further structure your logs. In the example above, we configured Fluent Bit to first look for an ISO 8601 date using the Parser_Firstline parameter. Then, we used the Parser_1 parameter to specify patterns to match the rest of the log message and assigned the timestamp, level, and message labels to them.
Fluent Bit now transforms your multi-line logs into JSON format, using our labels as keys:
pythonApp.log
{"timestamp":"2019-08-01 19:22:14,196","level":"ERROR:","message":"Exception on main handler\nTraceback (most recent call last):\n File \"python-logger.py\", line 9, in make_log\n return word[13]\nIndexError: string index out of range"}Syslog-ng
Like rsyslog, syslog-ng extends the syslog protocol to add features and additional options for log processing. In your syslog-ng configuration, you can use multi-line-mode() to process multi-line messages. Note that syslog-ng allows a couple different options for processing multi-line messages. In this example, we will use regexp. You can view more information on other modes here.
syslog-ng.conf
source s_files {
    file("/var/log/test-logging.log",flags(no-parse),follow_freq(1),program_override("python-logger"),multi-line-mode(regexp),multi-line-prefix("^[0-9]{4}\-[0-9]{2}\-[0-9]{2}"));
};
This configures syslog-ng to read from the test-logging.log file. It uses a regular expression to search the raw logs for a line that starts with numbers in the ISO 8601 format of 0000-00-00. It then aggregates all subsequent lines until it reaches another line with that pattern. Note that the no-parse flag keeps syslog-ng from parsing these messages as syslog-format logs.
In order to actually write or forward this log so that the entire message is included on a single line, we must include the no-multi-line flag in our destination settings. So for example, if we are writing these to another file, we would configure our destination as follows:
syslog-ng.conf
destination d_file { file("/var/log/pythonApp.log" flags(no-multi-line)); };Now, syslog-ng writes our Python tracebacks to that file like this:
pythonApp.log
Sep 6 14:55:45 ip-172-31-3-222 python-logger: 2019-09-06 14:55:44,277 ERROR:Exception on main handler Traceback (most recent call last): File "python-logger.py", line 11, in make_log return word[13] IndexError: string index out of rangeAs with rsyslog, syslog-ng searches the raw log entries for the given regexp. Then, because it is not parsing these messages as syslog logs, it prepends the syslog header with a syslog-format timestamp, host name, and originating application name.
NXLog
NXLog is a multi-platform log shipper that supports both Unix-like and Windows-based systems. It offers a multi-line parsing extension that works much in the same way as other log shipper solutions. In your NXLog configuration file, you can provide the extension with a HeaderLine parameter that indicates the beginning of each new log event, or configure an EndLine if your log events have a predictable ending. You can provide specific strings or regular expressions to indicate patterns.
Below is a snippet from an NXLog configuration file that configures the multi-line extension to look for lines that begin with an ISO 8601 date starting with 0000-00-00. It then creates an input module that tails a file and parses the messages using the multi-line extension:
nxlog.conf
<Extension multiline_parser>
    Module      xm_multiline
    HeaderLine  /^\d{4}\-\d{2}\-\d{2}/
</Extension>

<Input multiline>
    Module      im_file
    File        "/var/log/test-logging.log"
    InputType   multiline_parser
    SavePos     TRUE
</Input>
Now your multi-line logs will be aggregated and sent to their configured destination as single events.
Datadog
Like other log shippers, the Datadog Agent can process multi-line logs by using regex to search for specific patterns. You can then send the logs directly to Datadog, where you can visualize, analyze, and alert on them. Once you have installed the Datadog Agent and enabled log collection, configure the Agent to read and process logs from the files you are logging to:
python-app.yaml
logs:
 - type: file
   path: /var/log/test-logging.log
   service: python-app
   source: python
   log_processing_rules:
      - type: multi_line
        name: new_log_start_with_date
        pattern: \d{4}\-(0?[1-9]|1[012])\-(0?[1-9]|[12][0-9]|3[01])
As in previous examples, we’ve configured the Agent to tail a file (test-logging.log) and look for numbers in the ISO 8601 format 0000-00-00 to identify the start of new log events. We’ve also included the service and source parameters. The former names the service emitting the logs and links the logs to any traces your service is sending. The source tells Datadog which integration or custom log processing pipeline, if there is one, to use for these logs. Datadog has a built-in pipeline for Python logs, so in our example we have set the source to python.
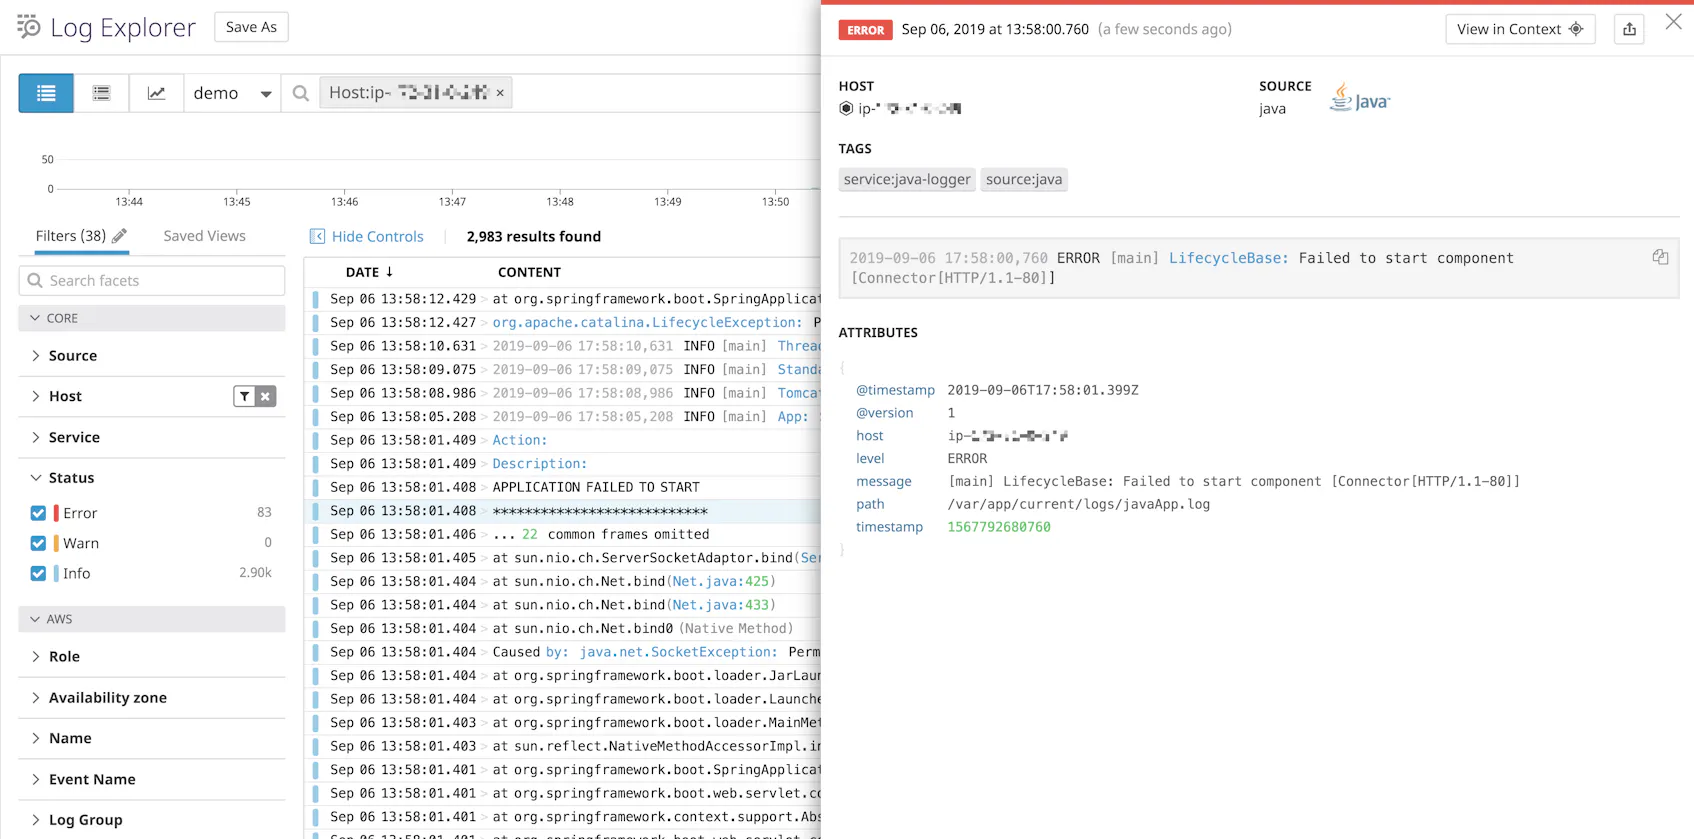
Once you restart your Agent, you’ll begin to see log events appearing in your Log Explorer. Note that Datadog has also automatically included various tags from the log source, in this case host and cloud provider information:
As of version 7.32, the Datadog Agent can also automatically detect common multi-line log patterns and collect them as single lines.
Simplify your multi-line logs
Multi-line logs can provide a wealth of information that is invaluable for troubleshooting and getting insight into application problems. Collecting them in a way that lets you get the most out of them, however, can be challenging. In this post, we’ve covered two primary methods for making sure that each multi-line log gets handled properly.
If possible, the simplest method is to log to JSON—this ensures that you can easily aggregate each full log event into a single element. When logging in JSON isn’t possible, you can configure a log shipper to process multi-line logs.
Once you are collecting your multi-line logs as single events, a log management solution like Datadog can help you get even more value from them. With Datadog, you can aggregate logs from your entire environment, and our log integrations provide built-in processing for a range of log sources, including languages such as Python, Java, and Ruby; infrastructure technologies like NGINX, Docker, and PostgreSQL; and cloud providers like AWS, GCP, and Azure. Datadog also integrates with all of the log shippers that we have covered in this post.
For other data sources, Datadog automatically pulls out attributes from JSON-formatted logs. Or you can configure the Datadog Agent to parse multi-line logs and set up custom processing pipelines. Once everything is flowing into Datadog, you can monitor, analyze, and alert on all your logs alongside traces and infrastructure metrics within a single platform.
If you’re already a Datadog user, see our documentation to start ingesting logs from across your infrastructure. If not, get a free 14-day trial and start managing your logs today.


