The MEAN stack has become an increasingly popular choice for developing dynamic applications. Similar to other development stacks like LAMP and Ruby on Rails, MEAN bundles together complementary technologies to provide a ready-made framework for developing and serving applications. There are variations to this stack, but it primarily consists of the following components:
- MongoDB: an open source database that stores data in JSON-style documents
- Express: a Node.js framework for building web application backends and APIs
- Angular: a frontend development framework for designing mobile and web applications
- Node.js: an open source, JavaScript runtime environment for creating server-side frameworks and applications
Monitoring the MEAN stack
As your application grows in complexity, debugging issues across its various components becomes increasingly difficult. In this guide, we’ll show you how to get comprehensive insights into your MEAN stack application and its underlying infrastructure with Datadog. Along the way, we will:
- Install and configure the Datadog Agent
- Enable Datadog’s integrations to collect data from your MEAN stack application
- Instrument your MEAN stack to get deeper insights into application performance
The basic structure of a MEAN application consists of Angular components and application server file(s) (e.g., server.js, index.js, or app.js). These files can include configurations for serving Angular build files, creating Express routes for an API backend, connecting to the MongoDB database, and executing database commands (i.e., CRUD operations). In this post, we will walk through configuring some of these components as well as show how to provide visibility across all the pieces of your stack with custom dashboards.
If you don’t already have a Datadog account, you can sign up for a free trial if you would like to follow along with the steps in this guide.
Installing and configuring the Datadog Agent
In order to begin collecting data from your MEAN stack application, you will need to download and install the Datadog Agent on your application server. This step requires your Datadog API key, which you can find in your account. For Linux hosts, run the following script to install the Agent:
DD_API_KEY=<API_KEY> DD_AGENT_MAJOR_VERSION=7 bash -c "$(curl -L https://raw.githubusercontent.com/DataDog/datadog-agent/master/cmd/agent/install_script.sh)"You can run the Agent’s status command to verify that it was successfully installed. The Agent will automatically forward system-level metrics such as CPU usage, memory breakdowns, and load averages to Datadog, so you can immediately visualize and alert on host metrics. Before we enable specific integrations, we first need to configure the Agent to collect logs and traces.
Configuring the Agent to collect request traces and logs
The Agent includes parameters for log and trace collection in its datadog.yaml configuration file, located in the /etc/datadog-agent/ directory on Linux hosts; to find the correct path for another platform, consult the documentation. Tracing is enabled by default, but you can add an environment tag in the Agent’s APM settings to better categorize the data coming from your application:
# Trace Agent Specific Settings
apm_config:
  enabled: true
  env: staging
Tags give you the ability to filter and aggregate metrics in Datadog. This is useful if you monitor applications across multiple environments, or need to view metrics from a specific group of applications.
To monitor application logs, you can enable log collection in the same datadog.yaml file:
# Logs agent
logs_enabled: true
Save the file and restart the Agent to apply your recent changes:
sudo service datadog-agent restart
With the Agent prepped, you can configure it to begin collecting metrics and logs from the technologies in your stack. In the next section, we will walk through enabling Datadog’s MongoDB, Express, and Node.js integrations.
Enabling Datadog integrations for the MEAN stack
To configure the Agent integrations for each component of your MEAN stack, you can create a conf.yaml file in the appropriate subdirectory of the Agent’s configuration directory (/etc/datadog-agent/conf.d/ on Linux hosts). The Agent will automatically apply any metric and log configurations you place in those files, including any custom configurations you want to apply to your stack.
Configuring Datadog’s MongoDB integration
Datadog’s MongoDB integration keeps you informed of uptime and replication state changes in addition to collecting metrics from your nodes. In order to collect data from MongoDB, you will first need to create a new datadog user (in a mongo shell) with read and clusterMonitor roles in the admin database. You’ll also need to grant the datadog user the read role on your application database:
# MongoDB 3.x
use admin
db.auth("admin", "<ADMIN_PASSWORD>")

db.createUser({
  "user":"datadog",
  "pwd": "<UNIQUE_PASSWORD>",
  "roles" : [
    {role: 'read', db: 'admin' },
    {role: 'clusterMonitor', db: 'admin'},
    {role: 'read', db: '<YOUR_DB>'}
  ]
})
This will grant the Agent read-only access to your database collections and MongoDB’s own cluster monitoring tools, such as the top command for retrieving usage statistics for your collections. You can view these commands in more detail and generate a unique password in the MongoDB integration tile of your Datadog account. Note that the commands to create a new user will differ slightly for MongoDB 2.x.
Next, edit the Agent’s MongoDB integration configuration file, located in the /etc/datadog-agent/conf.d/mongo.d/ directory on Linux hosts. Within this directory, you’ll find a conf.yaml.example file which you can copy to conf.yaml. This example file includes all available configuration options, though you do not need every option to begin forwarding metrics. To get started, the integration only requires your MongoDB URI:
init_config:

instances:
  - server: mongodb://datadog:<UNIQUE_PASSWORD>@localhost:27017/<YOUR_DB>?authSource=admin
The authSource parameter delegates authentication for your application’s database to the admin database, where the datadog user is stored.
To begin forwarding logs to Datadog, include the path to your MongoDB log file in the logs section of the same conf.yaml configuration file:
## Log section (Available for Agent >=6.0)

logs:
  - type: file
    path: /var/log/mongodb/mongodb.log
    service: <YOUR_SERVICE_NAME>
    source: mongodb
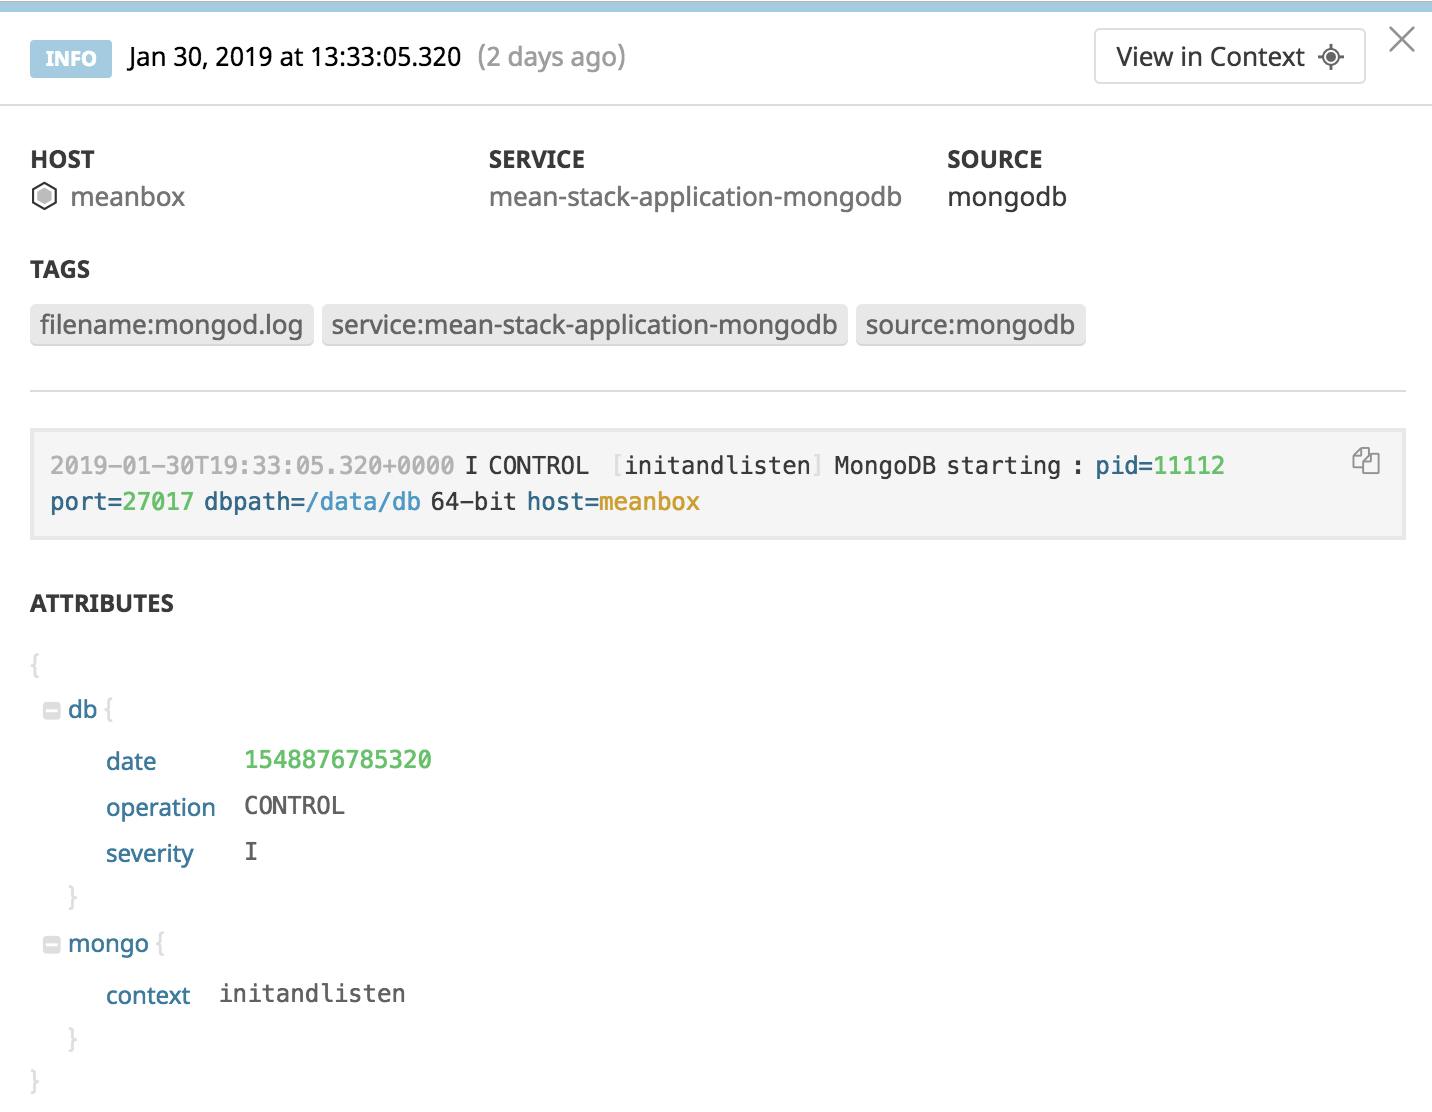
The service attribute links these logs to request traces and application performance metrics that come from the same service—we’ll show you how to instrument your application to collect this data in a later section. The source attribute instructs Datadog to process these logs with the built-in MongoDB log integration pipeline, which automatically extracts useful attributes such as timestamps and operations so you can use them as facets to easily search and analyze your database logs.
Restart the Agent to apply the new changes and run its status command:
sudo service datadog-agent restart
sudo datadog-agent status
In the output, you should see that the Agent ran a monitoring check on your MongoDB server:
mongo (1.7.0)
    -------------
      Instance ID: mongo:92ade187167a3df2 [OK]
      Total Runs: 1
      Metric Samples: Last Run: 145, Total: 145
      Events: Last Run: 0, Total: 0
      Service Checks: Last Run: 1, Total: 1
      Average Execution Time : 32ms
You can verify which metrics the Agent collects by running its service check:
sudo -u dd-agent -- datadog-agent check mongo
This command will provide a breakdown for each MongoDB metric the Agent is collecting. The following excerpt shows information about the metric type, host, and tags associated with the mongodb.connections.available metric, which measures the number of available connections in the database:
{
      "metric": "mongodb.connections.available",
      "points": [
        [
          1548449540,
          816
        ]
      ],
      "tags": [
        "server:mongodb://datadog:*****@localhost:27017/mean-db2?authSource=admin"
      ],
      "host": "meanbox",
      "type": "gauge",
      "interval": 0,
      "source_type_name": "System"
    }
By default, Datadog collects a sample of metrics using MongoDB database commands such as dbStats and serverStatus, with minimal configuration. But you can check out our documentation if you want to collect additional types of metrics, such as the total number of objects in a specific collection.
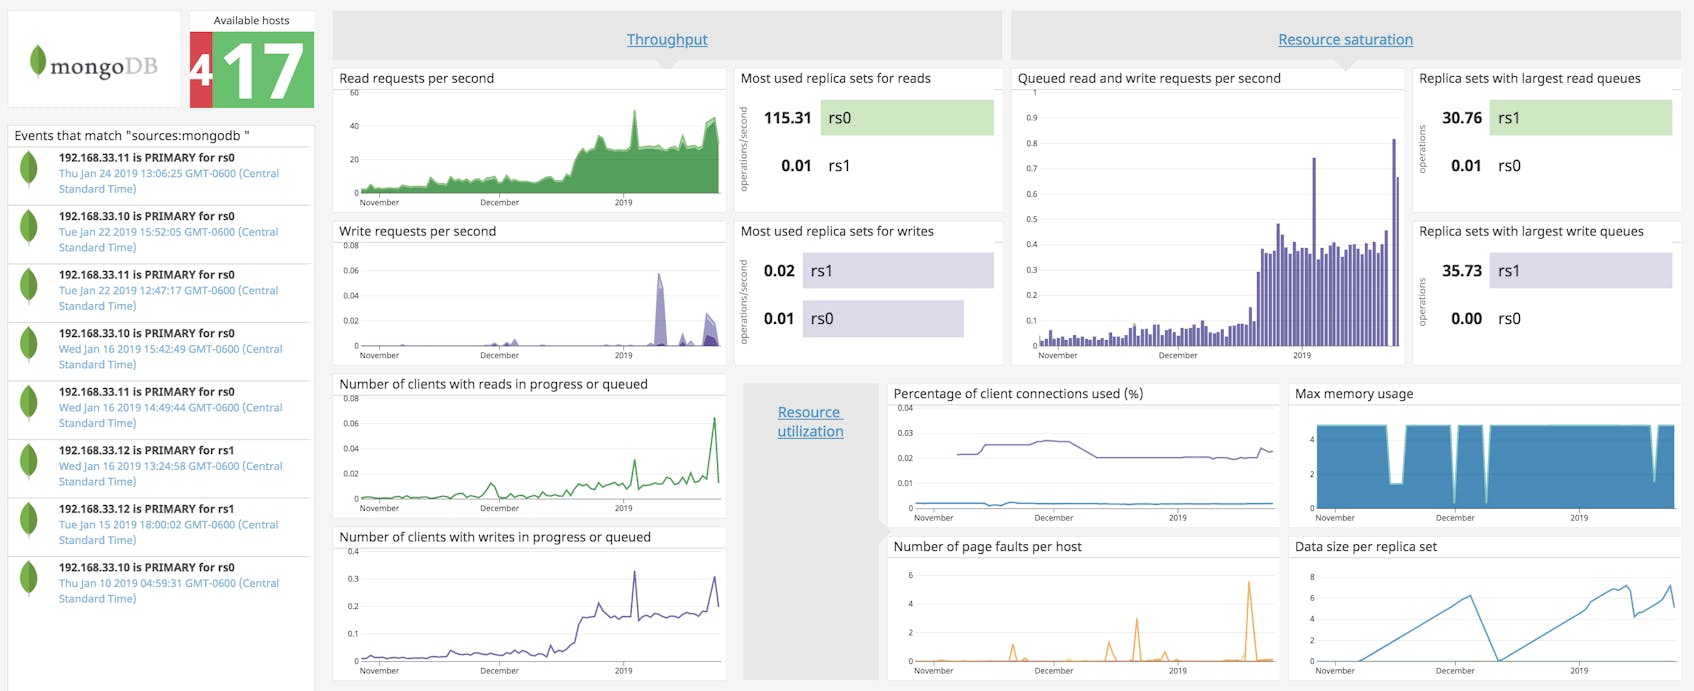
Now that the Agent is collecting your MongoDB metrics and logs, you can view them in detail in Datadog. The out-of-the-box MongoDB dashboard provides a high-level overview of database activity and resource utilization, including memory usage, connection counts, and host availability.
You can clone this dashboard and then customize it by adding graphs from other components of your stack such as Node.js or Express. You can also click on a graph and then select “View related logs” if you want to view logs collected from the MongoDB server(s) shown.
The screenshot below shows a sample MongoDB log, with key attributes that have been automatically parsed by the integration pipeline.
Collecting Express metrics from your stack
Datadog’s Express integration uses the connect-datadog middleware to forward server response metrics to Datadog. In order for the Agent to begin collecting Express metrics, you will first need to install the npm module:
npm install connect-datadog
Next, you’ll need to modify your application server file to include the Datadog middleware (connect-datadog):
// server.js
var dd_options = {
  'response_code':true,
  'tags': ['env:staging']
}

var connect_datadog = require('connect-datadog')(dd_options);

// Add the datadog-middleware before your router
app.use(connect_datadog);
app.use(router);
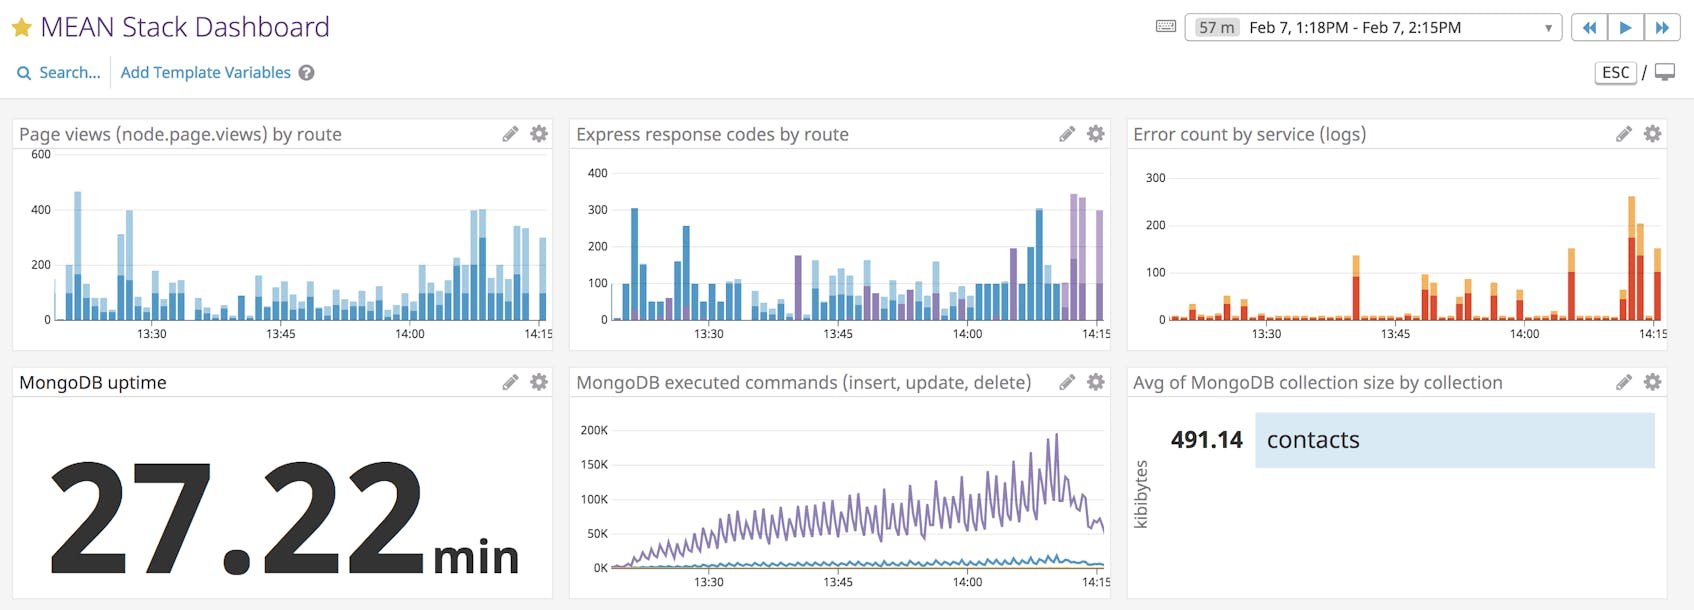
The middleware package includes multiple options for fine-tuning metric collection for Express. In the dd_options section of the example configuration above, we’ve enabled collecting HTTP response code metrics with response_code:true and organized the metrics using the tags option. When you start your application, the Agent will immediately begin forwarding Express metrics to Datadog so you can gain deeper insights in the health of your server. For example, you can create a custom graph to monitor Express server response counts by route, as seen in the image below.
Creating Node.js custom metrics
Datadog’s Node.js integration uses the hot-shots DogStatsD client to collect custom metrics. Once you install the library (npm install hot-shots), you can track metrics such as the number of page views for a specific route by adding the following to your application server file:
// server.js
var StatsD = require('hot-shots');
var dogstatsd = new StatsD();

app.get("/contacts", function(req, res) {
  // Increment a counter.
  dogstatsd.increment('node.page.views', ['method:GET', 'route:contacts']);
  [...]
});
In the example above, we are using node to categorize our custom page views metric; the full metric name will appear in Datadog as node.page.views. This allows us to group custom metrics and link related logs. After you restart your application to apply the new changes, you can use the Metrics Explorer in your Datadog account to create graphs of your custom metrics, which you can then export to your dashboard.
Log collection for Node.js and Express
Datadog recommends using the Winston library to collect logs from Node.js applications. Winston is a comprehensive logging utility that allows you to implement a customized logger for your application, whether it runs on pure Node.js or uses a framework like Express.
You can install the library with npm:
npm install --save winston
Next, configure Winston to log data by creating a custom logger:
// config/logger.js
const { createLogger, format, transports } = require('winston');

const logger = createLogger({
  level: 'info',
  format: format.combine(
    format.timestamp({
      format: 'YYYY-MM-DD HH:mm:ss'
    }),
    format.json()
  ),
  transports: [
    new transports.File({ filename: 'combined.log' })
  ]
});
The code snippet above configures Winston to write all log messages that have the info log level priority (includes warn and error logs) to the same combined.log file in JSON format. You can then implement your logger within your Express routes and database functions:
// server.js
// import logger
var logger = require('./config/logger');

[...]

app.post("/api/contacts", function(req, res) {
  logger.log('info', 'create new contact');

  db.collection("contacts").insertOne(newContact, function(err, doc) {
      if (err) {
        logger.log('error', 'Failed to create a new contact');
      }
      [...]
  });
});
Each log will include the log level, message, and timestamp in the combined.log file:
{"level":"info","message":"GET /api/contacts","timestamp":"2019-01-09 13:55:55"}
{"level":"error","message":"Failed to create a new contact","timestamp":"2019-01-09 15:23:25"}
To forward these logs to Datadog, you can create a /nodejs.d/conf.yaml configuration file in your host’s /etc/datadog-agent/conf.d/ directory and include the location of your application’s log file(s):
init_config:

instances:

##Log section
logs:

    ## - type : file (mandatory) type of log input source (tcp / udp / file)
    ##   port / path : (mandatory) Set port if type is tcp or udp. Set path if type is file
    ##   service : (mandatory) name of the service owning the log
    ##   source : (mandatory) attribute that defines which integration is sending the logs
    ##   sourcecategory : (optional) Multiple value attribute. Can be used to refine the source attribute
    ##   tags: (optional) add tags to each logs collected

  - type: file
    path: /path/to/your/app/combined.log
    service: <YOUR_SERVICE_NAME>
    source: node
Since Datadog parses your application’s JSON logs automatically, you can use a custom name for the source attribute of your Node.js logs. In the example above, we use node for the source to associate these logs with the node.page.views custom metric. The service attribute makes it easier to associate logs with related request traces and application performance metrics in Datadog APM, which we will cover in detail in the next section.
Instrumenting your MEAN stack application with Datadog APM
You can get even greater context around your metrics and logs by instrumenting your application with Datadog APM. Datadog APM provides detailed overviews of throughput, latency, and error counts by tracing requests across every service in your application. Datadog’s open source Node.js tracing library is OpenTracing-compatible and includes plugins for Express and MongoDB, so you can easily visualize distributed request traces and performance metrics from the services in your stack.
To instrument your Node.js application, first install the npm module:
npm install --save dd-trace
Datadog’s JavaScript tracer is enabled to auto-instrument your Express and MongoDB integrations by default, which means the tracer can automatically assign service names and capture traces from your server and database. To use the tracer’s out-of-the-box instrumentation, include the following code snippet at the top of your application server file:
// server.js
const tracer = require('dd-trace').init();
You can customize your tracer’s options to suit your use case. For example, you can configure the Express and MongoDB integrations to assign a specific service name and link these services to their corresponding logs:
// server.js
const tracer = require('dd-trace').init()

// configure express integration
tracer.use('express', {
  service: '<YOUR_SERVICE_NAME>'
})
Once you restart your application, the Datadog Agent will forward traces from your stack to your Datadog account. On the APM services list page, you can view information about each service from your instrumented application.
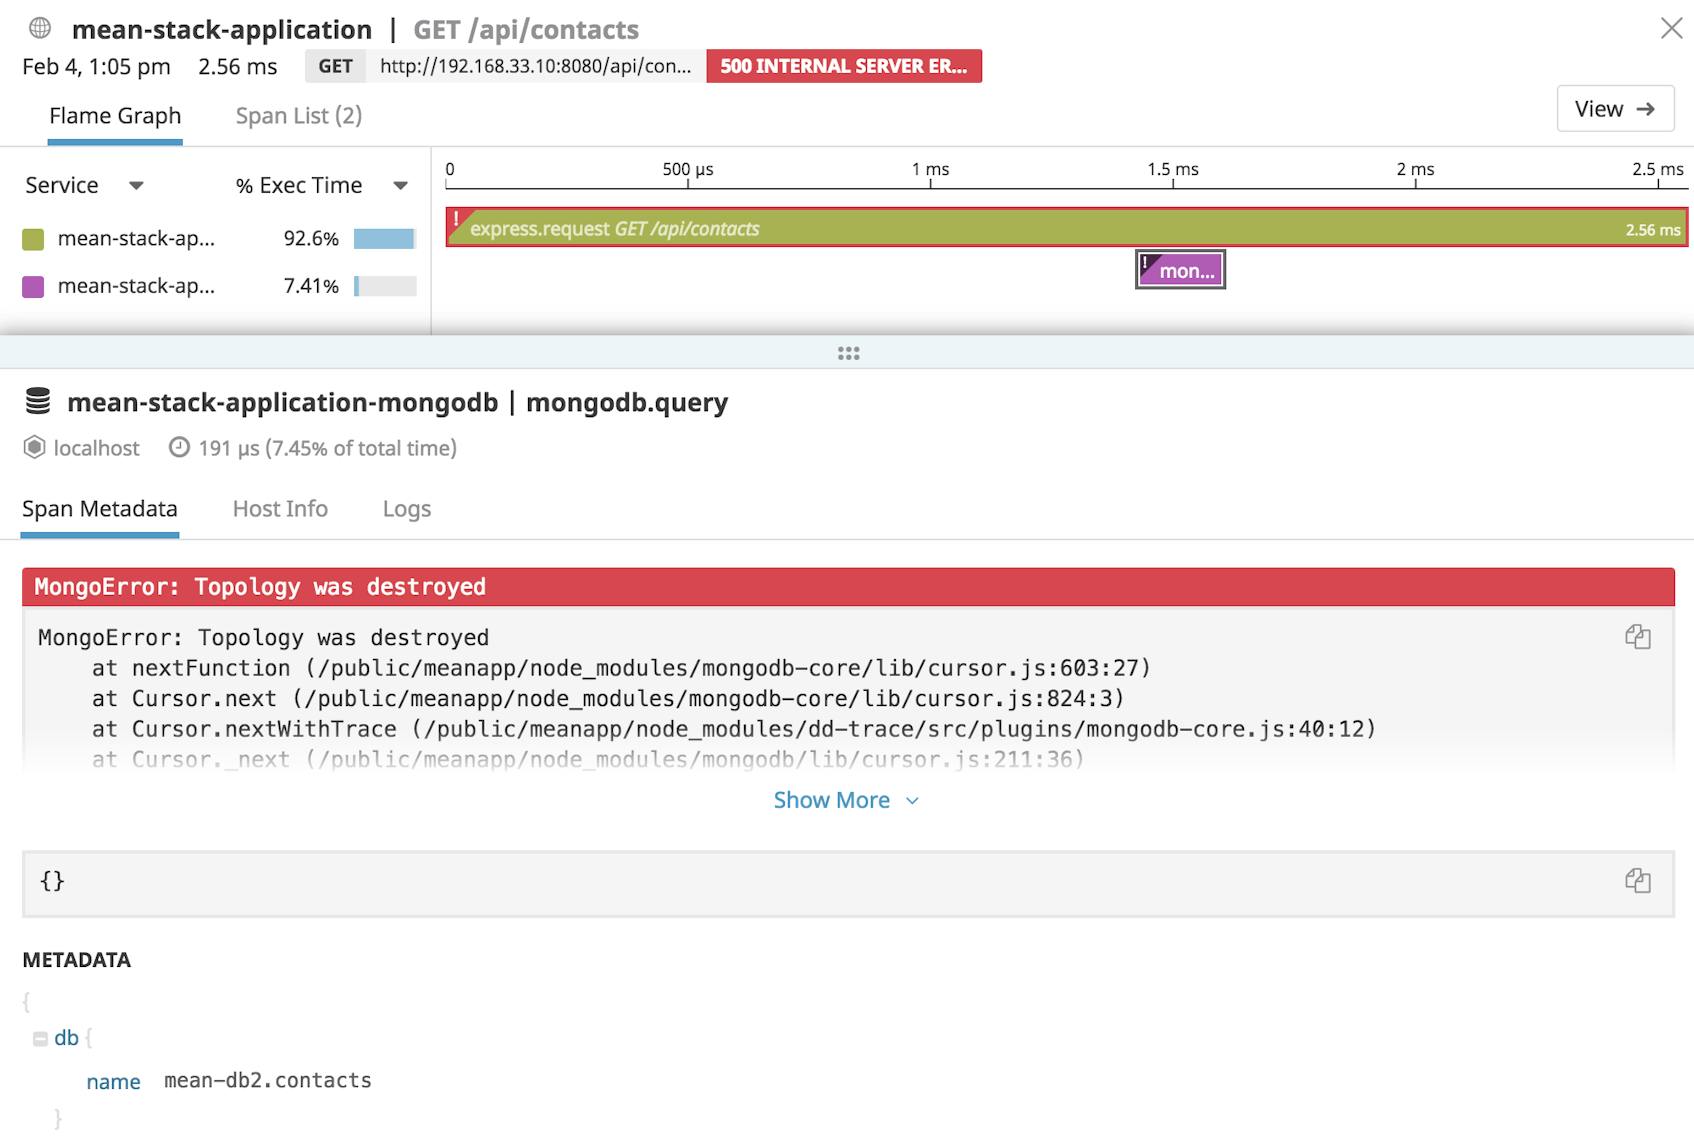
You can also filter by the type of service (web, database, cache, or custom) and select a specific service to view more detailed information about its performance, including a list of individual request traces. Once you select an individual trace, you can inspect its flame graph to see a breakdown of spans. Spans are units of work within a trace and represent activity such as HTTP requests or database queries. When you click on a span, you can see its metadata such as the exact database call or the stack trace of a MongoDB-related error.
As seen in the example above, Datadog will capture application errors, along with useful metadata about the error, so that you can quickly diagnose issues. You can navigate to the “Host Info” tab to correlate system-level metrics with the time of the trace. This gives you a better view into the health of your host and can serve as a starting point for debugging your application. Since your application consists of many different components, being able to correlate data across your stack is integral to performance monitoring.
Exploring your application data and logs
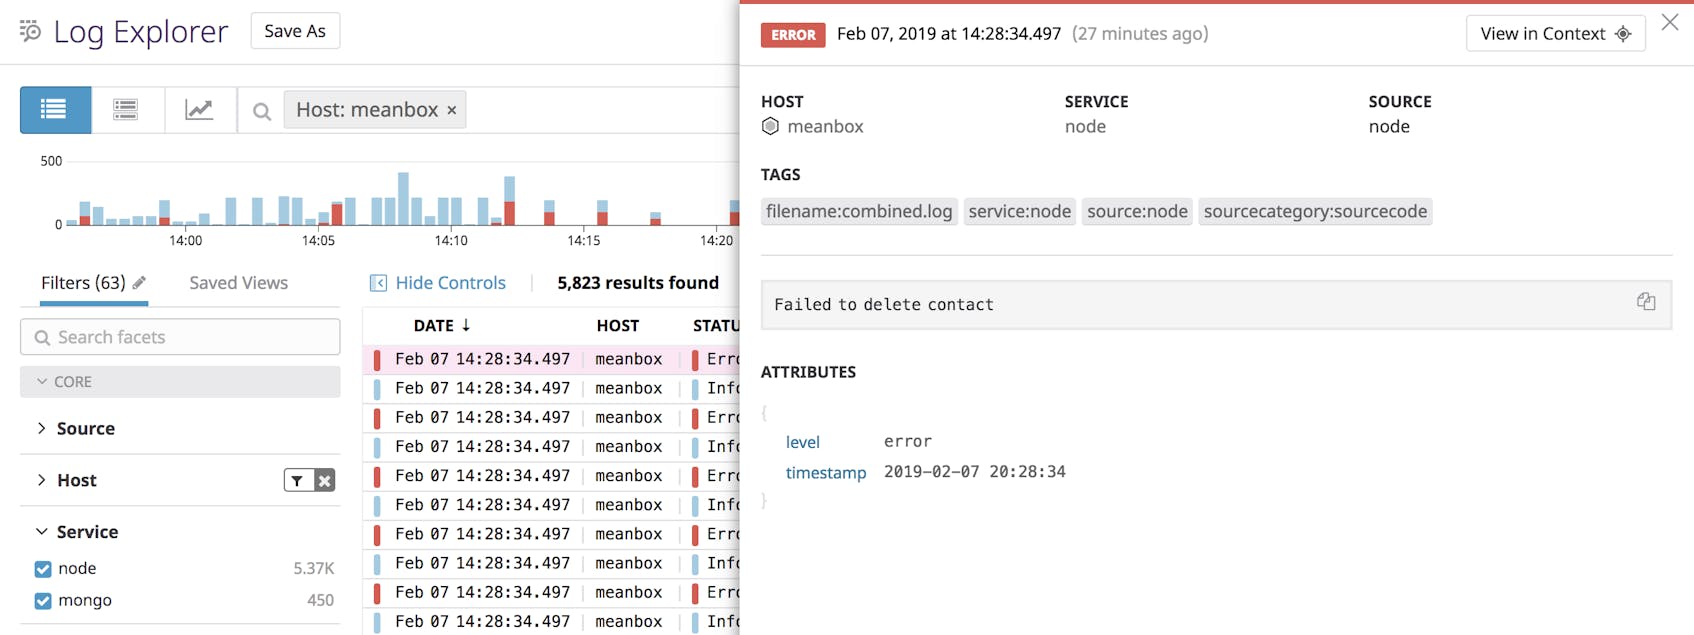
Now that your MEAN stack application is sending metrics, request traces, and logs to Datadog, you can seamlessly navigate across all of these sources of data. For example, when viewing an individual request trace, you can click on the “Logs” tab to quickly jump to related logs generated by your application. Earlier, we configured our Node.js application to log messages in JSON format, so Datadog will automatically parse them and create structured attributes.
You can use these attributes to create facets and measures that are useful for searching and filtering your logs. You can also use measures to create custom graphs that you can then export to any dashboard to view your log analytics data in the same place as metrics and APM data.
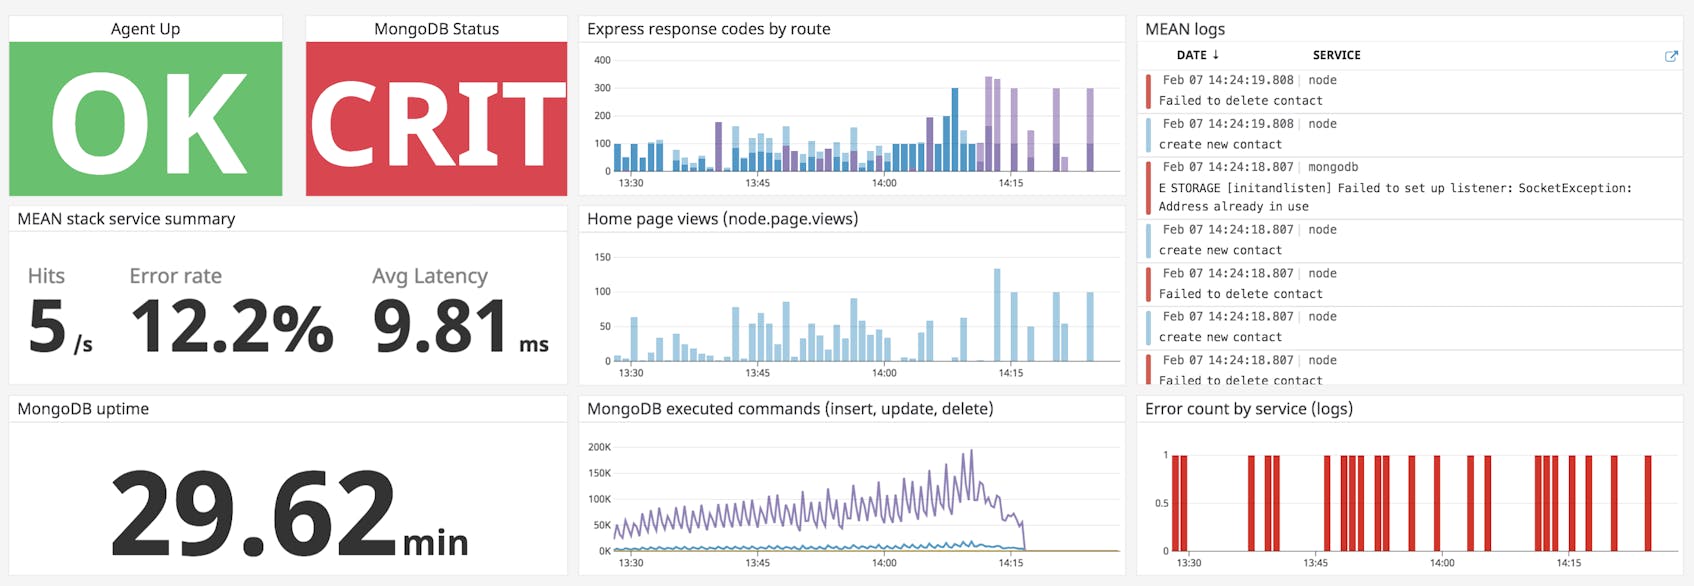
In the example dashboard above, we can see that there is an issue with our database based on MongoDB’s “CRIT” status and the noticeable drop in database activity (in the “MongoDB executed commands” graph). For more details about this problem, we can look in the log stream, which captured an error log from the database:
E STORAGE [initandlisten] Failed to set up listener: SocketException: Address already in use
Dashboards give you the ability to correlate key metrics with logs from your stack in one place, so you can be aware of issues as they happen.
Get started with MEAN stack monitoring
If you’ve followed along with this tutorial, you should now have deeper visibility into the key components of your MEAN stack application. And with Datadog’s 850+ integrations, you can monitor your stack alongside all of the other services running in your infrastructure. If you don’t have a Datadog account, you can sign up for a free trial to start monitoring your applications today.


