Google Cloud Platform (GCP) is a suite of cloud computing services for deploying, managing, and monitoring applications. A critical part of deploying reliable applications is securing your infrastructure. Google Cloud Audit Logs record the who, where, and when for activity within your environment, providing a breadcrumb trail that administrators can use to monitor access and detect potential threats across your resources (e.g., storage buckets, databases, service accounts, virtual machines). GCP collects audit logs from all GCP services, so you can get more context around user and service account activity for security analysis and identify possible vulnerabilities that you should address before they become bigger issues.
In this guide, we’ll cover:
- the structure of GCP audit logs
- best practices for using audit logs to monitor GCP security
- how to export audit logs from GCP
- how Datadog can help you collect and monitor your GCP audit logs
Before we dive into audit logs, let’s first look at the Google Cloud resource hierarchy, as it plays a role in interpreting your logs.
A primer on the Google Cloud hierarchy
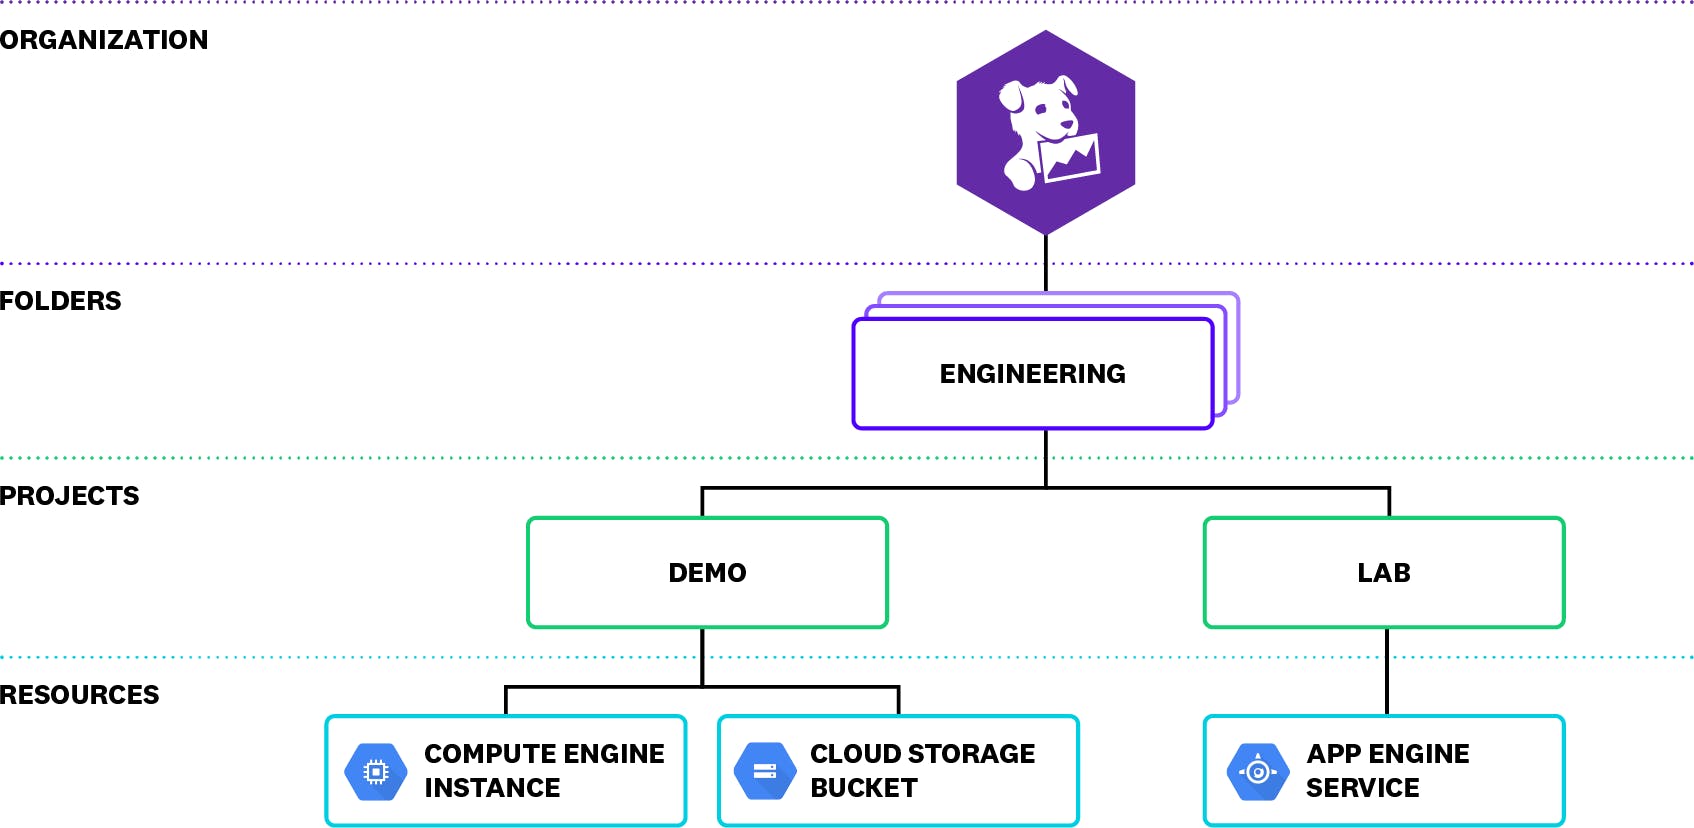
A resource hierarchy organizes your Google Cloud resources by organization, project, and folder and defines which members have access to what resources. This hierarchy often mimics the structure of a company, where certain resources, such as a Google Compute Engine (GCE) instance or Google Cloud Storage (GCS) bucket for example, are owned by a specific department within the company.
To grant access to your resources, you can create Cloud IAM policies. A policy can include members of several different account types, including Google accounts and service accounts. These policies propagate down the hierarchy. In the example above, if you grant a Google group the editor role for the Engineering folder, their Google account credentials will automatically give them read and write access to all the resources in both the Demo and Lab projects. Understanding the hierarchy of your organization, as well as the roles of individual users and services, will help you quickly sift through this data in your audit logs and pinpoint any potential threats to your applications.
Understanding Google Cloud Audit Logs
Google Cloud can emit three different types of audit logs for every organization, folder, and project within your resource hierarchy:
- Admin Activity: entries for API calls or user administrative activity that changes resource configurations
- System Event: entries for Google system administrative activity that modifies resource configurations
- Data Access: entries for API calls that read resource configurations or metadata, or user-level API calls that read or write resource data
Most Google Cloud services emit each of these audit log types, enabling you to view resource activity for different levels of your hierarchy. This includes Google Workspace if you are sharing that data with Cloud Logging, so you can also view the Admin Activity and Data Access audit logs that Google Workspace writes at the organizational level.
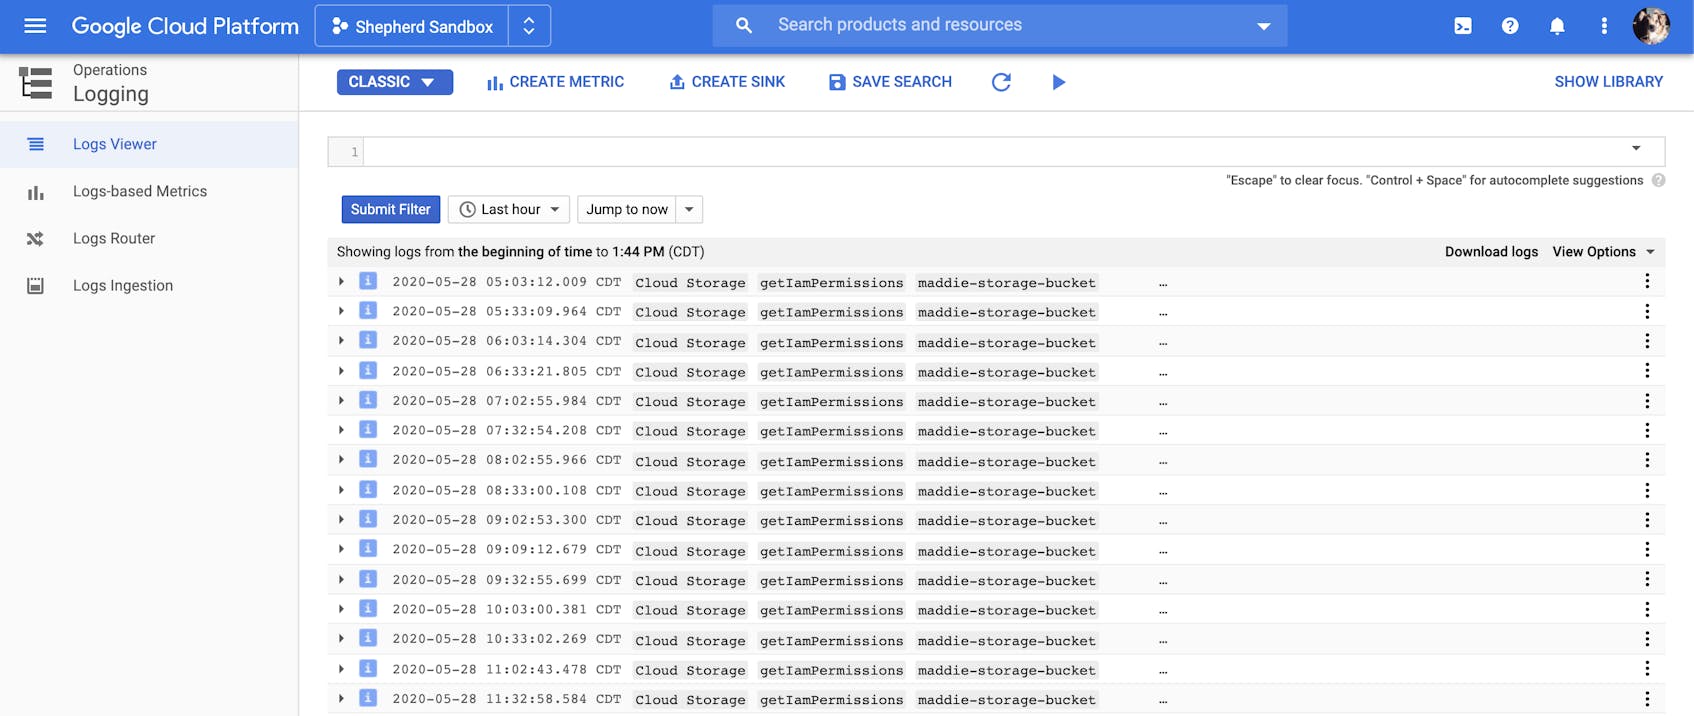
You can access your logs using GCP console. After logging in, select Logging then Log Viewer from the navigation menu.
It’s important to note that, while you can see project-level logs in the console, you can only view organization- and folder-level logs with the Cloud Logging API. To view all of your audit logs in one place, you can ship them to Datadog. We’ll cover how to configure Datadog to collect your audit logs later.
Next, we’ll go through each type of log in more detail.
Admin Activity audit logs
Admin Activity audit logs record administrative changes to your resource configuration. This could include events such as a user or service altering the permissions of a Google Cloud Storage bucket or a user creating a new service account, as seen in the sample entry below.
{
  "protoPayload": {
    "@type": "type.googleapis.com/google.cloud.audit.AuditLog",
    "status": {},
    "authenticationInfo": {
      "principalEmail": "maddie.shepherd@datadoghq.com",
      "principalSubject": "user:maddie.shepherd@datadoghq.com"
    },
    "requestMetadata": {},
    "serviceName": "iam.googleapis.com",
    "methodName": "google.iam.admin.v1.CreateServiceAccountKey",
    "authorizationInfo": [
      {
        "resource": "projects/-/serviceAccounts/123456789012345678901",
        "permission": "iam.serviceAccountKeys.create",
        "granted": true,
        "resourceAttributes": {}
      }
    ],
    "resourceName": "projects/-/serviceAccounts/123456789012345678901",
    "request": {
      "@type": "type.googleapis.com/google.iam.admin.v1.CreateServiceAccountKeyRequest",
      "name": "projects/-/serviceAccounts/ab6c214d4e4fgh1234567@sample-project.iam.gserviceaccount.com",
      "private_key_type": 2
    },
    "response": {},
  "insertId": "vwqyhke39pfj",
  "resource": {
    "type": "service_account",
    "labels": {}
  },
  "timestamp": "2020-05-18T15:09:50.746563735Z",
  "severity": "NOTICE",
  "logName": "projects/sample-project/logs/cloudaudit.googleapis.com%2Factivity",
  "receiveTimestamp": "2020-05-18T15:09:51.695275787Z"
}
Users require either the Cloud IAM Logging Viewer or Project Viewer role to view Admin Activity logs. They are enabled by default and, although you are not able to configure or disable them, you are not charged for them.
System Event audit logs
Google Cloud services generate System Event audit logs when they make modifications to your resource configurations. For example, you may see the following audit log entry when GCE live migrates an instance to another host.
{
  "protoPayload": {
    "@type": "type.googleapis.com/google.cloud.audit.AuditLog",
    "authenticationInfo": {
      "principalEmail": "system@google.com"
    },
    "serviceName": "compute.googleapis.com",
    "methodName": "compute.instances.migrateOnHostMaintenance",
    "resourceName": "projects/sample-project/zones/us-central1-a/instances/gke-default-pool-123",
    "request": {
      "@type": "type.googleapis.com/compute.instances.migrateOnHostMaintenance"
    }
  },
   "resource": {
    "type": "gce_instance",
    "labels": {
      "zone": "us-central1-a",
      "instance_id": "123456789012345",
      "project_id": "sample-project"
    }
  },
  "timestamp": "2020-05-07T19:59:34.633Z",
  "severity": "INFO",
  "logName": "projects/sample-project/logs/cloudaudit.googleapis.com%2Fsystem_event"
}
Like Admin Activity logs, System Event audit logs are enabled by default, do not incur charges, and require either the Logging Viewer or Project Viewer role.
Data Access audit logs
Data Access audit logs consist of three sub-types:
- Admin read: reads of service metadata or configuration data (e.g., listing buckets or nodes within a cluster)
- Data read: reads of data within a service (e.g., listing data within a bucket)
- Data write: writes of data to a service (e.g., writing data to a bucket)
Due to the potentially large volume of Data Access logs your environment can generate, they are not enabled by default. You need to explicitly enable each sub-type for any services you want to monitor. A service account retrieving a list of storage buckets, for example, may generate the following ADMIN_READ Data Access log:
{
  "protoPayload": {
    "@type": "type.googleapis.com/google.cloud.audit.AuditLog",
    "status": {},
    "authenticationInfo": {
      "principalEmail": "test-bot.gserviceaccount.com",
      "serviceAccountKeyName": "//iam.googleapis.com/projects/sample-test/serviceAccounts/a1bcd2e3456k9f00934gh@test-bot.gserviceaccount.com/keys/e123e0b9dde1234b1d22a4cb123456d51ree"
    },
    "requestMetadata": {},
    "serviceName": "storage.googleapis.com",
    "methodName": "storage.buckets.list",
    "authorizationInfo": [
      {
        "permission": "storage.buckets.getIamPolicy",
        "granted": true,
        "resourceAttributes": {}
      }
    ],
    "resourceLocation": {},
  "insertId": "14suazjdct0e",
  "resource": {
    "type": "gcs_bucket",
    "labels": {
      "project_id": "sample-project",
      "location": "global",
      "bucket_name": ""
    }
  },
  "timestamp": "2020-05-20T13:03:05.396618238Z",
  "severity": "INFO",
  "logName": "projects/sample-project/logs/cloudaudit.googleapis.com%2Fdata_access",
  "receiveTimestamp": "2020-05-20T13:03:06.387630414Z"
}
Note that, unlike Admin Activity and System Event logs, GCP charges you for Data Access logs. Users need either the Cloud IAM Logging Viewer, Logging Private Logs Viewer, Project Viewer, or Project Owner role to view these logs.
Interpreting your audit logs
Audit logs include important data for monitoring GCP service activity, and knowing how to interpret log entries can help you pinpoint potential gaps in your cloud security policies. Let’s break down a sample access log—which records a successful call by a service account to list storage buckets—to show where you can find the most useful information.
All audit logs provide a payload (protoPayload) that includes authentication (authenticationInfo) and authorization (authorizationInfo) data of the user (or service account) as well as the call (methodName) that was made. In the snippet below, you can see that a test-bot service account made a call to list a group of storage buckets (storage.buckets.list). Note also the @type field that identifies this as an audit log. All audit logs, regardless of sub-type share this attribute. We’ll come back to it when we look at shipping logs to an external service.
"protoPayload": {
    "@type": "type.googleapis.com/google.cloud.audit.AuditLog",
    "status": {},
    "authenticationInfo": {
      "principalEmail": "test-bot@example-project.iam.gserviceaccount.com",
      "serviceAccountKeyName": "..."
    },
    "requestMetadata": {},
    "serviceName": "storage.googleapis.com",
    "methodName": "storage.buckets.list",
    "authorizationInfo": [
      {
        "permission": "storage.buckets.getIamPolicy",
        "granted": true,
        "resourceAttributes": {}
      }
    ],
    "resourceLocation": {}
  }
You can tell which requests are from a user versus a service account by looking at the domain of the principalEmail. If the domain is gserviceaccount.com, the account is a service account. If the domain is google.com, it is a Google service performing admin activity. If it is any other domain, it is a user making the request.
Calls to list storage buckets within a project are typically made by users, not service accounts. If you see log entries that show service accounts making these calls then you may need to troubleshoot further by monitoring any other calls the account is making. Or, you can identify which team within your organization owns the service to confirm that the calls were necessary.
The resource section provides more details about the specific resources being queried or modified. The snippet below, for example, shows that the test-bot service account made a call to list all Cloud Storage buckets (gcs_bucket) in the project sample-project.
 "resource": {
    "type": "gcs_bucket",
    "labels": {
      "project_id": "sample-project",
      "location": "global",
      "bucket_name": ""
    }
  }
You can look at the log entry’s logName for information including a suffix identifying the log sub-type (e.g., Admin Activity, System Access, Data Access) and where in the hierarchy the request was made. Here, we can see that this is an Admin Activity log recording a request to a project, sample-project:
"logName": "projects/sample-project/logs/cloudaudit.googleapis.com%2Factivity"Your GCP resources can produce a large volume of audit logs, making it difficult to find the logs you need to detect unusual activity or troubleshoot problems before they turn into security incidents. Next, we’ll highlight some of the critical log events you should track to make sure your environment is secure. Then, we’ll walk through shipping those logs to a monitoring service like Datadog.
Key GCP audit logs to monitor
Cloud IAM policies are complex and can grant users and service accounts access to resources at every level of your environment’s hierarchy. Monitoring audit logs provides a better understanding of who is accessing a resource, how they are doing it, and whether or not the access was permitted.
Some common scenarios that lead to your GCP account being compromised include:
- publicly accessible GCP resources, such as storage buckets or compute instances
- misconfigured IAM permissions
- mishandled GCP credentials
Attackers often look for these types of vulnerabilities in order to gain access to your environment. Once they have access, they can modify GCP services, escalate privileges and create new accounts, and exfiltrate sensitive data.
As an example of misconfigured permissions, a Cloud Storage IAM policy for your storage buckets can include the value allAuthenticatedUsers as a member of the role Storage Object Admin. This would grant all authenticated users to GCP—not just authenticated users within your account—the ability to create, delete, and read all objects within the storage bucket.
GCP provides security guidelines that are mapped to frameworks such as CIS Benchmarks, which offer baseline best practices for securing your environment. Your audit logs complement these guidelines and provide a detailed history of activity, ensuring that you can mitigate potential threats to your environment. Next, we’ll look at the following key audit logs you can monitor for your resources:
For each log type we cover, we will look at some JSON attribute data that can help you pinpoint the origin of a possible attack. This includes the status of a call (i.e., the data.protoPayload.status.message attribute), the API call that was made (i.e., the data.protoPayload.methodName attribute), and the email address for the account that made the API call (i.e., the data.protoPayload.authenticationInfo.principalEmail attribute).
We’ll also look at a few CIS Benchmark recommendations for securing each resource.
User and service accounts
Attempts to compromise your environment often start with an attacker using an exposed API key and enumerating—or listing out— their permissions within the GCP account. Monitoring your audit logs for the following activity can help you identify attackers attempting to enumerate their permissions or maintain persistence in your environment.
Unauthorized activity logs will include, as part of their protoPayload, an entry showing that the call was denied:
  "protoPayload": {
    "status": {
      "code": 7,
      "message": "PERMISSION_DENIED"
    }
  }
A single denied call for a user or service account does not mean the account is compromised. For example, it could be a user navigating around the GCP console who is not permitted to access certain GCP services. Or, if you have an internal service that is a part of a build pipeline requesting access each time a build runs, it might be denied due to a misconfigured build job or IAM permission.
However, if this is the first time a service account is receiving PERMISSION_DENIED responses, it may be worth investigating why the account is being denied access. This type of unauthorized activity could be an indicator that an attacker has access to a compromised user or service account. Once they have access, attackers may then try to create new service accounts or service account keys in order to create a backdoor into your environment and maintain persistence.
Logs for new service accounts include an entry for a google.iam.admin.v1.CreateServiceAccount API call in the methodName JSON attribute. When a new service account key is created, you will see a log entry for a google.iam.admin.v1.CreateServiceAccountKey call.
These logs do not always indicate a security threat, but you should ensure that the calls were legitimate. For example, an attacker may create a key on a service account with domain-wide delegation enabled. If a service account with this enabled has the ability to access a Google Workspace account, it could be used to leverage permissions within that account, such as creating new Google Workspace administrators. Google does not log whether or not the service account has been delegated domain-wide authority when creating a Service Account Key; if you notice new key creation activity, you should investigate further. To protect your service accounts, CIS recommends ensuring that you do not grant them any admin, editor, or owner roles.
Buckets
Storage buckets are often a component of a breach in public clouds. This may be due to a misconfigured bucket or an attacker exploiting another vulnerability to gain access to a storage bucket. Monitoring your Cloud Audit Logs can detect the following bucket misconfigurations or attacker techniques.
To enumerate their permissions, an attacker will first attempt to use a compromised service account to list storage buckets. For these types of events, you will see a service account making a storage.buckets.list call. Service accounts typically do not need to list storage buckets because they are already configured to access the buckets they need, so if you see this type of log you should investigate.
If a bucket is publicly accessible, you will see audit log entries that show the data.protoPayload.serviceData.policyData.bindingDeltas.member JSON attribute is set to allUsers or allAuthenticatedUsers and the action is set to ADD:
  "protoPayload": {
    "serviceData": {
      "policyDelta": {
        "bindingDeltas": [
          {
            "action": "ADD",
            "member": "allUsers",
            "role": "roles/storage.objectViewer"
          }
        ]
      }
    }
  }
You should review your permission policies any time you see this level of access to a GCP resource as it could be an indicator that the resource is accessible to any users outside your network.
Logging sinks and Pub/Subs
Your Cloud Audit Logs can also alert you to modifications to a sink or a Pub/Sub topic or subscription, which is a technique attackers often use to disable security tools. Changes to one of these sources could disrupt the flow of logs to an external monitoring or analysis tool, reducing your visibility into activity in your environment. You can detect this type of attack by watching your audit logs for the following events:
Your Cloud Audit Logs capture these types of activity, enabling you to triage potential threats to your environment and quickly troubleshoot problems with the permissions of your users and service accounts. To get even deeper insights into activity across your GCP environment, you can easily export these logs to other monitoring and analysis tools.
Shipping your audit logs
As part of its Operations Suite (formerly Stackdriver), GCP provides Cloud Logging for querying and analyzing all of your logs. Cloud Logging uses sinks for exporting logs to another source. All sinks include an export destination and a logs query. You can use Cloud Logging sinks to export your logs to a destination such as cloud storage, a BigQuery dataset, or a Publish Subscribe (Pub/Sub) topic. Cloud Logging compares a sink’s query against incoming logs and forwards matching entries to the appropriate destination.
Pub/Subs provide fast, asynchronous messaging for your applications, and are recommended for exporting audit logs to an external monitoring service like Datadog for further analysis. When you add a Pub/Sub topic as a sink’s export destination, Cloud Logging will send matched logs to that topic. Pub/Sub topics are message queues that other services can subscribe to with a Pub/Sub subscription in order to automatically receive those messages.
With the ability to export audit logs, you can easily incorporate them into your existing monitoring tools and get deeper insights into potential security or compliance issues within your environments. Next, we’ll show you how you can use Datadog to easily collect and analyze these logs.
Collect and analyze audit logs with Datadog
Datadog provides turnkey integrations for GCP and Google Workspace that offer several benefits for collecting and monitoring your logs:
- the Google Workspace integration simplifies the process for ingesting authentication logs
- Datadog automatically parses all Google Cloud and Google Workspace audit logs streaming from your GCP environments
- Datadog enriches Google Cloud and Google Workspace logs with more contextual information for improved investigations
Once you enable the integrations, you can build custom dashboards to get a high-level view of log activity and use Datadog’s built-in threat detection rules to sift through key audit logs and automatically identify critical security and compliance issues in your environments. First, we’ll walk through setting up your GCP account to forward Cloud Audit Logs to Datadog.
Export Cloud Audit Logs to Datadog
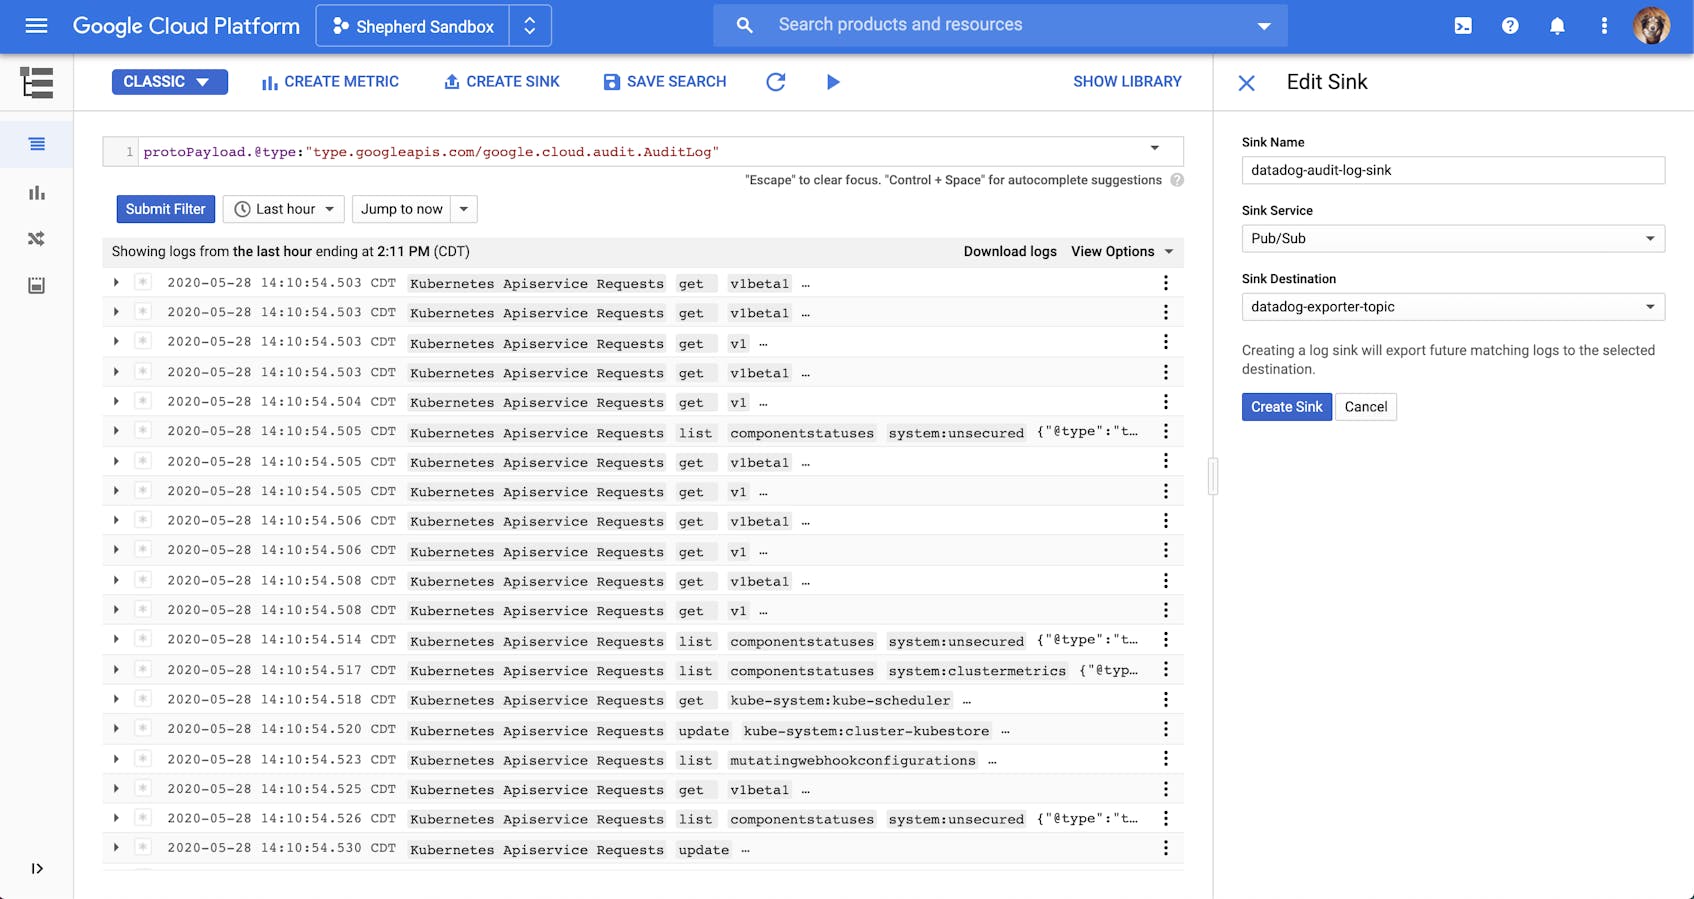
As mentioned earlier, creating a sink that forwards logs to a Pub/Sub topic is the recommended method for exporting Cloud Audit Logs to a third-party service. The following query will collect audit logs from all projects and organizations in your environment. Though in this example we use the Google Cloud Console, you can also use the Cloud Logging API and gcloud logging command-line tool to export logs.
protoPayload.@type:"type.googleapis.com/google.cloud.audit.AuditLog"To create a sink with this query, click on the “Create Sink” button in the console’s Logs Viewer, provide a name for the sink, and select Pub/Sub as the sink’s service. In the example configuration below, we’ve set the export destination for the queried logs as a Pub/Sub topic called datadog-exporter-topic. You can create a new topic by navigating to the Cloud Pub Sub console of your GCP account.
To send organization and folder logs to Datadog, you will need to use the Logging API and the gcloud command line utility. You can create sinks for these logs with the following commands:
$ gcloud logging sinks create {sink-name} pubsub.googleapis.com/projects/{project-id}/topics/{topic-name} --organization={organization-id} --log-filter="protoPayload.@type=\"type.googleapis.com/google.cloud.audit.AuditLog\""
$ gcloud logging sinks create {sink-name} pubsub.googleapis.com/projects/{project-id}/topics/{topic-name} --folder={folder-id} --log-filter="protoPayload.@type=\"type.googleapis.com/google.cloud.audit.AuditLog\""
After running each of the commands, you will need to grant the newly generated service account permission with the role of Pub/Sub Publisher on the topic.
Ideally, it’s best to forward all audit logs to your monitoring service. This ensures that you do not miss critical events that can negatively affect your applications. However, it’s important to note that your environment can generate a lot of Data Access audit logs, and Pub/Sub throughputs are subject to quota limits. If you are running into those limits, you can split your logs over several topics to break up throughput. You can also create an alert in Datadog to automatically notify you when you are close to hitting the quota limits.
Once you create the sink, Cloud Logging will export all new Data Access, Admin Activity, and System Activity logs to the selected topic. In order to direct those logs to Datadog, create a new Pub/Sub subscription for the datadog-exporter-topic topic and add Datadog as a subscriber, as seen in the example below.
The delivery type uses the Push method to send logs to a Datadog endpoint. Note that the endpoint requires a Datadog API key, which you can find in your account’s settings.
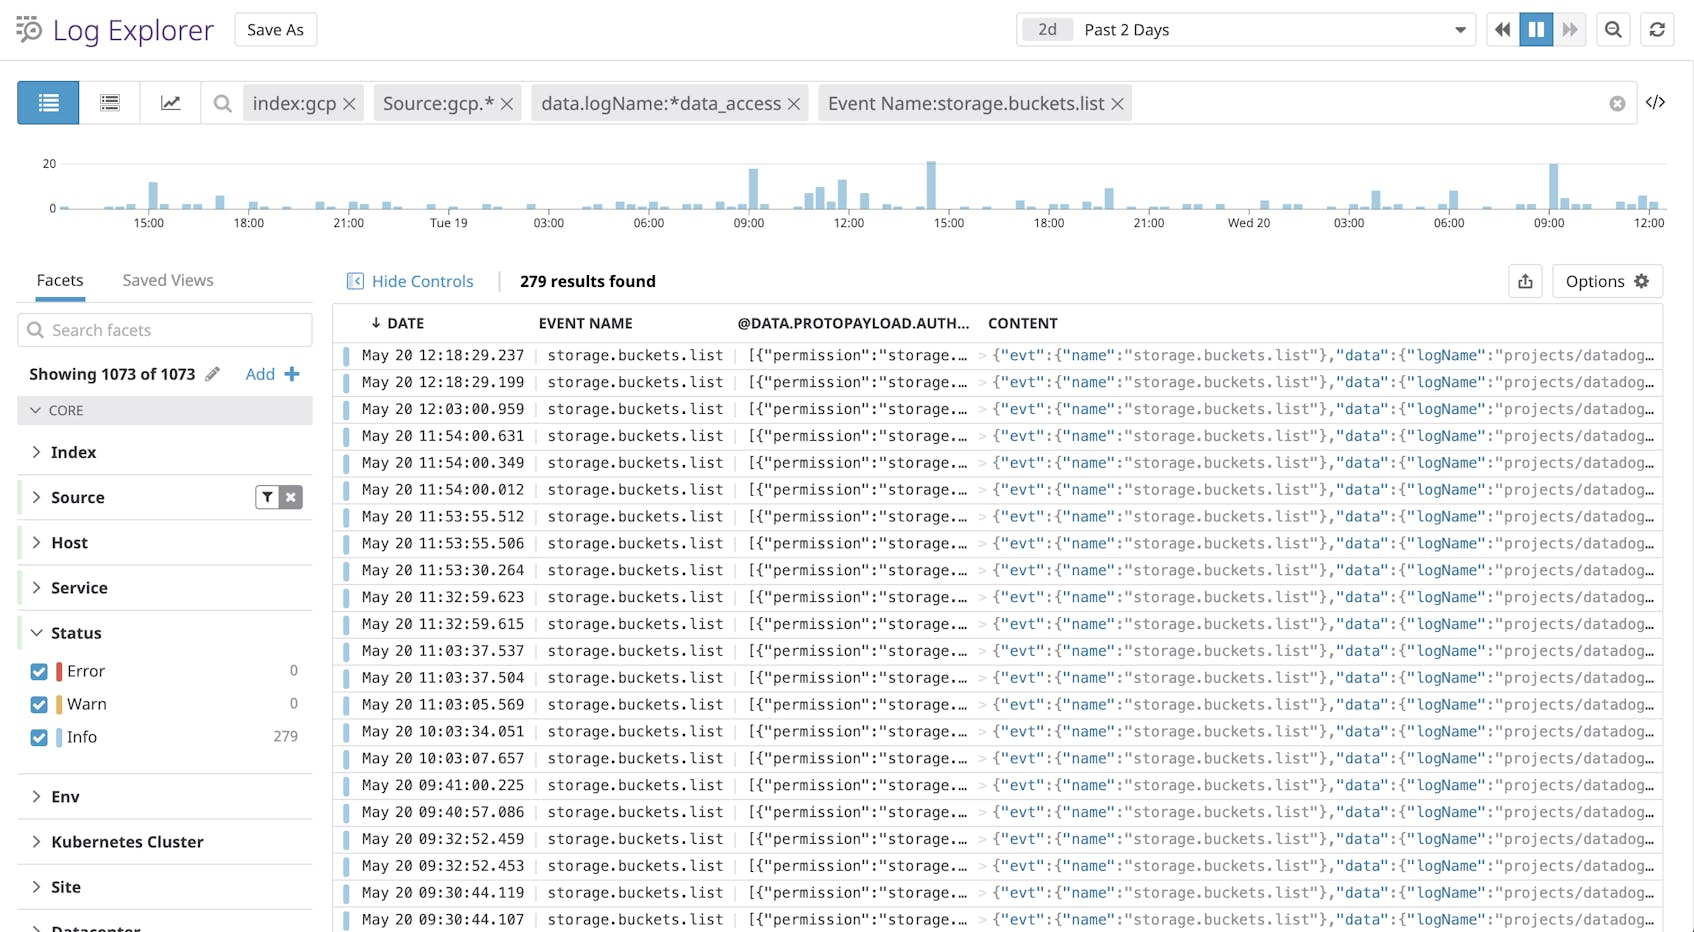
With the GCP integration enabled and configured to receive data, you will start seeing new Cloud Audit Logs in Datadog as GCP services generate them. If you enabled the Google Workspace integration, you will also see Google Workspace logs streaming alongside your other logs. Datadog’s log processing pipelines automatically parse properties from your Google Cloud and Google Workspace audit logs as tags, which you can use in the Log Explorer to sort and filter all your logs and search for a subset of them that you need. For example, you might want to look for accounts that made a call to list buckets within a specific project.
Keep in mind that the methodName attribute in GCP audit logs is automatically mapped to the Event Name standard attribute in Datadog.
Get a high-level view of log activity
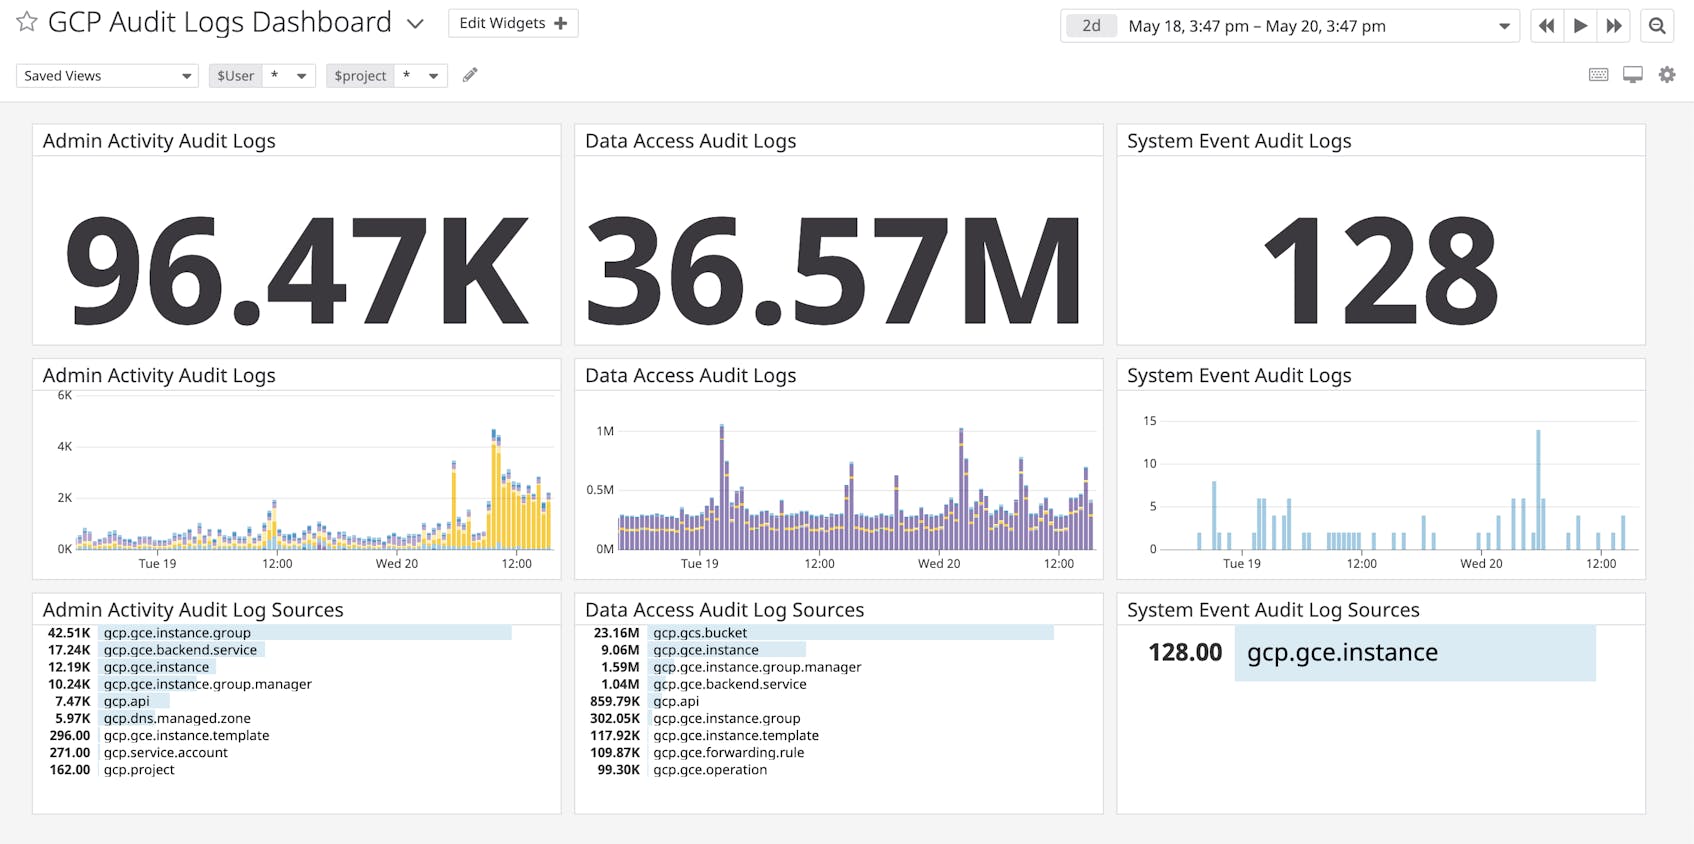
With Datadog’s GCP and Google Workspace integrations, you can immediately get deeper insights into log activity and monitor application security and compliance. You can build dashboards that provide an overview of the logs streaming into Datadog, as seen in the example below.
You can create facets from attributes in your ingested logs and use them to build visualizations, such as a list of the top five sources in your environment of Admin Activity audit logs.
Identify potential security threats in real time
The Datadog Cloud SIEM product provides out-of-the-box detection rules covering common techniques outlined by the MITRE ATT&CK® framework for attacking applications running in GCP environments, many of which can be identified in the key audit logs we looked at earlier. In addition, these rules are also mapped to compliance frameworks, such as CIS, to detect changes in your environment that may introduce misconfigurations in your environment and leave your infrastructure vulnerable.
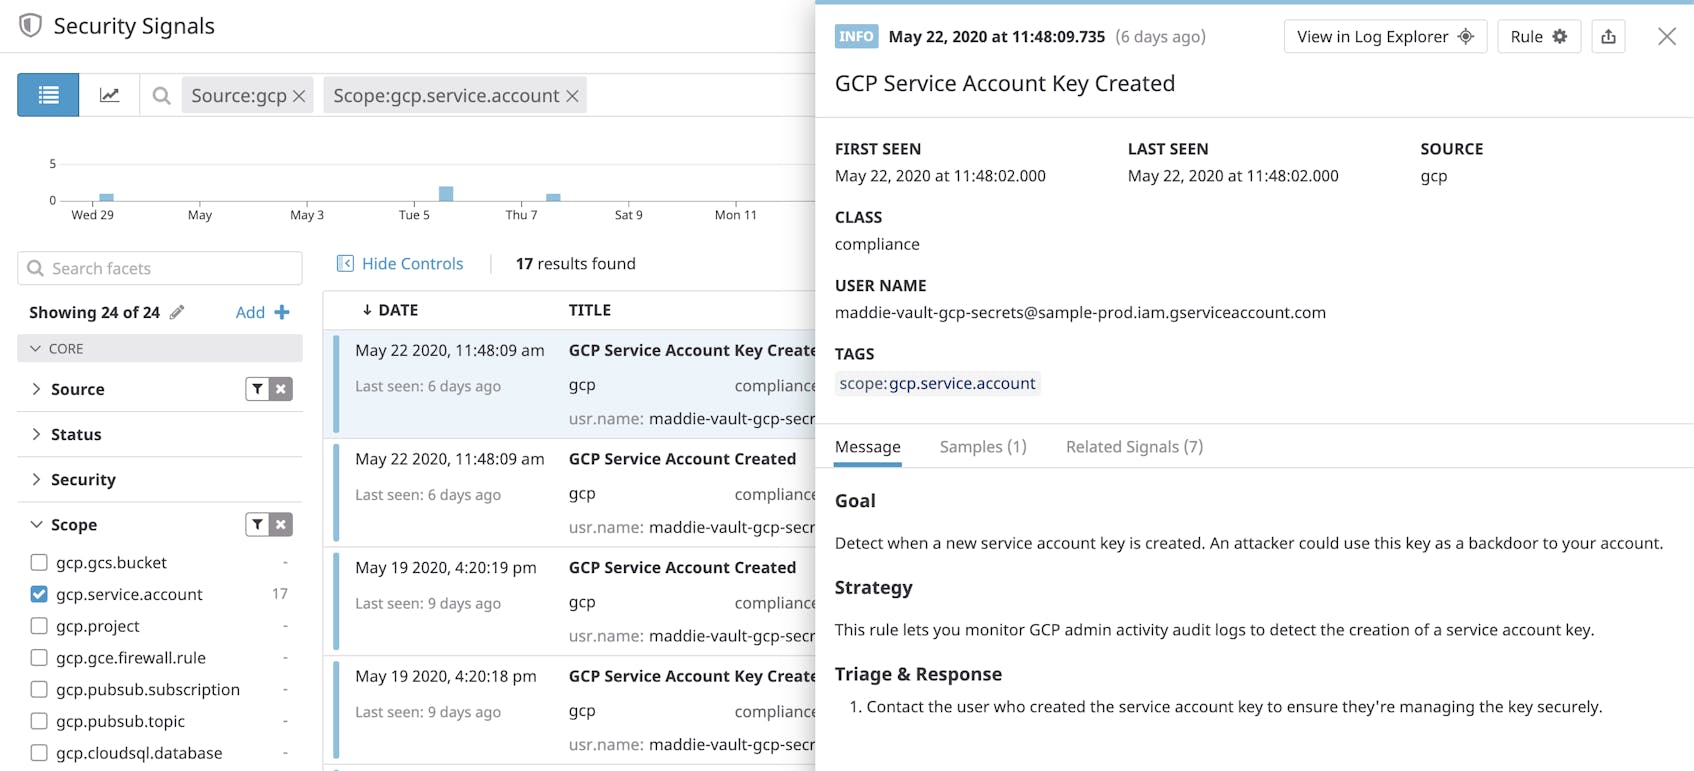
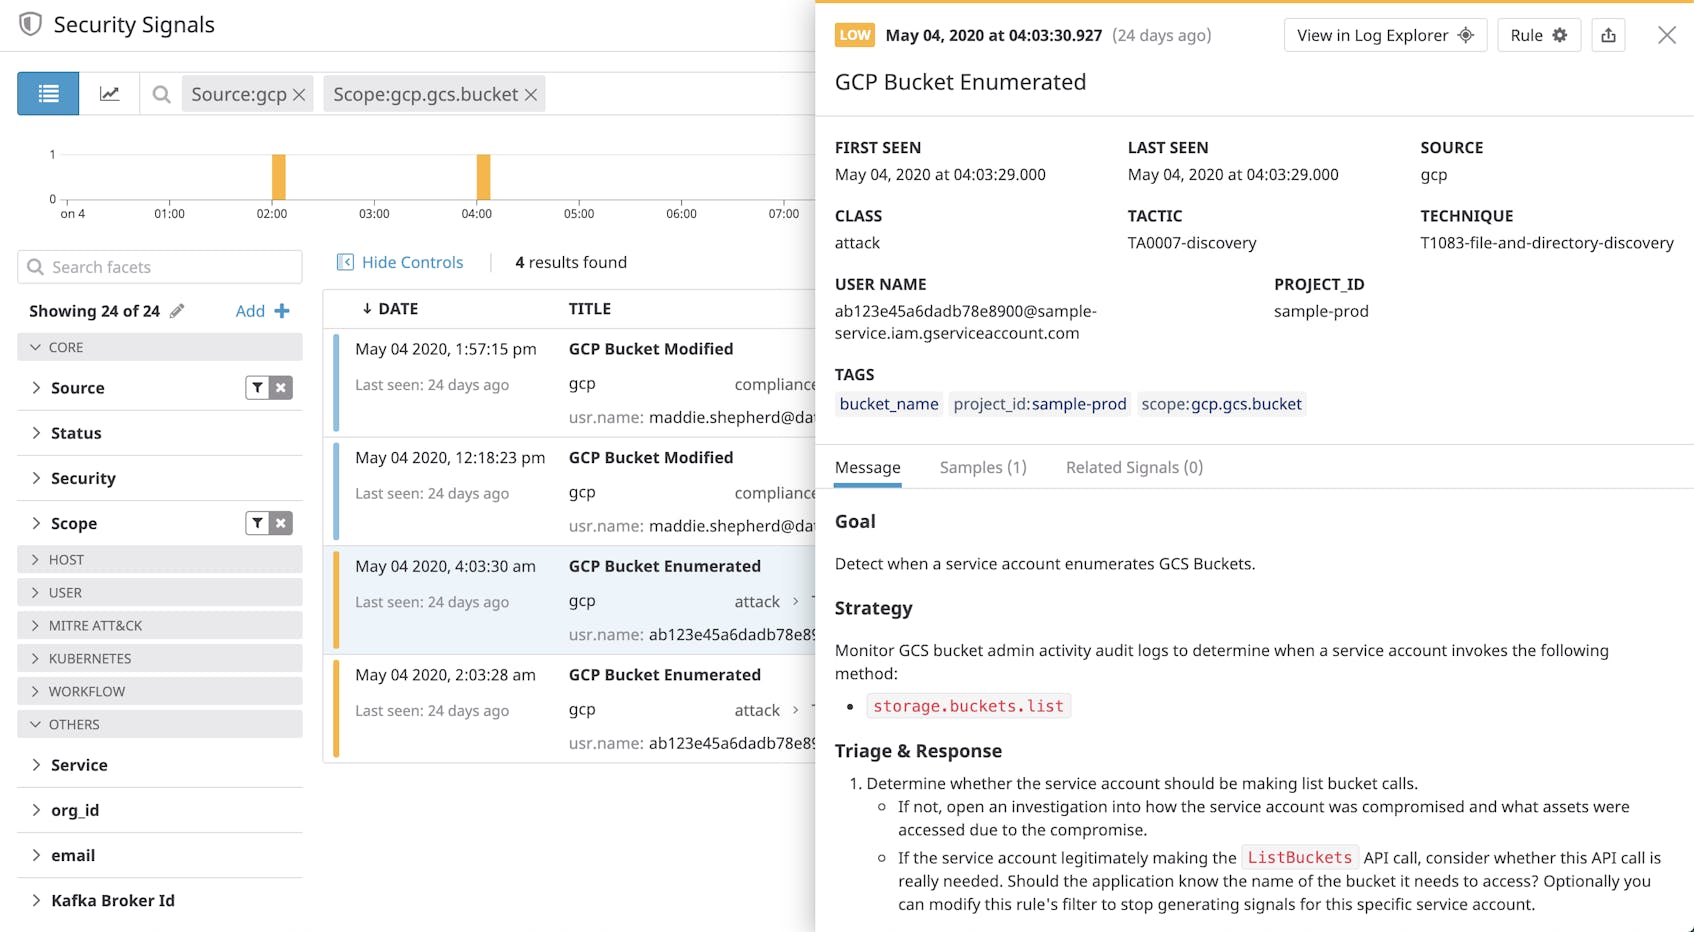
When audit logs trigger a rule, Datadog creates a security signal. You can review and triage signals in the Security Signals explorer, where they’re retained for 15 months. Each signal provides more details about the activity as well as guidelines for responding.
In the example signal above, you can see that a service account enumerated a storage bucket. The signal includes a sample of the Cloud Audit Log that triggered the rule as well as the name of the service account that made the calls.
Datadog’s GCP detection rules can also help you automatically monitor changes to a Cloud Logging sink or Cloud Pub/Sub topic or subscription, which could disrupt the flow of logs to your Datadog account.
Start monitoring your Cloud Audit Logs
In this post, we looked at GCP audit logs and how they can provide invaluable insight into activity in your environment so that you can quickly identify possible misconfigurations and threats. We then walked through some best practices for collecting audit logs as well as how tools such as detection rules and the Security Signals explorer can provide deeper visibility into GCP security.
You can check out our documentation for more information on getting started monitoring the security of your applications and GCP resources. Or, sign up for a free trial to start monitoring your applications today.


