

Providing rich context for monitor alerts is an essential part of any robust, scalable monitoring strategy. Alerts that send teams scrambling for basic background information prolong troubleshooting, hindering effective incident response and heightening the potential for service disruption. Given the increasing complexity of modern, distributed applications, however, breaking down knowledge silos in order to ensure consistent access to critical context for alerts can be a challenge.
Datadog’s new and improved Monitor Status page answers this challenge by providing engineering teams with a centralized resource for quickly getting rich context for monitor alerts. In this post, we’ll guide you through this page and show you how you can use it to:
- Quickly orient any investigation prompted by an alert
- Get rich historical context for alerts
- Kick-start troubleshooting with in-depth guidance
Quickly orient any investigation prompted by an alert
Even in the most basic scenarios, it can be hard to get the full picture necessary to understand alerts. Let’s say you’re an on-call engineer who receives an alert for high CPU usage in your application infrastructure. First of all, you need to understand the scope of the issue: is it isolated to a single host or is it affecting other parts of your system? Was the alert set off by a sudden, isolated spike or are there underlying trends? Are there any recent changes—deployments, configuration changes, etc.—that should be considered as culprits?
Too often, teams lack clear, consistent, and cohesive means for answering these basic questions. Instead, they shuffle between an unwieldy assortment of disconnected tools, which can cost them precious time during incidents. The Monitor Status page enables teams to streamline their troubleshooting and incident response, providing a consistent, comprehensive starting point for any investigation prompted by an alert.

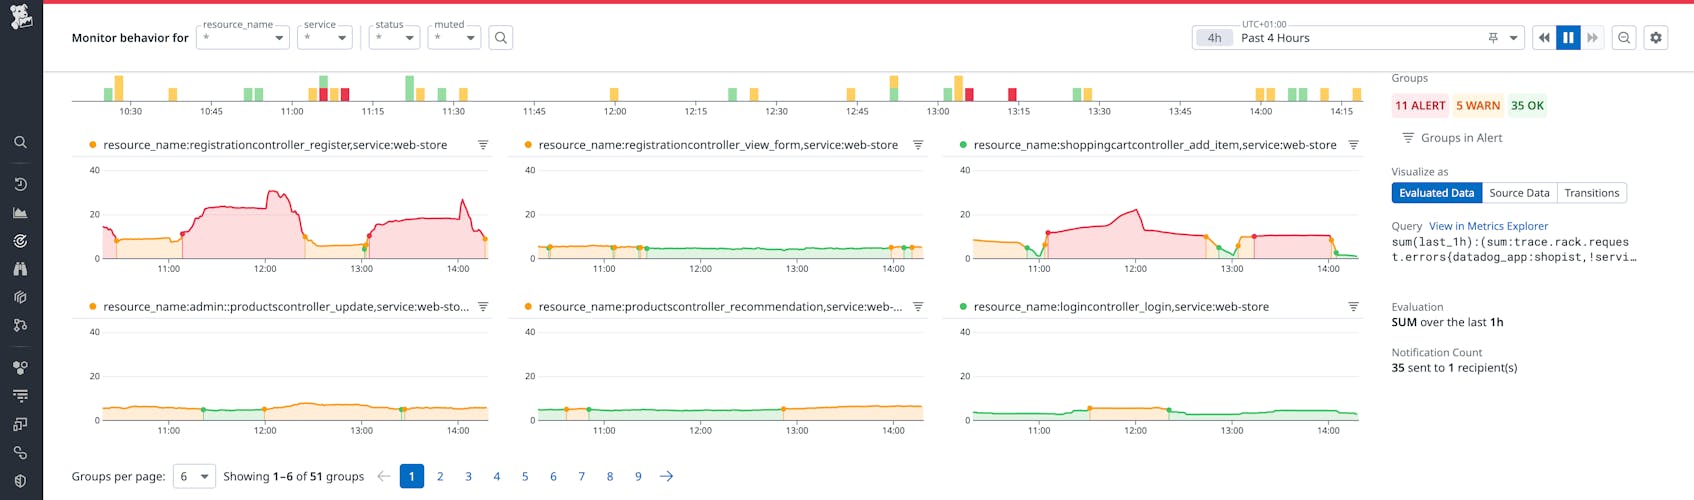
At the top of the page, you’ll find a clear breakdown of monitor behavior, configuration, and tags, as well as visualizations that enable you to quickly place the alert in its detailed historical context.
Get rich historical context for alerts
Understanding the historical context for an alert is an indispensable step in any investigation. By default, the Monitor Status page graphs each monitor’s aggregated evaluation values over time and plots them alongside transitions in status (e.g., Alert, Warn, OK, No Data). This lets you quickly gauge monitor thresholds against performance trends and determine whether the cause of the alert was a true anomaly or part of an ongoing issue.
Filtering this data can help you zero in on signals and eliminate noise early in your investigations. For example, you can filter by group status in order to bring groups that are currently alerting into focus, or zero in on a specific host or datacenter in order to refine the scope of your investigation.
Change Tracking visualizations provide another vantage on the historical context of an alert, enabling you to quickly determine whether alerts coincide with any recent deployments, configuration changes, or other updates, and start investigating potential correlations.
In the example above, graphs on the page might reveal that CPU usage started spiking almost at the same time as the deployment. This information narrows the investigation scope dramatically and lets you quickly course-correct and roll back the change, or troubleshoot as needed.
Further down on the Monitor Status page, the Events Timeline provides a chronology of significant events pertaining to the monitor, from state transitions to audit log entries and scheduled downtime. You can select any event from the timeline to investigate it in depth.
Kick-start troubleshooting with in-depth guidance
Alongside this contextual data, the Monitor Status page can be a resource for in-depth guidance for troubleshooting. The Event Details section includes a customizable monitor message that can be used to provide runbook-style guidance for troubleshooting and more. Alongside this, the Next Steps section enables you to quickly take action by declaring an incident, creating a case, running workflows, or quickly navigating to resources such as related logs, traces, or dashboards.

For monitors tagged or grouped by service, the page also includes a Dependency Map that visualizes service relationships. By highlighting upstream and downstream dependencies and surfacing key metrics such as error rates and traffic volumes, this map can help you quickly assess the blast radius of an issue and home in on potential root causes.

Enrich your frame of reference for every alert
Datadog’s new Monitor Status page gives teams a comprehensive resource for quickly launching any investigation prompted by an alert. It condenses key information on monitors, provides rich historical and systemic context, and can also be a resource for in-depth guidance for troubleshooting. For more information, see our documentation. And if you’re new to Datadog, you can get started with a 14-day free trial.
