Rust’s strong memory safety and efficient code execution make it a top choice for building robust, high-performance systems. But even with its powerful guarantees around memory management and thread safety, Rust applications in production environments can still face challenges such as latency spikes, resource contention, and unexpected bottlenecks. For this reason, monitoring Rust applications is essential to ensure they meet performance expectations and remain reliable under load. The challenge for engineers, however, is that very little information is available—especially concrete, lab-tested information—that provides clear guidance about this topic.
The aim of this guide is to address this information gap. Datadog relies on OpenTelemetry (OTel) to gain code-level visibility into the performance of Rust services, so in this guide, we provide instructions on how to instrument a Rust application with OTel and send its collected telemetry to Datadog. First, we look at how we can prepare the application for telemetry data collection. Then, we walk through how to capture metrics, traces, and logs so that Datadog can visualize this telemetry data and enable you to keep your Rust applications running smoothly and efficiently. Finally, we provide a brief video capture illustrating what this captured OTel telemetry data looks like in Datadog and how you can use it for troubleshooting.
OTel instrumentation
Even though Datadog is used as the observability platform in this guide, the vast majority of the information isn't Datadog-specific. The OpenTelemetry Protocol (OTLP) defines a standard way for an application to send telemetry data. It just so happens that in these examples, the Datadog Agent sits on the receiving end of these vendor-neutral signals.
Preparing your Rust application for telemetry collection
Preparing a Rust application to send OTel-based telemetry data to Datadog involves a number of steps. First, you need to decide how to send OTLP data to Datadog and which tools to use for telemetry collection. Then, you need to add the right dependencies to your manifest file, configure OTel within the application’s startup function, and finally, configure the runtime environment.
Determining how to send OTLP data to Datadog
If you have instrumented a Rust application with OTel, you have two main options for sending your OTLP data to Datadog: directly via the Datadog Agent, or indirectly via the OpenTelemetry Collector. Sending it directly to the Agent allows you to add monitoring data collected by the Agent to your OTel data and thus benefit from whole-stack observability features from Datadog—such as security monitoring, live container monitoring, and live process monitoring. This is also the simpler option from a configuration standpoint. Using the OpenTelemetry Collector, meanwhile, enables you to maintain the highest degree of vendor neutrality for collecting and pre-processing your OTel data (e.g., for batching, filtering, and enriching) before you send it to the backend.
In this guide, we’ll focus on the first option: sending OTLP data directly to the Datadog Agent. This approach involves fewer moving parts and requires us only to configure our service to connect to the Agent’s OTLP endpoint.
Sending telemetry through the OTel Collector
If you are looking to send the telemetry data through the OpenTelemetry Collector instead, you can follow these Collector instructions. Note that choosing this method does not imply any code-level changes—where you decide to send OTLP data does not affect how you instrument your application.
Selecting a mechanism to enable collection of OTel data
To allow you to collect OTel-based telemetry for your Rust application, you can use either of two mechanisms: the Rust tracing crate from the Tokio ecosystem, or the set of core OpenTelemetry libraries themselves.
The tracing crate provides a versatile interface for collecting structured telemetry—including metrics, traces, and logs. Its design allows developers to plug in their implementation of choice to deliver this data as needed to a preferred backend system. Using this approach, you can export tracing telemetry data in OTLP format and select Datadog as the backend. Keep in mind, however, that this crate was released before OTel for Rust was fully established and before it was possible to collect Rust telemetry data directly through OTel’s core libraries.
Although using the tracing crate to collect OTel data offers a workable solution, we instead recommend dropping the intermediate tracing dependency and opting for direct integration with the core OpenTelemetry libraries—as is now possible with frameworks such as the popular Actix Web. This approach offers a simpler, more consistent delivery path for telemetry data from application code through to the Datadog observability backend and sidesteps inconsistencies that can arise from combining tracing with OTel.
As we describe how to instrument a Rust application in the sections below, we will be referencing an example service, pass-image-api (available on GitHub here), that uses this second approach. The service—which creates location-based images by assembling map tiles from OpenStreetMap—relies on the Actix Web framework to model an HTTP API and achieve native integration with OpenTelemetry.
Adding OpenTelemetry dependencies to your manifest
Before we configure OTel within our Rust application, we need to add some dependencies to our cargo.toml file, in the [dependencies] section. These dependencies include the core OTel libraries, the OTLP crate, and additional dependencies needed to support our OTel integration:
opentelemetryprovides access to the OTel API.opentelemetry-sdkallows you to configure the SDK and export the generated data.opentelemetry-otlpallows you to export the generated OTel data in OTLP format.opentelemetry-resource-detectorsallows you to populate all telemetry signals with resource information, such as the current environment (e.g., “production”) and service version (e.g., “1.2.3”), as well as OS-, process-, and SDK-related data.opentelemetry-appender-logallows you to bridge logs created with the log crate into OpenTelemetry. This dependency is also responsible for appendingTraceIDandSpanIDto the logs, which in turn allows correlation between different telemetry signals—for instance, between logs and traces, or between related requests across different services.
Configuring OpenTelemetry at startup
Next, we need to configure OTel within our application’s startup function. Since OTel is very flexible, there’s quite a bit to specify in our setup, so we’ll use a series of separate functions to meet all the requirements.
get_resourcesets up resources to capture environment metadata such as OS, service name, version, etc.init_tracersets up a tracer provider, which is used as a factory to create spans needed for our distributed tracing purposes.init_meter_providersets up a meter provider to produce meters, which are used to generate metrics.init_logger_providerinitializes a logger provider and sets up a log appender for the log crate, bridging logs to the OTel logger.
Original source code
To see these functions implemented in context, see here.
Configuring the runtime environment
We’re also going to want to provide some of this configuration information to our application at runtime, 12-factor style. This will typically be done through environment variables; we have no secrets, so we can keep things simple. Also note that since we are using OTel here, we are using the OTel-specific environment variables (and not the Datadog ones you may be familiar with):
OTEL_EXPORTER_OTLP_ENDPOINT: This points to our Datadog Agent, but it can point to any OTLP-compliant collector. If you use thehostPortConfigoption in your Datadog Agent configuration to enable a host port, you can point this directly to the IP address of the host machine. Otherwise, you can point it to the service name of the Agent itself. The port for gRPC collection, which we use in our example, is4317.OTEL_SERVICE_NAME: This is the name of the service exporting the telemetry. In our example, we usepass-image-api—but this name should be whatever the meaningful identifier is for your service.OTEL_RESOURCE_ATTRIBUTES: This allows us to specify additional resource attributes as a key-value list. We’ll generally want to add adeployment.environmentandservice.versionkey. Adding these two key-value pairs as a list would look like the following:deployment.environment=prod,service.version=1.2.3. For more information about key-value usage, check out our Universal Service Tagging guide.
After they are configured, these environmental variables are picked up by the EnvResourceDetector and set as resource attributes in all metrics, traces, and logs produced by the service.
To see a concrete example of how these variables are used in a Kubernetes environment, check out the deployment manifest for the pass-image-api example service.
Instrumenting your service
Now that we have set up the foundations for OpenTelemetry in our application, we need to make sure that we are able to emit traces, logs, and metrics.
Traces: Instrumenting the HTTP framework
Let’s start with traces. For an HTTP server, you need something “on the outside” of the incoming requests to mark the start of each span. In the best case, you will have access to a library that uses OpenTelemetry to instrument your particular HTTP framework. As we alluded to above, for instance, Actix Web applications—such as our sample application—can use the actix-web-opentelemetry library, which reduces the setup to the simple inclusion of additional middleware.
We use following code block to instrument incoming requests:
main.rs
// Create an actix-web webserver
let server = HttpServer::new(|| {
   App::new()
       // Use actix-web-opentelemetry to instrument
       // our application. This will manage the
       // trace creation for us.
       .wrap(RequestTracing::new())
       .service( /*  */ )
});
Original source code
You can see this code snippet in its context here.
And we use the following code to instrument outgoing requests:
tiles.rs
let client = awc::Client::new();

// Make an HTTP GET request to fetch the tile
let mut response = client
    .get(&url)
    .insert_header(("User-Agent", "dd-sdlc-demo"))
    .trace_request_with_context(cx.clone())
    .send()
    .await
    .unwrap();
Original source code
You can see this code snippet in its context here.
Traces: Instrumenting directly with OTel
The previous step uses a wrapper for Actix Web to auto-instrument incoming and outgoing requests for our Rust service. Automatic instrumentation of this type can inform you, for example, about the requests your service receives, which other services are called by these requests, how long they take to be processed, and whether they are successful.
But you will also sometimes wish to instrument your code manually, directly with OTel, to gain some insights into the performance of any parts of your code that are not automatically instrumented. This need typically arises when you want to add manual spans to some interesting subset of work within your service.
For instance, our example service, pass-image-api, issues a large number of HTTP requests in parallel to collect the data it needs to process each incoming request it receives to generate an image. We might decide to wrap this set of HTTP requests in a custom span, called fetch_image, to make it easier to surface information related to this subset of work.
To do so, we need to use OTel directly to introduce a span:
tiles.rs
    let tracer = global::tracer("fetch_image_tracer");
    let span = tracer
        .span_builder("fetch_image")
        .with_kind(SpanKind::Internal)
        .start(&tracer);

    let cx = Context::current_with_span(span);

    // Fetch the image here
    // [...]
    // Done fetching the image

    // Set the span status to OK and end the span
    cx.span().set_status(Status::Ok);
    cx.span().end();
Original source code
You can see this code snippet in its context here.
The following screenshot shows how grouping these traces together appears in Datadog APM. You can see that our service makes a significant number of upstream HTTP calls in parallel. These calls are consolidated in our new span, fetch_image:
Direct OTel instrumentation
For more information about direct instrumentation with OTel, check out the Instrumentation section from OpenTelemetry’s Getting Started guide.
Logs
Now that we have traces, we will also want to emit logs that will be gathered up and aggregated with each request to shed light on the full context of those requests. Thanks to the opentelemetry-appender-log crate, we can lay the groundwork for this functionality by setting up the logger_provider, as shown in the snippet below. Then, to adjust the log level, we use the log crate’s log::set_max_level() function. Note that you typically want to read this setting from an environment variable, as we do here, so that you can specify a different value as needed for each particular environment:
telemetry_conf.rs
fn init_logger_provider() {
    let logger_provider = opentelemetry_otlp::new_pipeline()
        .logging()
        .with_exporter(opentelemetry_otlp::new_exporter().tonic())
        .with_resource(get_resource())
        .install_batch(runtime::Tokio)
        .expect("Failed to initialise logger provider");

    // Setup Log Appender for the log crate
    let otel_log_appender = OpenTelemetryLogBridge::new(&logger_provider);
    log::set_boxed_logger(Box::new(otel_log_appender)).unwrap();

    // Read maximum log level from the environment, using INFO if it's missing or
    // we can't parse it.
    let max_level = env::var("LOG_LEVEL")
        .ok()
        .and_then(|l| Level::from_str(l.to_lowercase().as_str()).ok())
        .unwrap_or(Level::Info);
    log::set_max_level(max_level.to_level_filter());
}
Original source code
You can see this code snippet in its context here.
With this setup complete, calling init_logger_provider ensures that all logs from the configured log level and above (or INFO and above if not specified) will be exported via the OTLP exporter. They will also automatically be enriched with trace context data, which can then be used to correlate traces and logs in Datadog.
Next, to emit a log message, you can use the log crate as we do in the following examples—without and with additional key-value data, respectively:
main.rs
use log::info;

// An example without extra kv data
info!(
    "Fetching image for lat: {}, long: {}, size: {}",
    lat, long, size_px
);

// We can also use the 'kv' feature on the log crate, and add additional
// structured fields to our logs. These will then be easily queryable in Datadog
info!(
    latitude = lat,
    longitude = long;
    "Fetching image"
);
Original source code
You can see this code snippet in its context here.
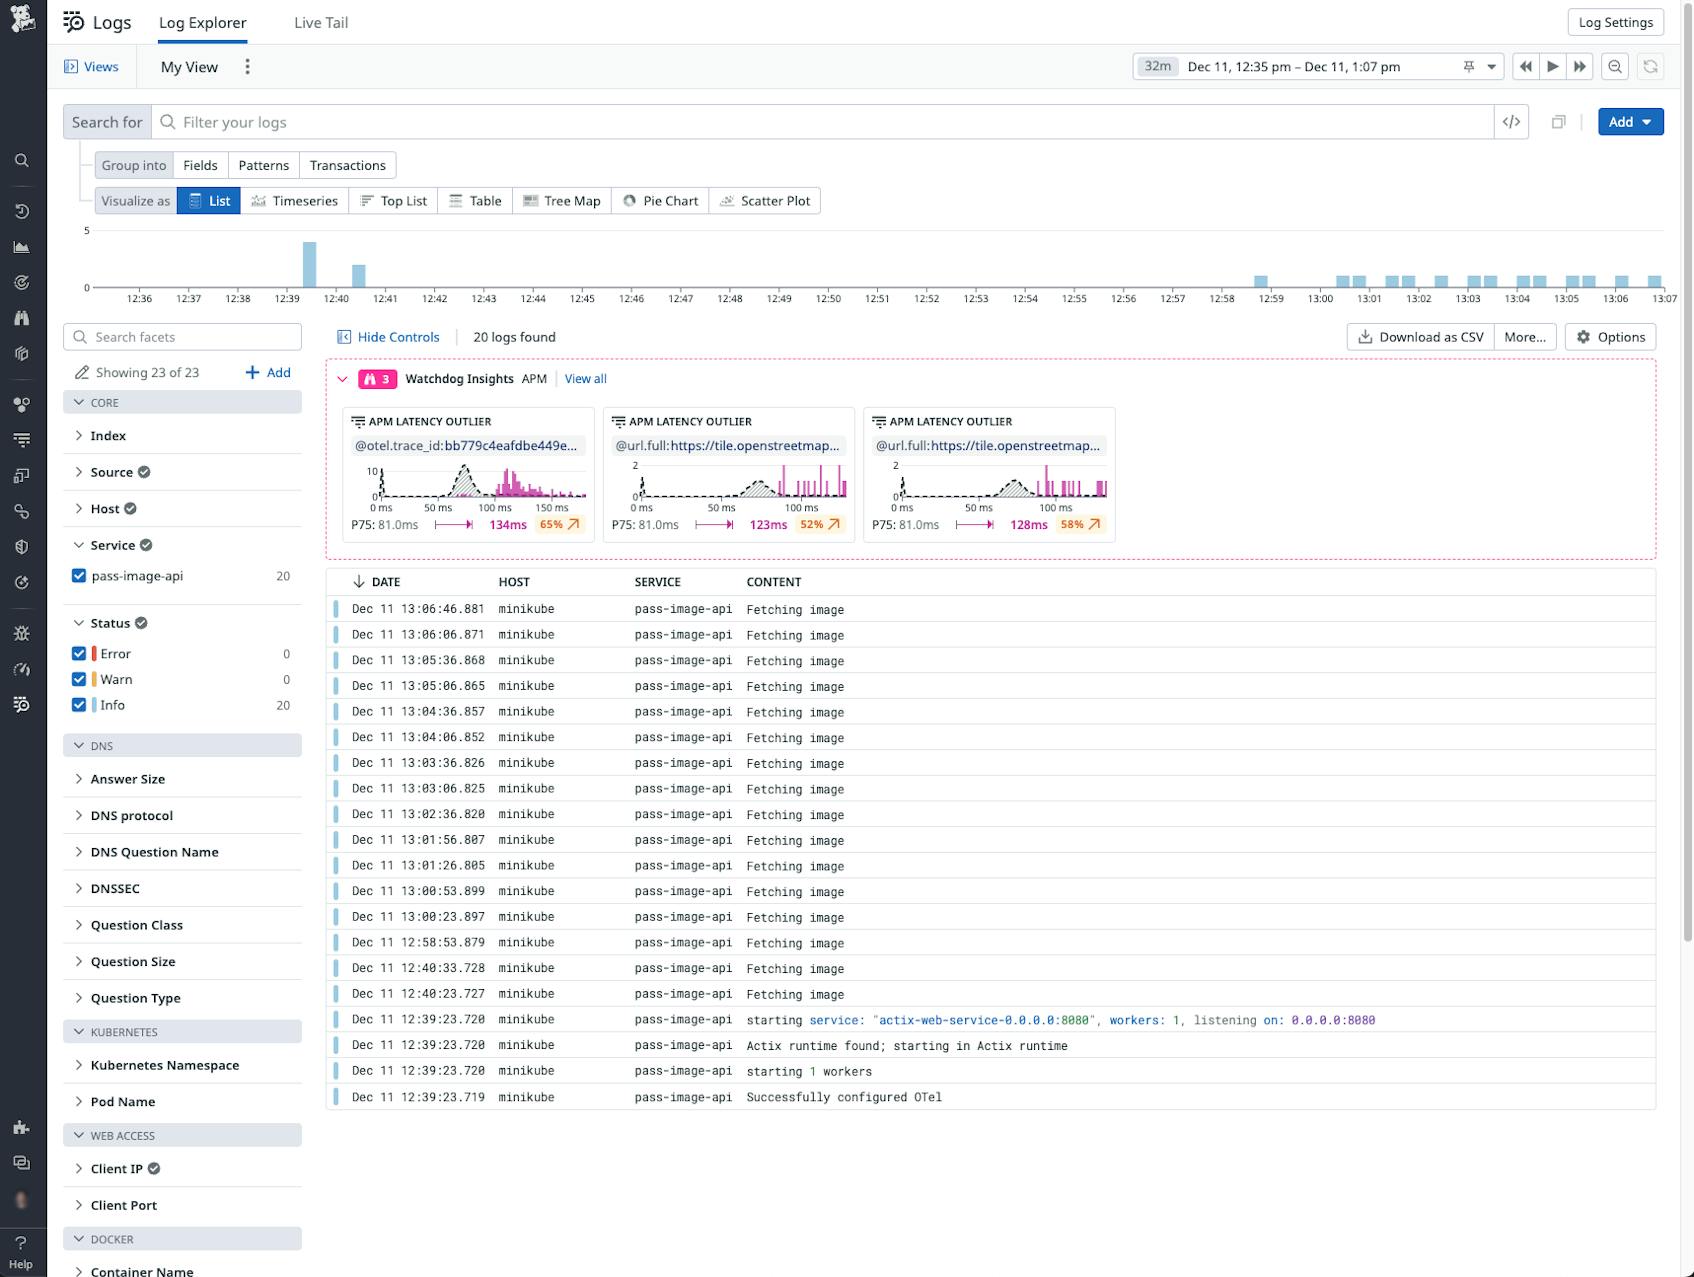
The following image shows Log Management in Datadog receiving the first OTel logs generated by our sample application. We can immediately see the host the log was generated on (“minikube”), the name of our service (“pass-image-api”), and the log message content itself:
Metrics
You’ll often want to record some interesting metrics about your application to monitor its behavior. For example, you might track the “number of {X}s”, to graph them over time and reason about load, or to measure how long a particular piece of code takes to run. In OTel, you use “meters” to perform these kinds of measurements.
For example, in our sample application, we generate images of locations in the world by collecting map tiles and gluing them together. This process is CPU-intensive, and we want to know how much time we spend on it. The following code creates a meter to produce a histogram, which in turn measures the processing time of the operation:
main.rs
// Create the meter
let meter = global::meter("processing_time_meter");
let processing_time =
    meter.f64_histogram("processing_time").init();
let start = std::time::Instant::now();

// ... do some work

// Record the metric
processing_time.record(start.elapsed().as_secs_f64(), &[]);
Original source code
You can see this code snippet in its context here.
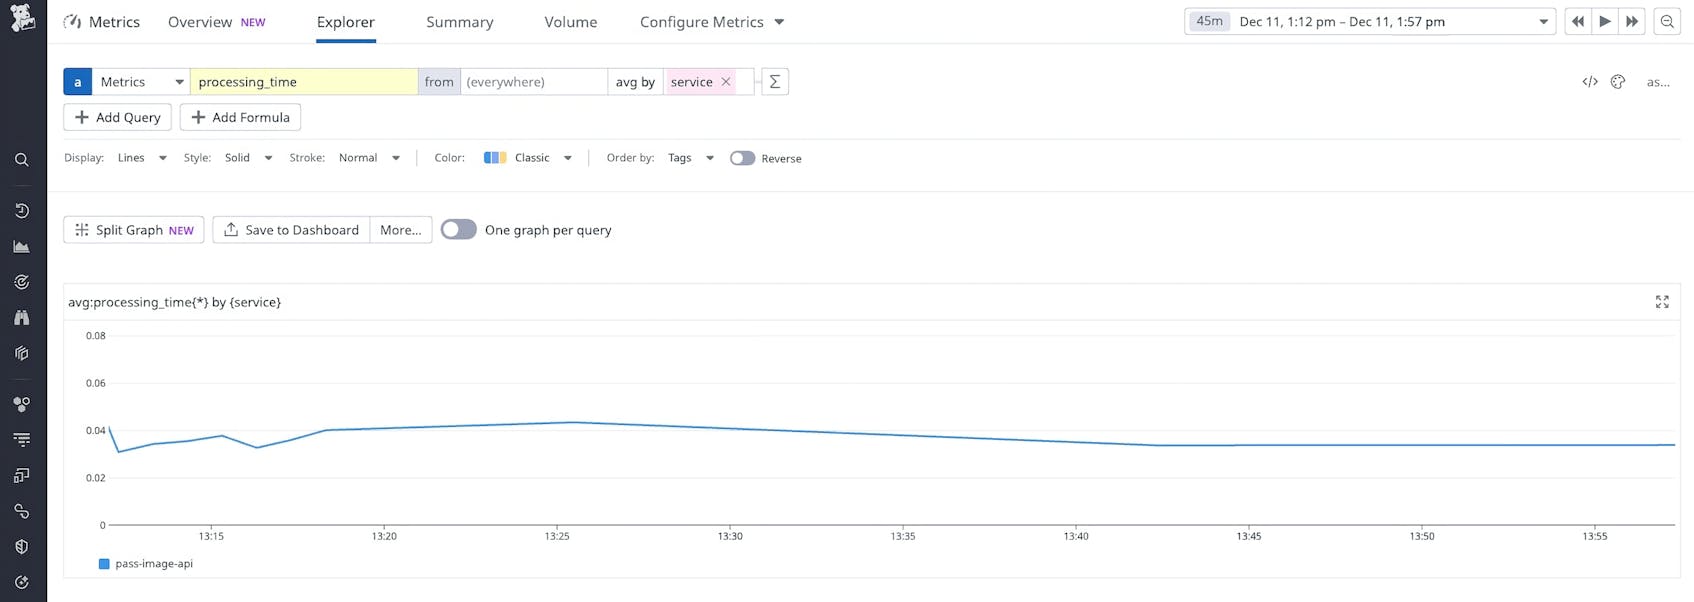
The following screenshot shows how the data generated from this meter can be displayed in Metrics Explorer in the Datadog platform. In this case, our metric tracks the average processing time of our fetch image operation. We can see that this value remains stable over time:
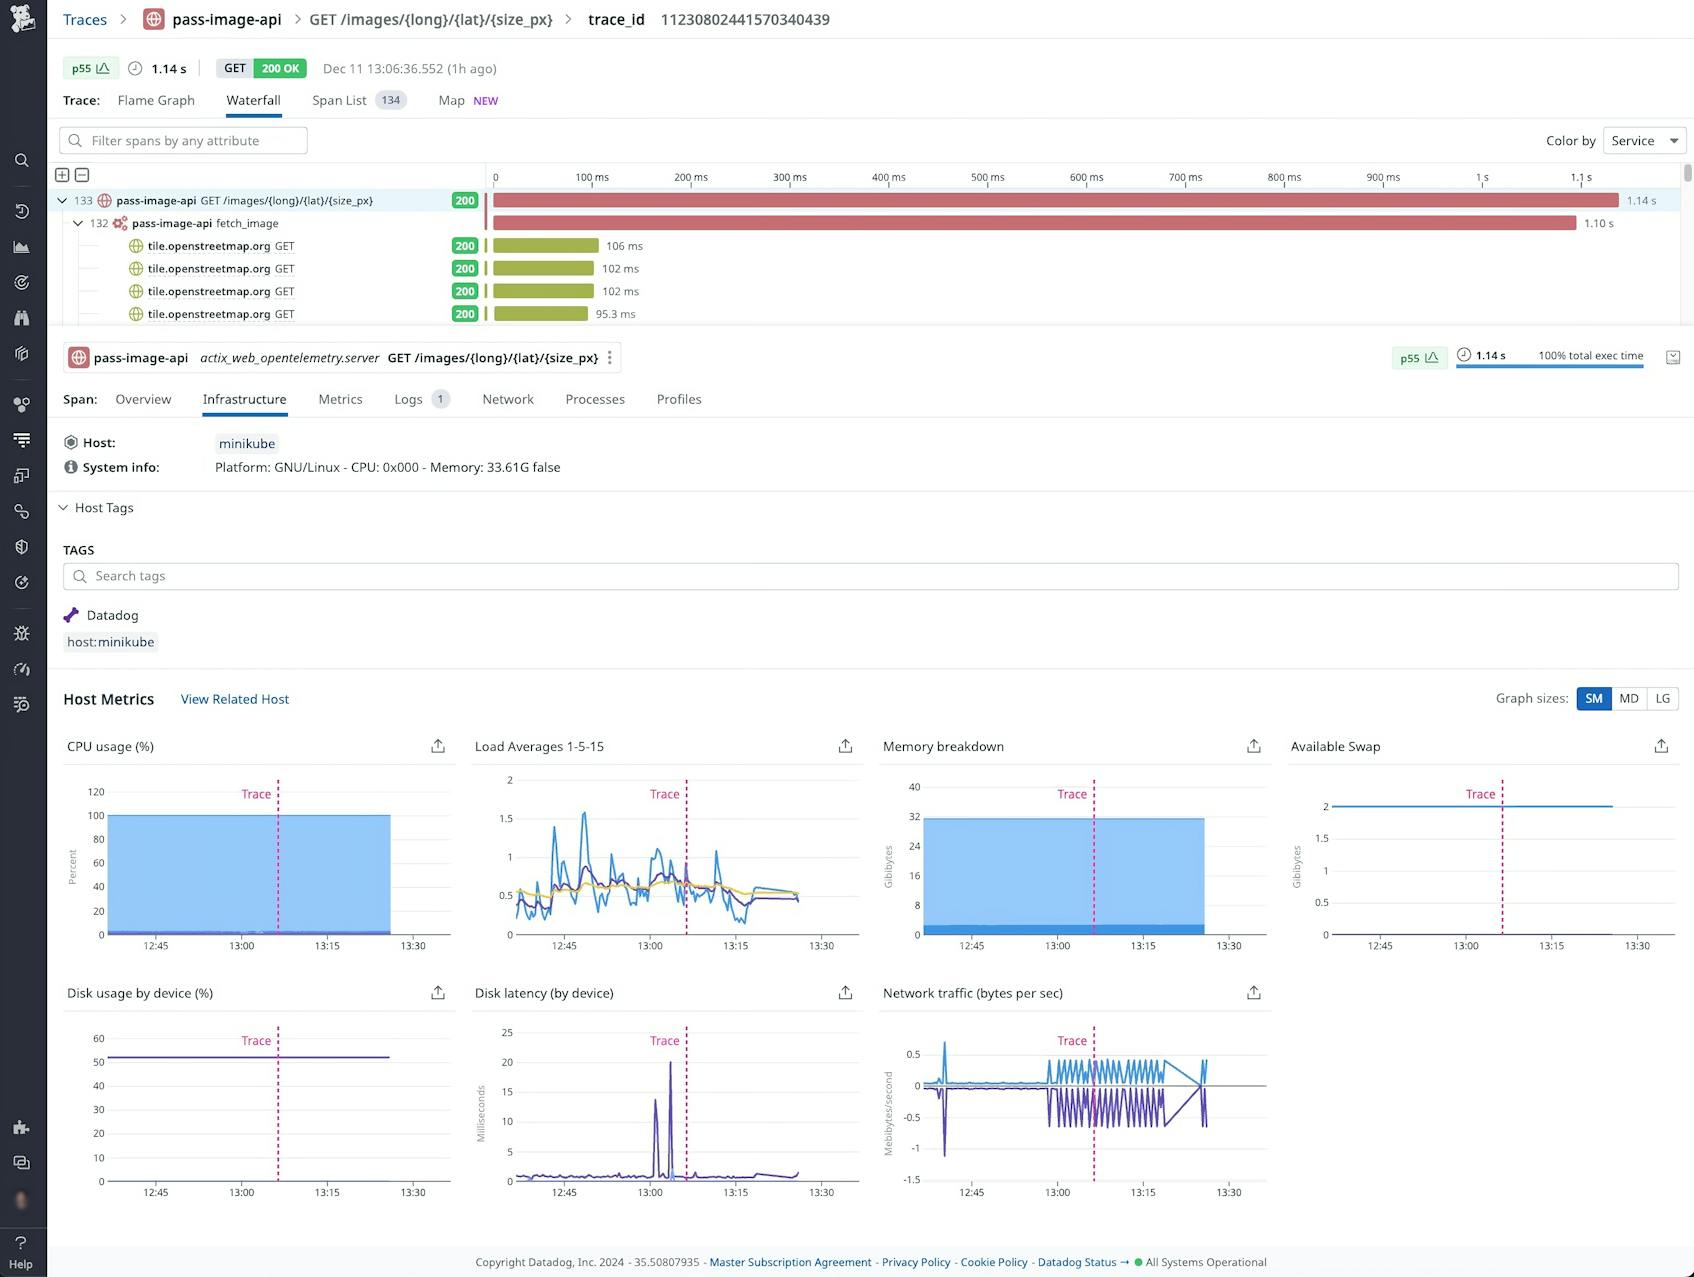
The Datadog Agent also automatically adds, to this metric data, contextual information from the surrounding infrastructure. This contextual data includes telemetry such as host metrics (CPU, memory usage, and disk IO), as well as Kubernetes metrics if the application is hosted in Kubernetes.
The following screenshot displays OTel trace data along with host metrics that are automatically collected from the Agent:
Using the data
At this point, our sample Rust application’s metrics, traces, and logs are now all being pushed into Datadog. From here, we can use the Datadog platform to gain valuable insights from this data about the performance of our application.
In the following screen capture, we show how we can take advantage of the instrumentation established in our sample Rust app (pass-image-api) to investigate errors. As we drill into an individual trace, we can see that the errors (“500 Internal Server Error”) are caused by upstream calls to the OpenStreetMap’s tile service timing out. Thanks to our OTel instrumentation, we are able to quickly identify this as the root cause of the issue, establish its prevalence (since all requests in the window have timed out for the same reason), and begin to formulate a fix.
Use OpenTelemetry and Datadog to monitor your Rust apps
In this guide, we first looked at the different options available for instrumenting a Rust application with OpenTelemetry. We then demonstrated how to configure this instrumentation with our selected mechanism and how to send the collected telemetry data to Datadog—while still maintaining the flexibility to send it elsewhere if desired. Finally, we demonstrated how you can view this data in Datadog to gain insights into your Rust application’s performance and quickly identify, diagnose, and resolve issues.
For more information about using OpenTelemetry to monitor applications with Datadog, see our documentation, or check out our recent blog posts here and here. To learn more about Datadog APM, see our documentation here.
And if you’re not already using Datadog, you can get started with a 14-day free trial.


