GitLab is a DevSecOps platform that helps engineering teams automate software delivery. Using GitLab, teams can easily collaborate on projects and quickly deliver application code with robust CI/CD, security, and testing features.
Datadog’s GitLab integration enables you to monitor your GitLab instances alongside the rest of your infrastructure by collecting GitLab metrics, logs, and service checks. Using the integration, you can gain deep insights into your GitLab environment that enable you to quickly identify roadblocks in your delivery cycle and minimize the downtime spent waiting for your commits to successfully deploy.
In this post, we’ll cover how to:
- Visualize the health of your GitLab environment
- Investigate Gitaly metrics
- Identify bottlenecks in your CI workflow
Visualize the health of your GitLab environment
Once you’ve configured the Agent to collect metrics and logs from GitLab and installed our integration, you can access our out-of-the-box dashboard that displays key data from GitLab and its dependencies, including Rails, Redis, and Gitaly. You can use the dashboard as a launching point to investigate whether the root cause of a build error is related to GitLab or any of its dependencies.
If you encounter errors when running GitLab jobs, the Overview section of our dashboard can give you high-level visibility into the current state of your GitLab environment, including the health of your servers.
GitLab is built on a web application server using the Ruby on Rails framework. When you input a GitLab command on your local machine, it is sent to the Rails web server, where a runner will be assigned to execute it. You can verify that your Rails web servers are online with the Liveness health check, and that GitLab is ready to receive traffic with the Readiness health check. Our integration conducts liveness and readiness service checks for 13 different GitLab dependencies, enabling you to gain granular insights into each service and quickly identify the root cause of errors when they arise.
Once your GitLab telemetry is available in Datadog, you can use it to configure monitors that alert you to issues such as jobs failing when commits are merged or high latency in the Rails job queue (as shown below). Monitors that use data collected from GitLab will automatically appear in the dashboard overview, where you can track their status alongside the health of your greater GitLab environment.
Investigate Gitaly metrics
When GitLab performs any RPC operation to access a Git repository, the request is handled by the Gitaly service. Datadog’s GitLab integration collects more than 80 Gitaly metrics and service checks that can help you identify bottlenecks, such as the number of calls that are rate limited or queued. These metrics can help indicate when you need to increase the number of your GitLab runners or raise your configured concurrency limits to avoid delays and ensure that pipelines continue to run smoothly.
The dashboard also displays the number of live Gitaly endpoints alongside the number of gRPC server messages that have been sent and received. Differences between the number of sent and received messages could indicate dropped or delayed network traffic between GitLab and Gitaly or other performance issues that require investigation.
Spot potential bottlenecks
Identifying and resolving bottlenecks in your CI pipelines is crucial for maintaining a productive development cycle—it keeps your team focused on developing application code rather than waiting for commits to deploy. The GitLab dashboard’s CI Metrics section can inform you of potential bottlenecks in your automated workflow. For example, if you observe a steady flow of pipelines being created, but the creation duration metric is showing a value of zero, this may indicate either that your pipelines did not trigger or that they’re experiencing high latency following their creation (both of which would require investigation).
Alternatively, if you notice a high creation duration despite a low number of pipelines being created, it likely indicates delayed or failed requests somewhere in your pipeline.
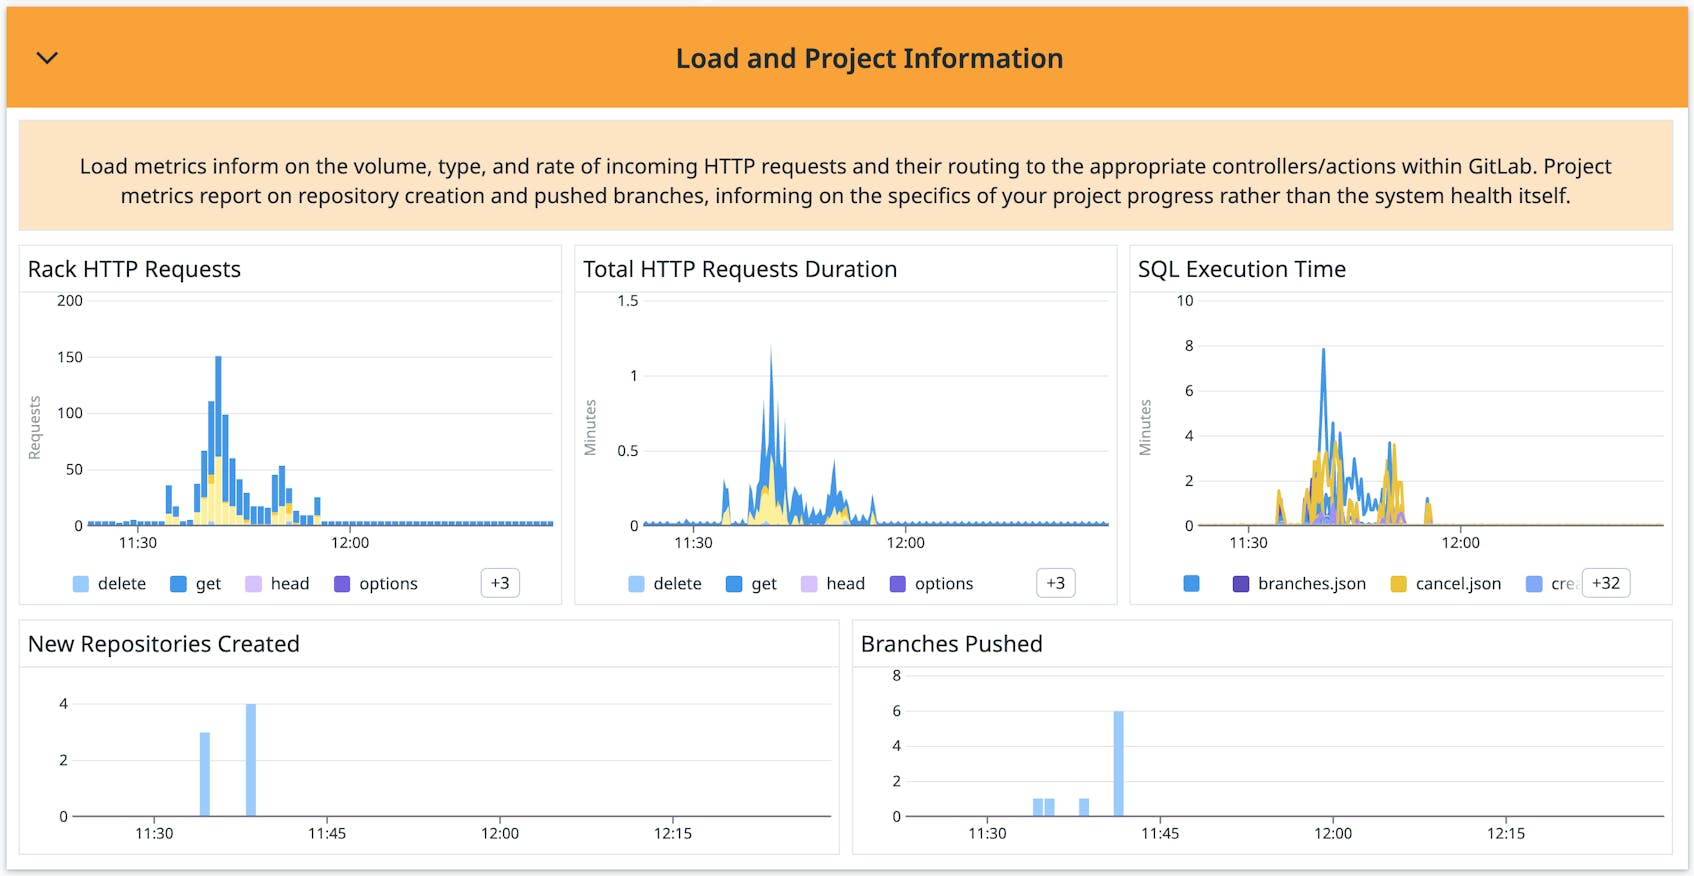
You can then navigate to the dashboard’s Load and Project Information section to investigate and verify that your GET requests to trigger pipelines are being answered with a matching volume of POST requests. A discrepancy between these values indicates that requests to create pipelines have failed, possibly as a result of performance bottlenecks caused by heavy load or insufficient compute resources. In either case, you may need to provision additional runners or increase your memory or CPU allocation in order to resolve the issue.
Get started with GitLab and Datadog
Datadog’s GitLab integration enables you to monitor the health of your pipelines and the various dependencies that drive your continuous development. Check out our documentation to start monitoring your GitLab instances today. For deeper visibility into your CI workflow, Datadog CI Visibility delivers critical insights at each stage in your pipelines and helps you identify flaky tests compromising your builds. You can learn more about CI Visibility in this blog post.
If you don’t already have a Datadog account, sign up for a free 14-day trial today.


