This post is part 3 of a 3-part series on monitoring Azure virtual machines. Part 1 explores the key metrics available in Azure, and Part 2 is about collecting Azure VM metrics.
If you’ve already read our post on collecting Azure performance metrics, you’ve seen that you can view and alert on metrics from individual VMs using the Azure web portal. For a more dynamic, comprehensive view of your infrastructure, you can connect Azure to Datadog.
Why Datadog?
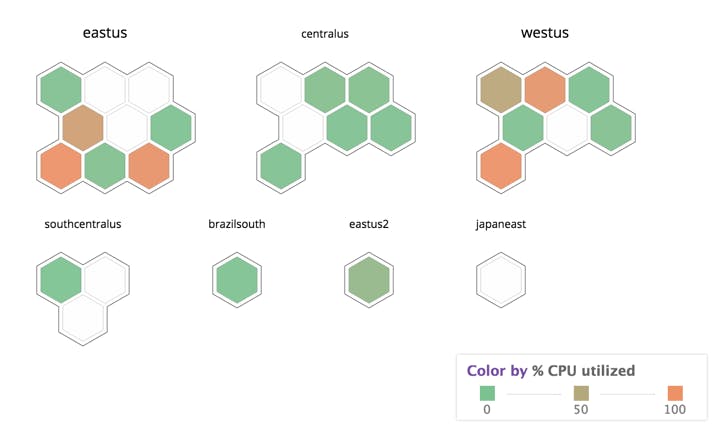
By integrating Datadog and Azure, you can collect and view metrics from across your infrastructure, correlate VM metrics with application-level metrics, and slice and dice your metrics using any combination of properties and custom tags. You can use the Datadog Agent to collect more metrics—and at higher resolution—than are available in the Azure portal. And with more than 850 supported integrations, you can route automated alerts to your team using third-party collaboration tools such as PagerDuty and Slack.
In this post we’ll show you how to get started.
How to integrate Datadog and Azure
As with all hosts, you can install the Datadog Agent on an Azure VM (whether Windows or Linux) using the command line or as part of your automated deployments. But Azure users can also integrate with Datadog using the Azure and Datadog web interfaces. There are two ways to set up the integration from your browser:
- Enable Datadog to collect metrics via the Azure API
- Install the Datadog Agent using the Azure web portal
Both options provide basic metrics about your Azure VMs with a minimum of overhead, but the two approaches each provide somewhat different metric sets, and hence can be complementary. In this post we’ll walk you through both options and explain the benefits of each.
Enable Datadog to collect Azure performance metrics
The easiest way to start gathering metrics from Azure is to connect Datadog to Azure’s read-only monitoring API. You won’t need to install anything, and you’ll start seeing basic metrics from all your VMs right away.
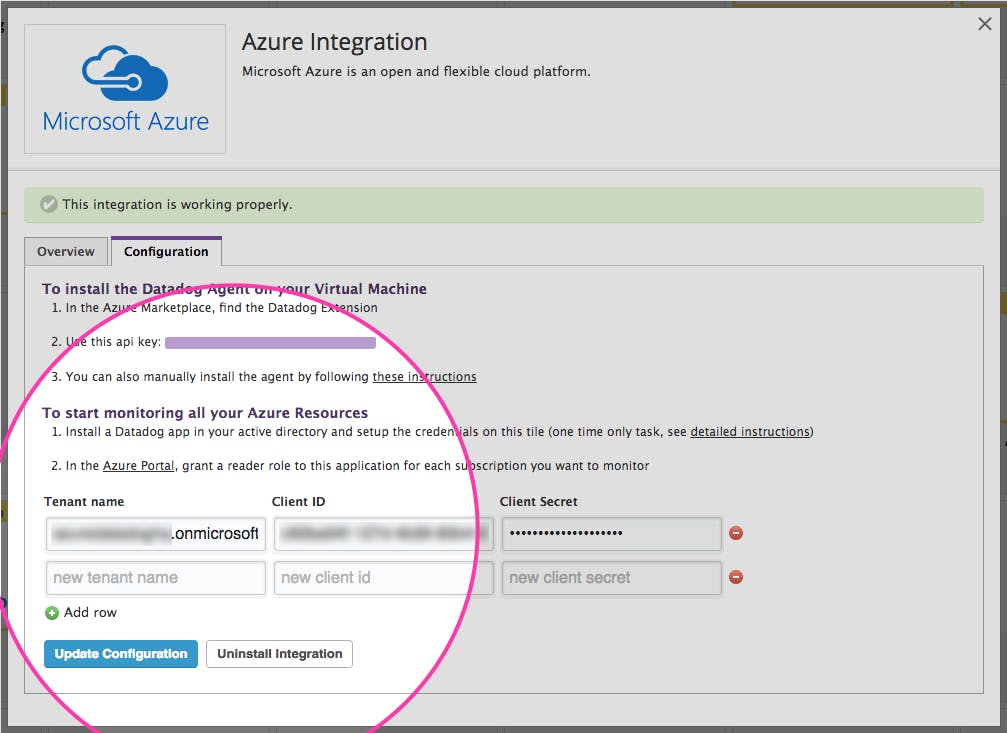
To authorize Datadog to collect metrics from your Azure VMs, simply click this link and follow the directions on the configuration pane under the heading “To start monitoring all your Azure Resources”.
View your Azure performance metrics
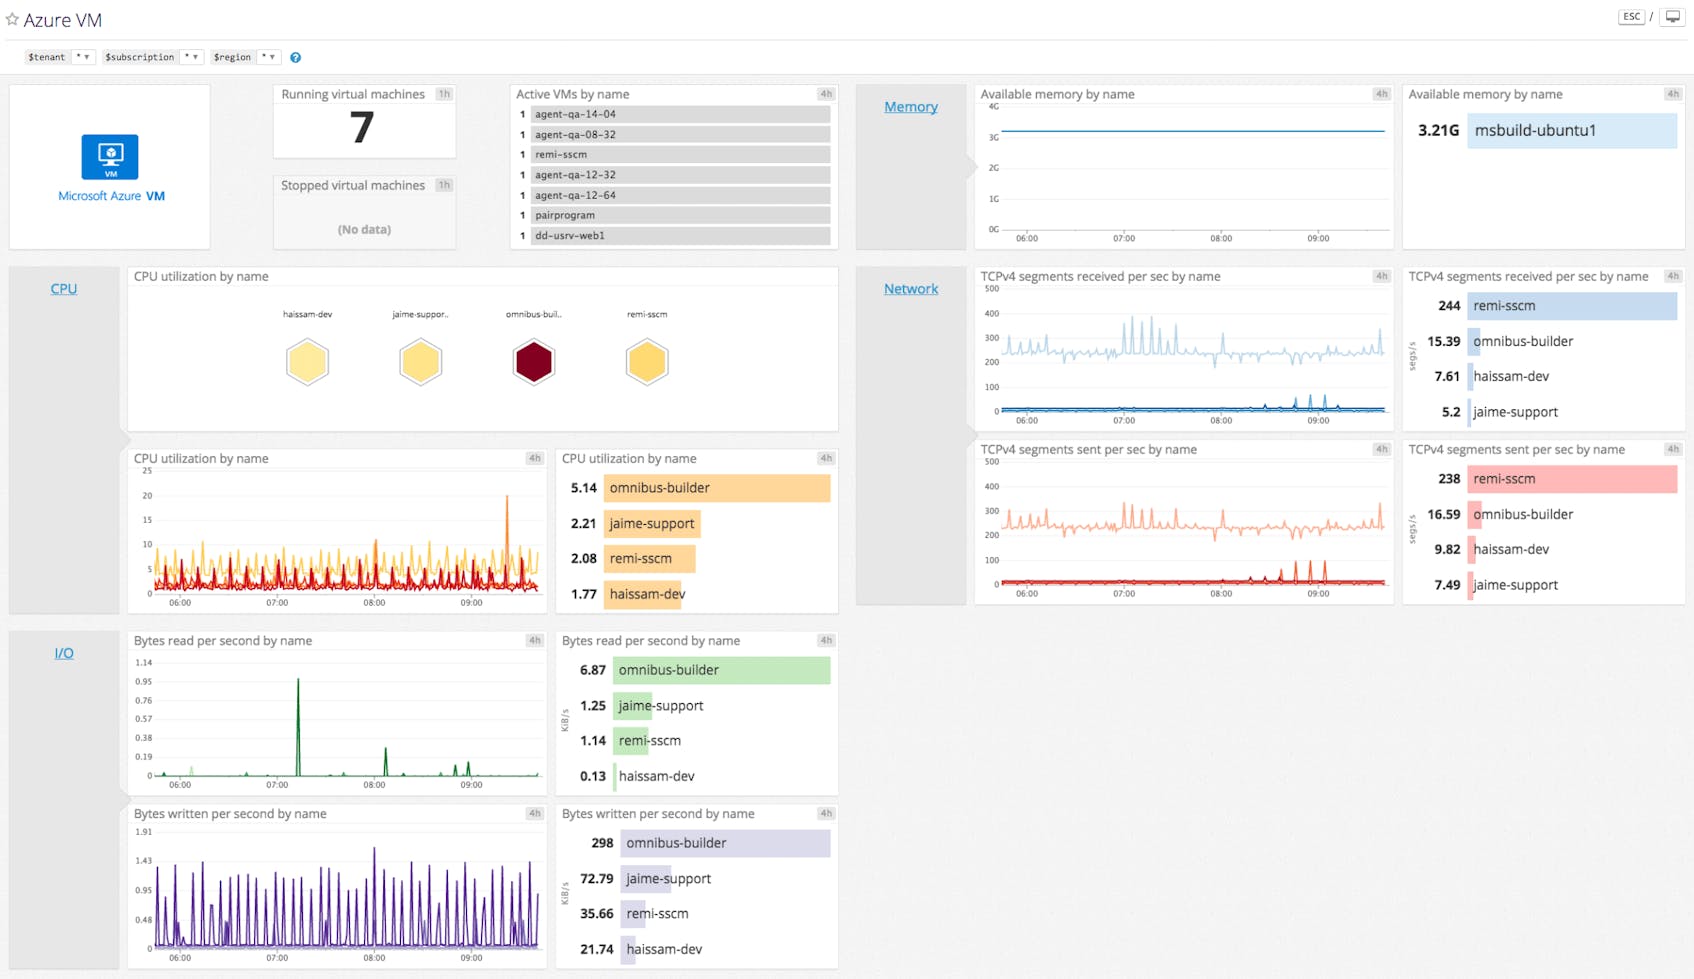
Once you have successfully integrated Datadog with Azure, you will see an Azure VM default screenboard on your list of Integration Dashboards. The basic Azure dashboard displays all of the key CPU, disk I/O, and network metrics highlighted in Part 1 of this series, “How to monitor Microsoft Azure VMs”.
Customize your Azure dashboards
Once you are capturing Azure metrics in Datadog, you can build on the default screenboard by adding additional Azure VM metrics or even graphs and metrics from outside systems. To start building a custom screenboard, clone the default Azure dashboard by clicking on the gear on the upper right of the dashboard and selecting “Clone Dash”. You can also add VM metrics to any custom timeboard, which is an interactive Datadog dashboard displaying the evolution of multiple metrics across any timeframe.
Install the Datadog Agent on an Azure VM
Installing the Datadog Agent lets you monitor additional server-level metrics from the host, as well as real-time metrics from the applications running on the VM. Agent metrics are collected at higher resolution than per-minute Azure portal metrics.
Azure users can install the Datadog Agent as an Azure extension in seconds.
Install the Agent from the Azure portal
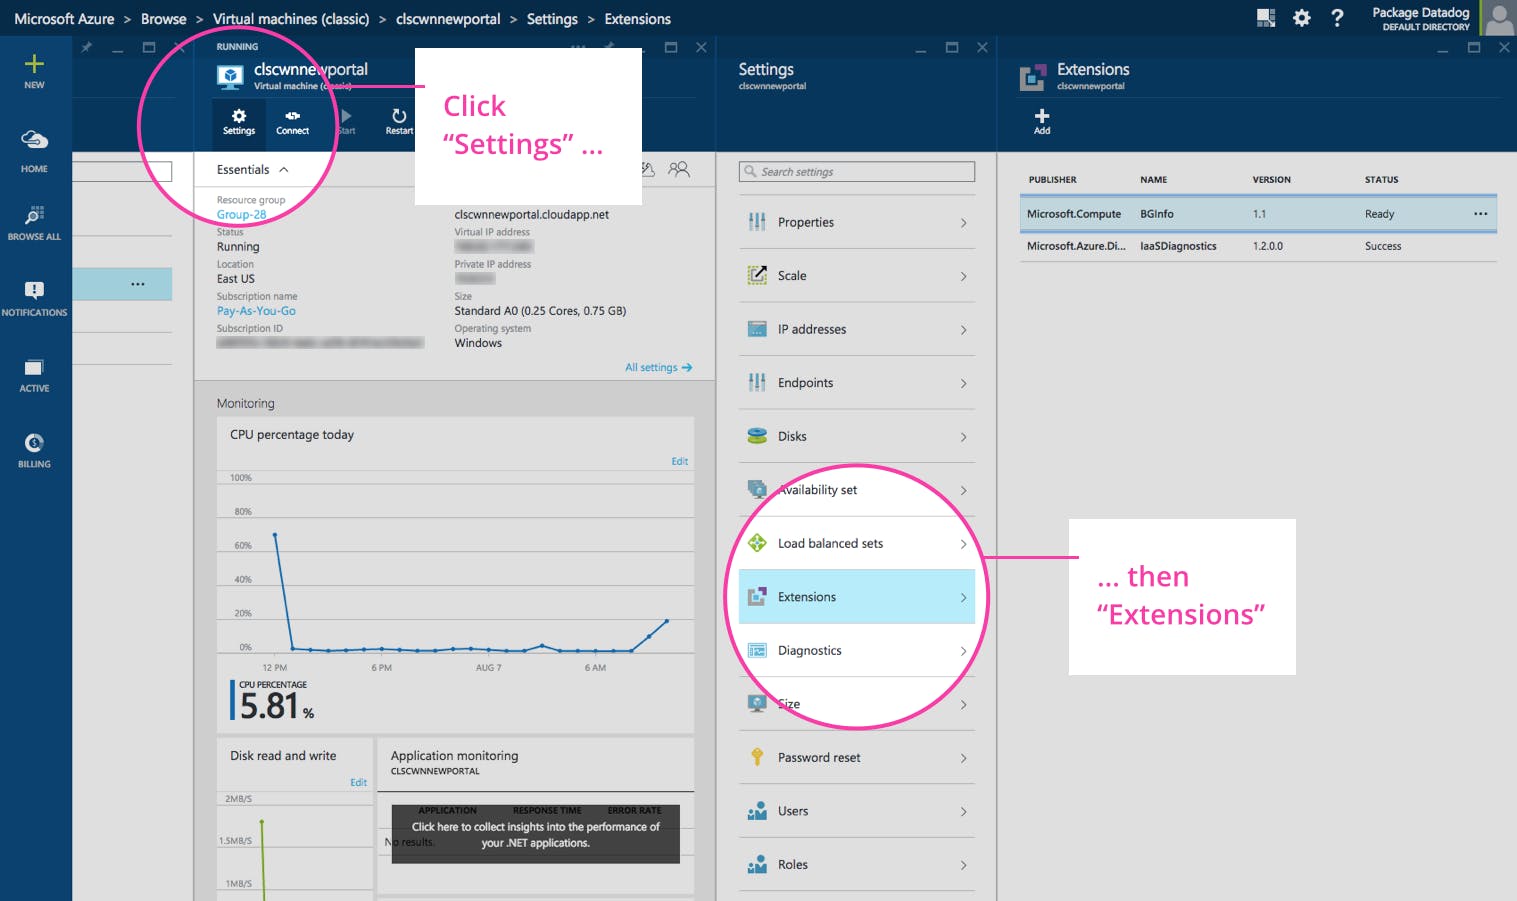
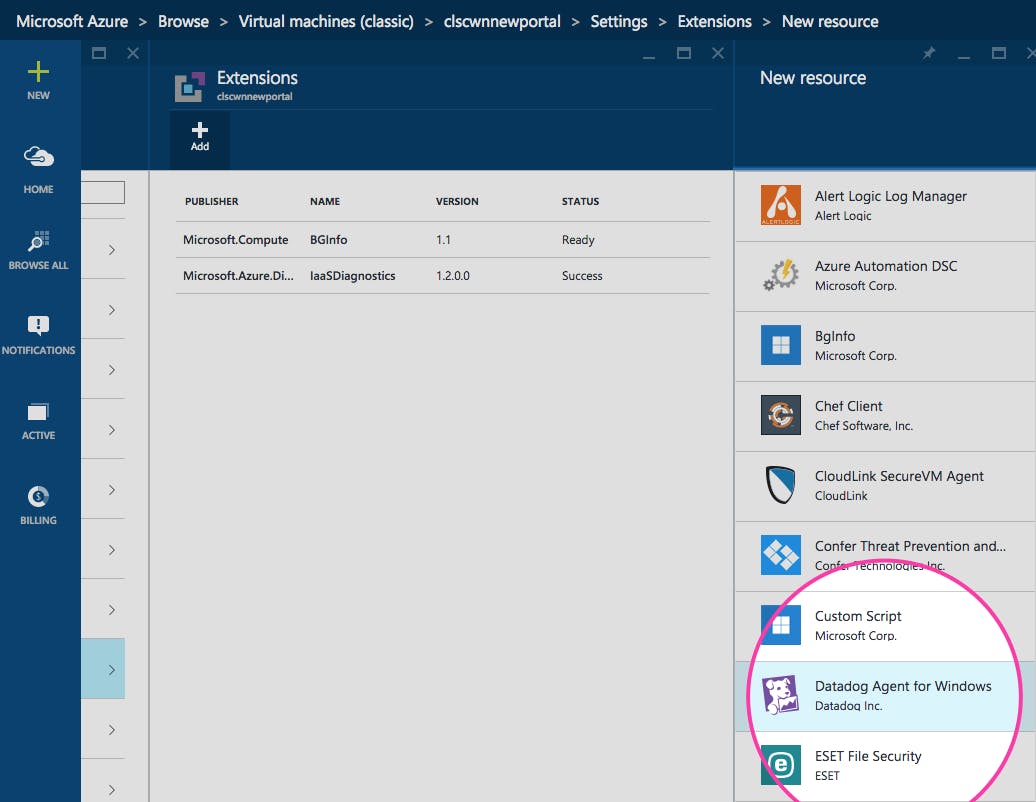
In the Azure web portal, click on the name of your VM to bring up the details of that VM. From the details pane, click the “Settings” gear and select “Extensions.”
On the Extensions tile, click “Add” to select a new extension. From the list of extensions, select the Datadog Agent for your operating system.
Click “Create” to add the extension.
Configure the Agent with your Datadog API key
At this point you will need to provide your Datadog API key to connect the Agent to your Datadog account. You can find your API key via this link.
Viewing your Azure VMs and metrics
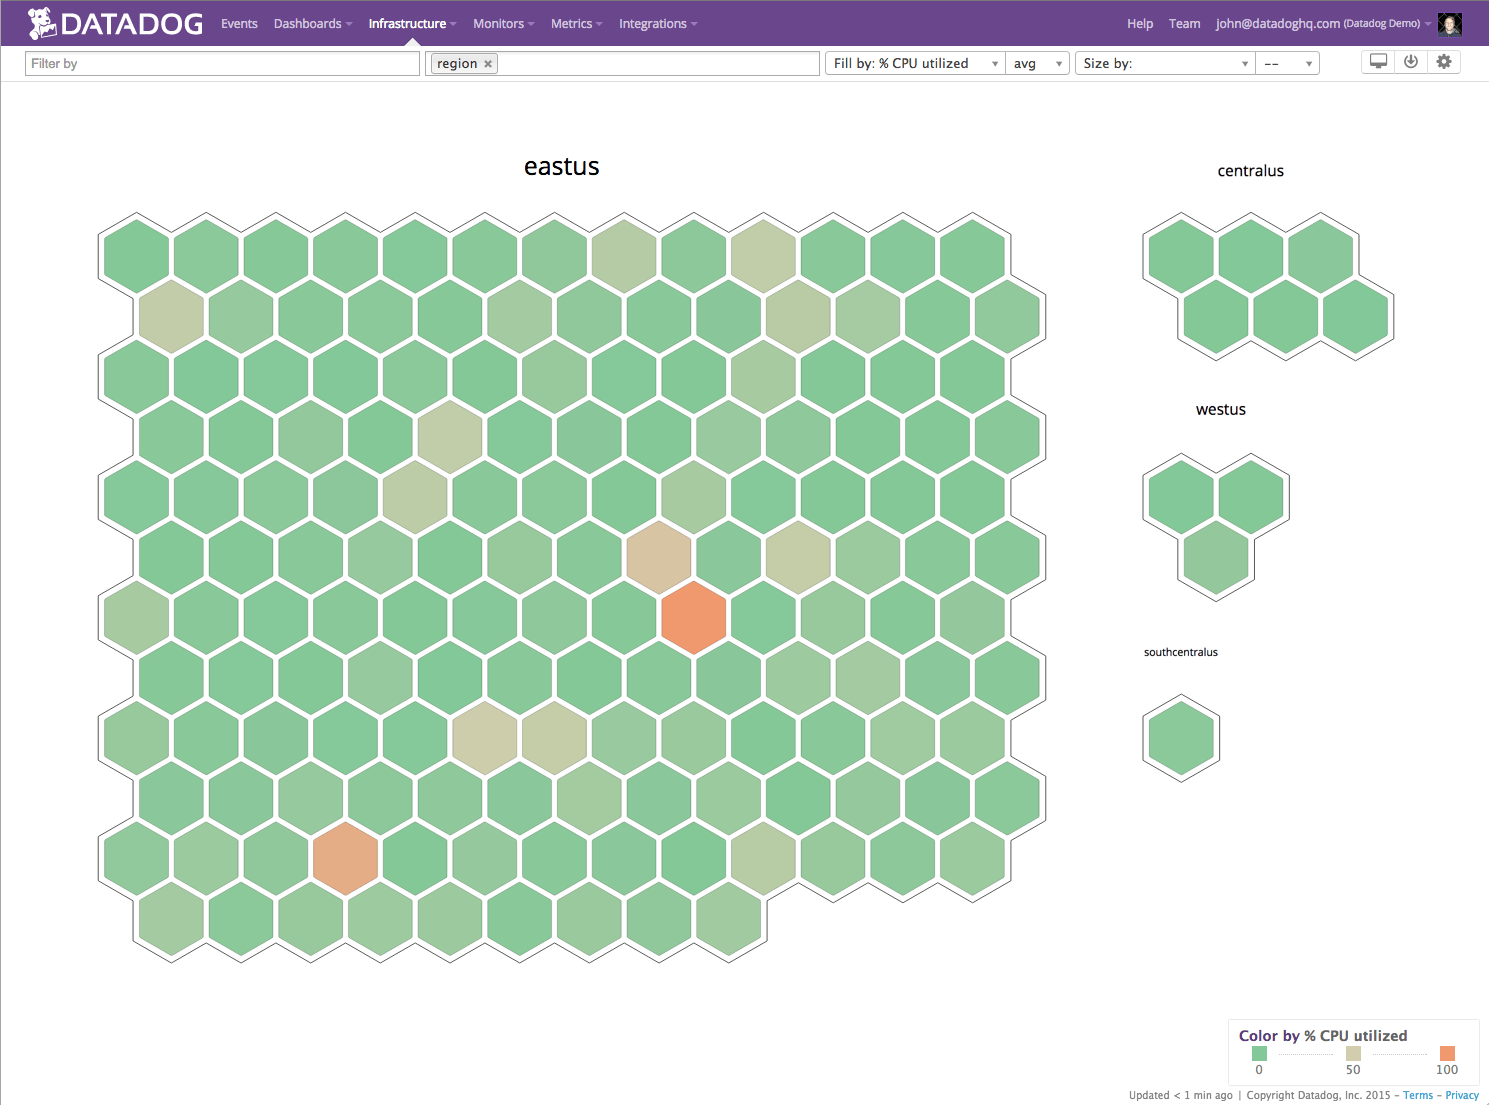
Once the Agent starts reporting metrics, you will see your Azure VMs appear as part of your monitored infrastructure in Datadog.
Clicking on any VM allows you to view the integrations and metrics from that VM.
Agent metrics
Installing the Agent provides you with system metrics (such as system.disk.in_use) for each VM, as opposed to the Azure metrics (such as azure.vm.memory_pages_per_sec) collected via the Azure monitoring API as described above.
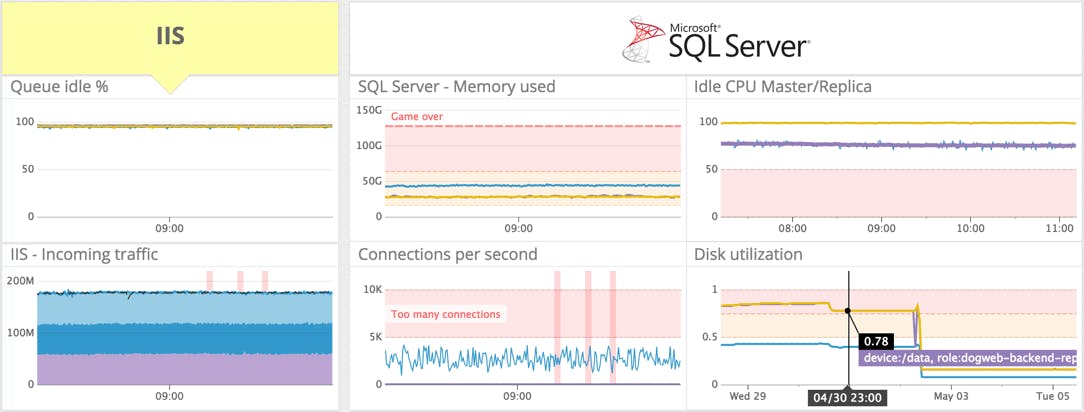
The Agent can also collect application metrics so that you can correlate your application’s performance with the host-level metrics from your compute layer. The Agent monitors services running in an Azure VM, such as IIS and SQL Server, as well as non-Windows integrations such as MySQL, NGINX, and Cassandra.
Conclusion
In this post we’ve walked you through integrating Azure with Datadog so you can visualize and alert on your key metrics. You can also see which VMs are overutilized or underutilized and should be resized to improve performance or save costs.
Monitoring Azure with Datadog gives you critical visibility into what’s happening with your VMs and your Azure applications. You can easily create automated alerts on any metric across any group of VMs, with triggers tailored precisely to your infrastructure and your usage patterns.
If you don’t yet have a Datadog account, you can sign up for a free trial and start monitoring your cloud infrastructure, your applications, and your services today.
Source Markdown for this post is available on GitHub. Questions, corrections, additions, etc.? Please let us know.


