Microsoft Azure DevOps is a leading platform for planning, building, and deploying code. We are excited to announce a new integration with Azure DevOps, which helps organizations see the full picture as they build and deploy dynamic applications. Teams can get new insights into their builds, releases, work items, and code events; understand how deployments impact application performance; and even halt bad updates automatically. Managers can also utilize Datadog-derived metrics for tracking the duration of builds and completed work items—and use this data to improve development and operations workflows.
Once you’ve configured the Azure DevOps integration, you’ll see the events populating live in Datadog. Our preset dashboard also displays an event stream, along with key metrics calculated from those events, including:
- successful build durations per project ID
- failed vs. successful builds
- release events broken down by type, status, and project
- code events and code pushes per project
- work items, broken down by type
- Completed work item durations broken down by severity
This dashboard provides a quick overview of your workflows and pipelines, but it’s just a starting point. You can also clone and customize it to include metrics from any components you’re monitoring with Datadog, including other Azure services.
Get real-time visibility into builds and releases
Once you integrate Azure DevOps with Datadog, you can track your CI/CD pipelines in real time and correlate these events with data from the rest of your infrastructure to effectively investigate issues. Your Azure DevOps events and metrics will automatically include relevant tags, enabling you to scope monitors that notify the right people when needed. For example, if you would like to create a monitor that triggers based on the number of failed builds, you can use the “event_type:build” and “status:failed” tags to filter for this type of event.
You can also overlay events on top of timeseries graphs to visually correlate build and release events with changes in application performance. In the example below, you can easily see how the drop in network traffic occurs in the minutes just after a new build was deployed, giving you a promising lead for your investigation.
Stop problematic deployments in their tracks
Users can even take measures to mitigate bad updates automatically by adding the Datadog Monitors as Deployment Gates extension in the Visual Studio marketplace. Gates inject waiting periods at the beginning (pre-deployment) and/or end of a stage (post-deployment), and define specific conditions that must be verified before the next step of the deployment process can continue. Datadog monitors can be added as both pre-deployment gates or post-deployment gates.
Take an example of a canary deployment that updates an e-commerce website in stages across different regions. To ensure the update was successful before rolling it out to the next region, you might want to check the status of various health indicators in the recently updated region, such as:
- the memory and CPU utilization of hosts in that region
- the number of error logs from your shopping cart application
- the results of an automated browser check, which verifies that the website’s regional endpoint loads quickly and responds correctly to simulated user actions
In Datadog, you could create individual monitors for everything you want to know about, and then combine them with a composite monitor, using simple logic statements to specify a desired combination of monitor conditions. Then, you can set that composite monitor as a gate between the two stages in Azure Pipelines to ensure your deployment will automatically stop if an unhealthy state is detected in Datadog.
However you define the health of your service, using Datadog monitors as gates in Azure DevOps can help you ensure that your deployments go off without a hitch.
Monitor your devops processes
Azure DevOps is not just a tool for build/deploy pipelines—it’s also used as a code repository (Azure Repos), testing toolkit (Azure Test Plans), and team management platform (Azure Boards). With the integration, you can now monitor all of your Azure DevOps workflows in one place, and analyze them to gain new insights into the effectiveness of your developer operations.
Datadog automatically generates metrics from Azure DevOps events (e.g., work item duration, number of code pushes) and tags them with the same metadata as the event. This allows you to track things like the average build time across team sprints, how often releases are abandoned, and the number of code commits and open work items. Monitoring all of this data in Datadog can help engineering and project managers ensure that teams are collaborating effectively.
Set up the integration in minutes
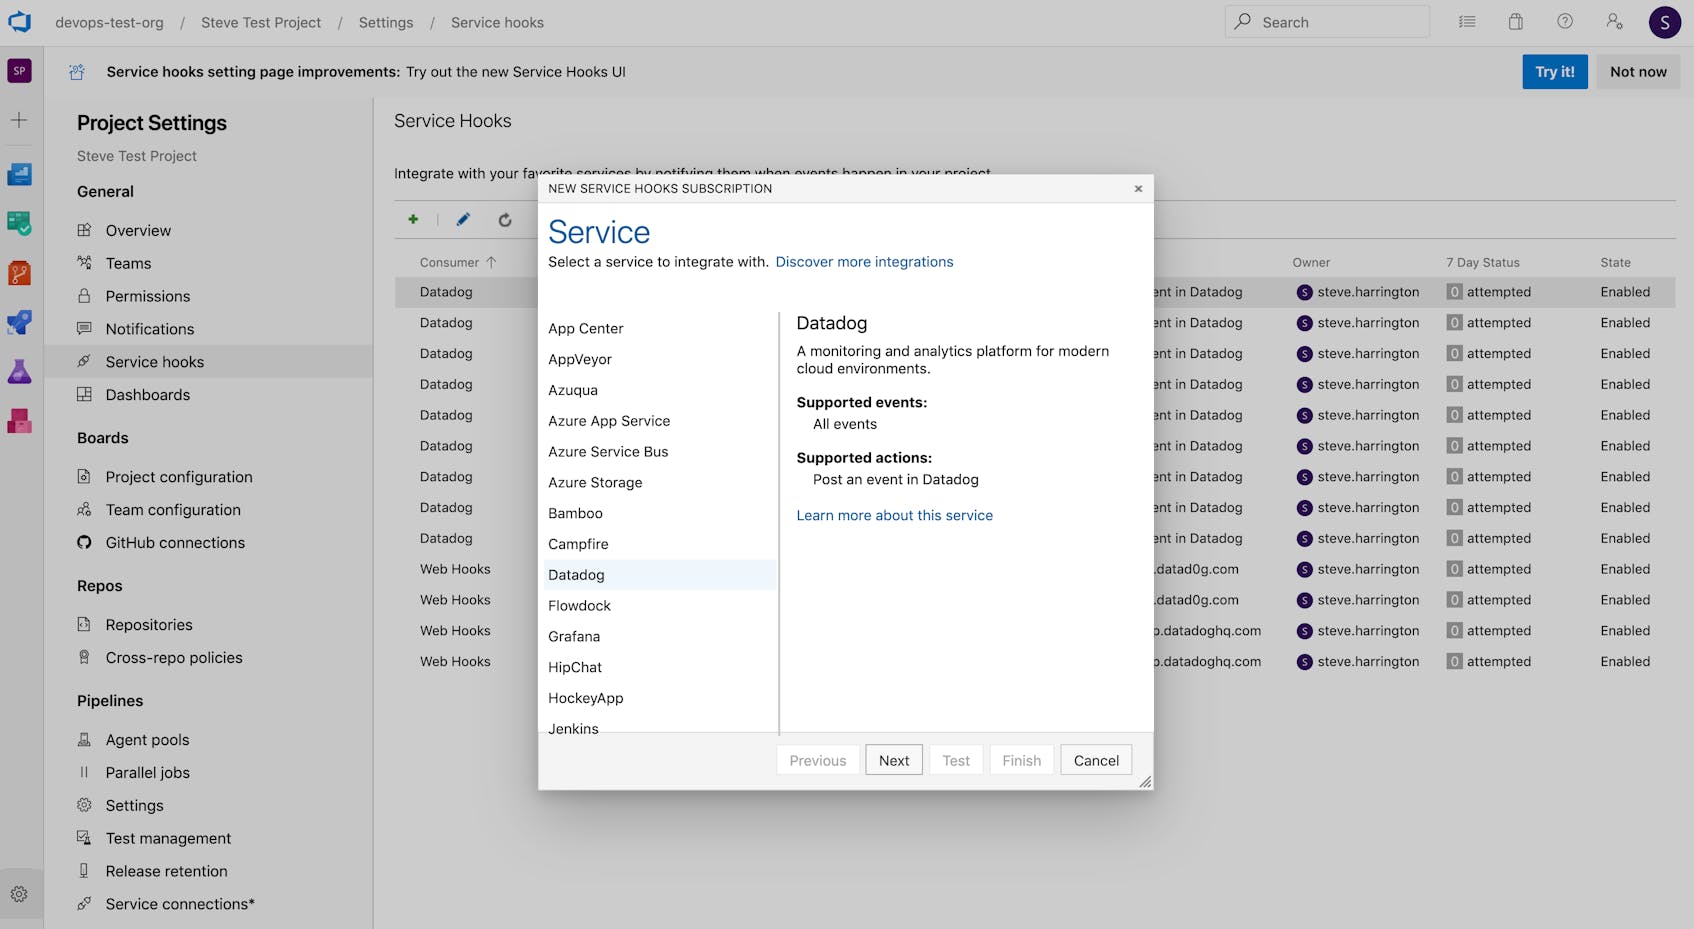
We’ve worked with Azure DevOps to make the setup process simple. Start by selecting Datadog from the list of built-in integrations in the Service Hook configuration page of the Azure DevOps portal. From there, just select the event types you want to know about and provide your Datadog API key. This will configure service hooks in Azure DevOps to trigger automatically whenever events of interest take place, so you can monitor them in Datadog.
To enable Datadog monitors to be added as gates in Azure Pipelines, first install our open source extension in your Azure DevOps org. Then, just add a Datadog service connection in your project.
Get started today
The Azure DevOps integration is generally available, so Datadog customers can get started immediately. If you’re not yet using Datadog, start a free 14-day trial to get comprehensive insights into the performance of your applications and developer operations.


