Microsoft Azure is a major cloud provider that is especially popular among enterprise companies. Though its market share is much smaller than that of Amazon Web Services (AWS), more than 66 percent of Fortune 500 companies use Azure, and its adoption numbers are growing rapidly.
With over 850 integrations, Datadog makes it easy to monitor every piece of your infrastructure, no matter which platform you choose. And now you can monitor your Azure App Service applications right alongside your Azure SQL Databases and the rest of your hosts, applications, and services.
What is Azure App Service?
Azure App Service is a platform-as-a-service for building web, mobile, and business applications. App Service abstracts away the underlying infrastructure (network, machines, OS, and supporting applications) so that developers can focus on the code rather than the execution environment and the maintenance that entails. App Service applications come in four flavors: Web, API, Mobile, and Logic, and Datadog collects metrics from all of them.
App Service integrates with several Azure services you may already be using, including Azure VMs and Azure SQL Database. Like other Azure services, Azure App Service is designed for easy scaling and management. Whether you need to scale up or scale out, increasing availability is only a few clicks away.
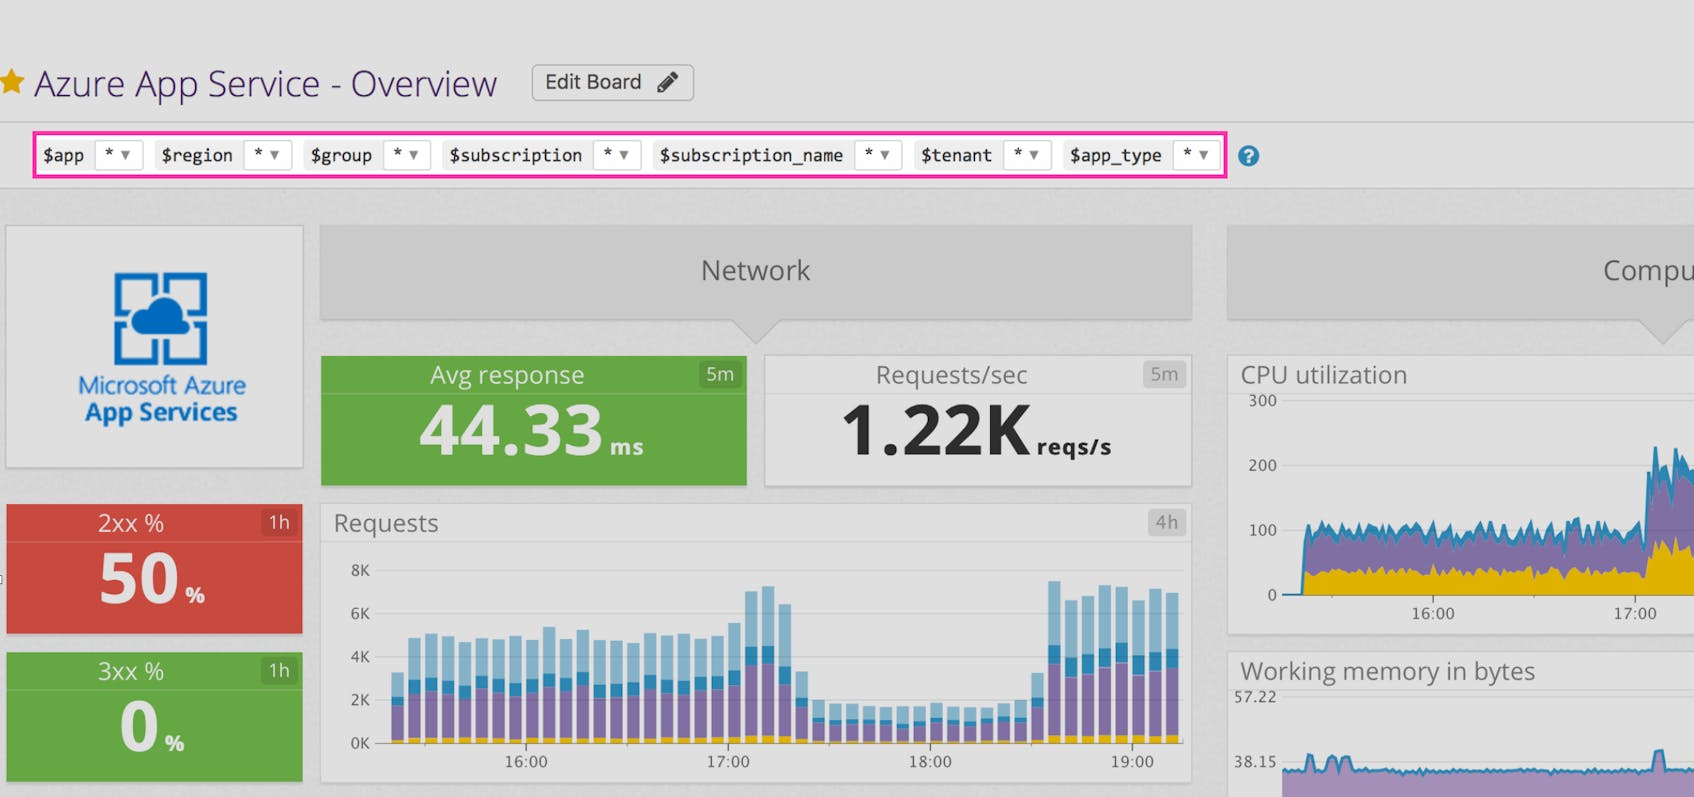
As soon as you enable the App Service integration in Datadog, you’ll start to see your metrics in an out-of-the-box dashboard like the one above. On that dashboard you can monitor incoming requests to your applications, track the HTTP response codes returned, and more.
Going Agentless
Monitoring Azure App Service activity and performance is a bit different than monitoring a traditional application server. As the App Service abstracts away the underlying hardware, with no “host” in the traditional sense, monitoring presents a unique challenge.
A lack of visibility into the goings-on of the underlying host makes it tricky to determine the cause of application failures and errors. And with applications running on multiple platforms, either in Azure, on-prem, or elsewhere, correlation becomes all but impossible.
For example, a sudden spike in the number of 5xx errors could be caused by programming errors, an overloaded application, or a slow database connection (causing timeouts). Determining the root cause of the surge in errors becomes very difficult without being able to correlate data from your databases, frontend applications, and backend services.
Peering behind the cloud
With our new Azure App Service integration, you can alert on and graph App Service metrics, and put them in context with data from the rest of your infrastructure, whether it’s in Azure or elsewhere. We’ve also rounded out our Azure integrations with support for Azure SQL Database and Azure VMs.
Metrics!
Once you’ve enabled the integration, you’ll start to see the following metrics roll in from your Azure applications:
- requests served
- application response time
- network throughput
- RAM and CPU usage
- HTTP response codes
With all of your metrics—from Azure or otherwise—in Datadog, you can correlate across systems and services when performing root cause analysis.
Distill with tags
Monitoring one or two applications is straightforward—but with five or more applications, getting a clear view of each application’s performance can require some drilling.
Datadog’s use of tagged metrics lets you slice and dice your App Service applications into any view you like. With tags, you can track, say, resource usage by Azure subscription or resource group, or compare the number of requests to your applications by region. And it doesn’t stop there—your other Azure resources are tagged with the same information, so you can slice and dice across your Azure infrastructure, to arbitrary granularity.
Our integration tags all of your App Service metrics with the application name, region, and Azure Resource Manager information, such as resource group.
Above and beyond standard metrics
Of course, in addition to general-purpose App Service metrics, you may want to monitor metrics specific to your application. Datadog comes with support for custom metrics, allowing you to increase visibility into your App Service applications.
Custom metrics can be submitted via API directly from within your application. Once submitted, custom metrics can be added to your dashboards, right alongside your App Service metrics.
Preparing for liftoff
If you haven’t already integrated Azure with Datadog, take a few minutes to do so before continuing.
Then, just turn on the integration and add Azure App Service to the ever-growing list of technologies you can monitor easily and collaboratively. If you’re new to Datadog, get started with a 14-day trial.


