

Infrastructure changes often trigger incidents, but troubleshooting these incidents is challenging when responders have to navigate through multiple tools to correlate telemetry with configuration changes. This lack of unified observability leads to longer mean time to resolution (MTTR), greater operational stress, and ultimately, negative business outcomes.
Datadog now streamlines incident troubleshooting by making critical infrastructure information accessible to you from within dashboards and monitor status pages, the starting points of a typical investigative workflow. From these locations, you can now open a Resource side panel by clicking on any timeseries graph widgets, enabling you to access detailed telemetry, monitor insights, and—through the new Recent Changes tab—inspect configuration changes. Seeing all this information consolidated in the typical contexts in which you perform infrastructure troubleshooting makes it much easier for you to identify probable root causes of infrastructure issues and take action to remediate them sooner.
In this post, we’ll lead you through an end-to-end troubleshooting workflow and cover how you can:
Easily access infrastructure insights in context
Imagine a scenario, for example, in which you support a photo-sharing application, and a monitor alert fires and pages your SRE team. The alert informs you that there are an elevated number of HTTP 500s (server errors) from an Elastic Load Balancer (ELB). You declare an incident and start investigating.
First, you open a dashboard linked to the monitor alert and identify (by hovering over the errors) that the spike in HTTP 500 errors for the ELB is originating from one target EC2 instance.
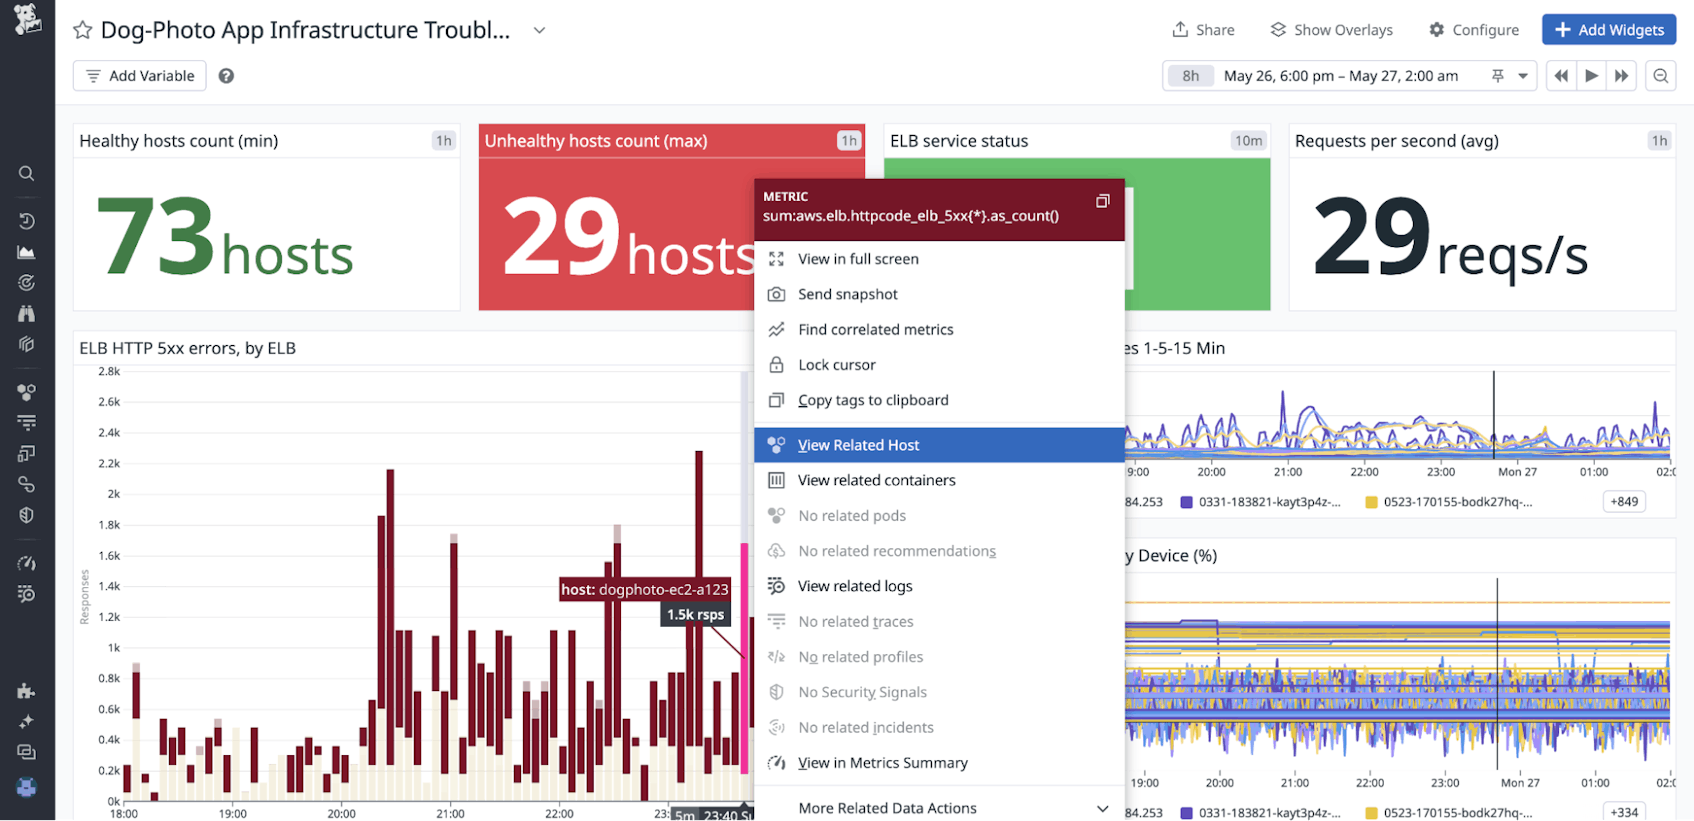
To investigate further, you click on the EC2 instance in the HTTP 500 error graph and then select View Related Host on the context menu that opens. A host-centric Resource side panel opens to help you correlate information about metrics, traces, logs, processes, containers—and now also monitors. By clicking on the Monitor Status bar, you can open the Monitors side panel to view the complete list of enabled monitors, their statuses, and relevant metadata such as tags. This information in the Monitors side panel gives you consolidated insights into any ongoing active alerts, allowing you to get a broader view over the extent of impact.
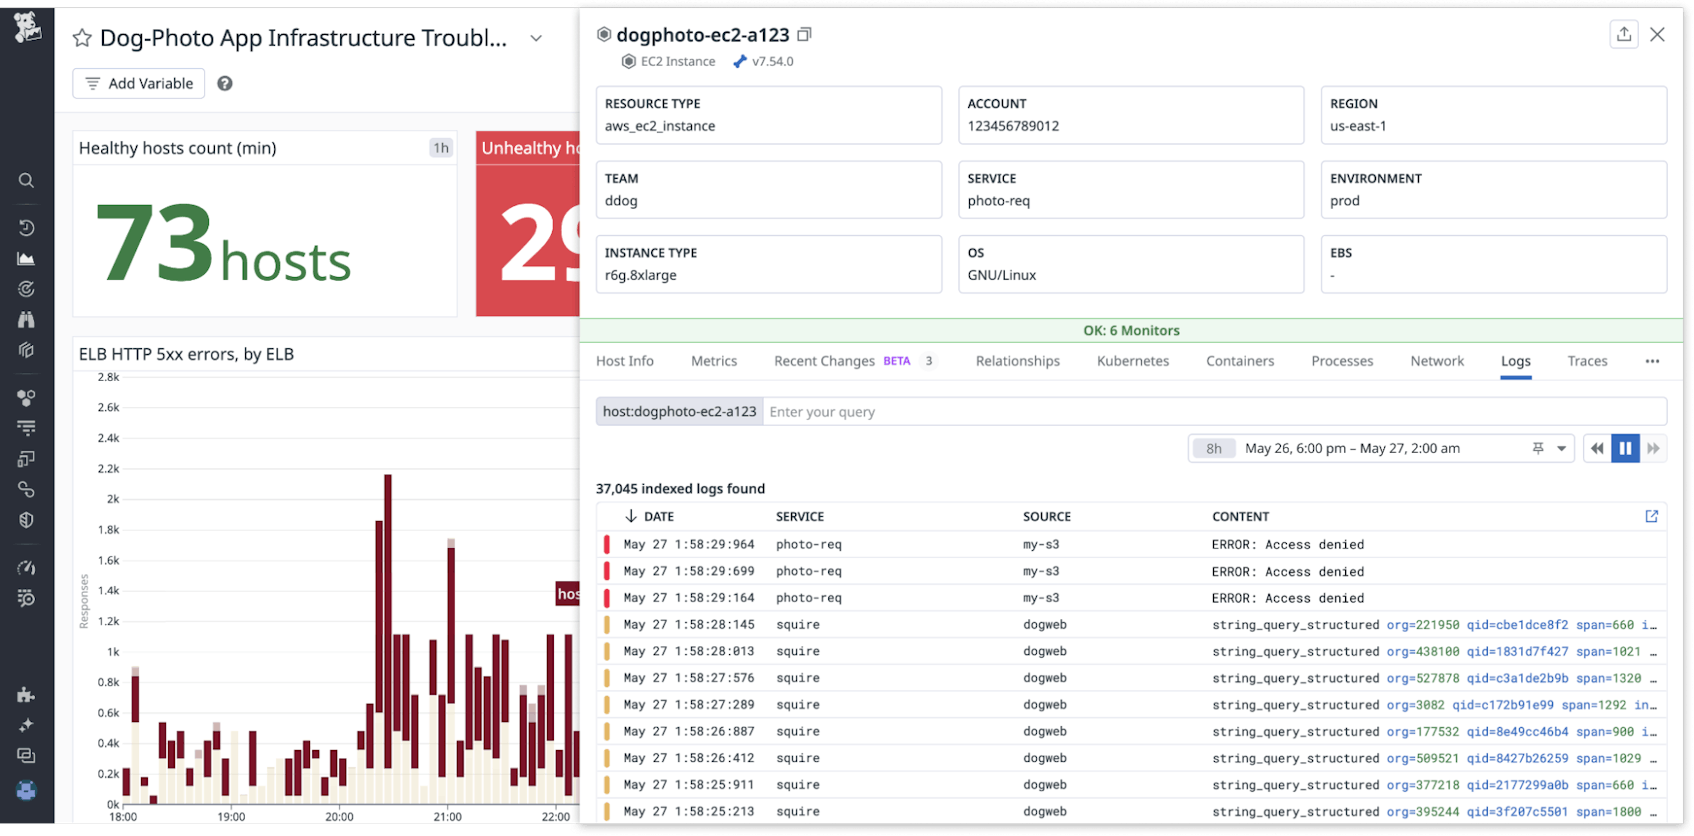
In this example, the Monitor Status bar reveals that six other monitors on this host are in an OK status, indicating this host is healthy. Next, by clicking on the Logs tab, you can see some error logs revealing that the EC2 instance is failing to access an S3 bucket. Because all this information is available in the Resource side panel from your dashboard, you are able to quickly assess that this S3 bucket access issue is probably related to the active incident you were paged for.
Identify probable root causes with Recent Changes
After learning about the EC2 instance’s access issue with respect to the S3 bucket, you wonder what change might have caused this problem. To investigate further, you can now navigate to the Recent Changes tab in the side panel, which shows you the configuration changes from your cloud providers. This feature (currently available in Preview) allows you to see and review a 7-day history of configuration changes for any resource in the Resource Catalog inventory.
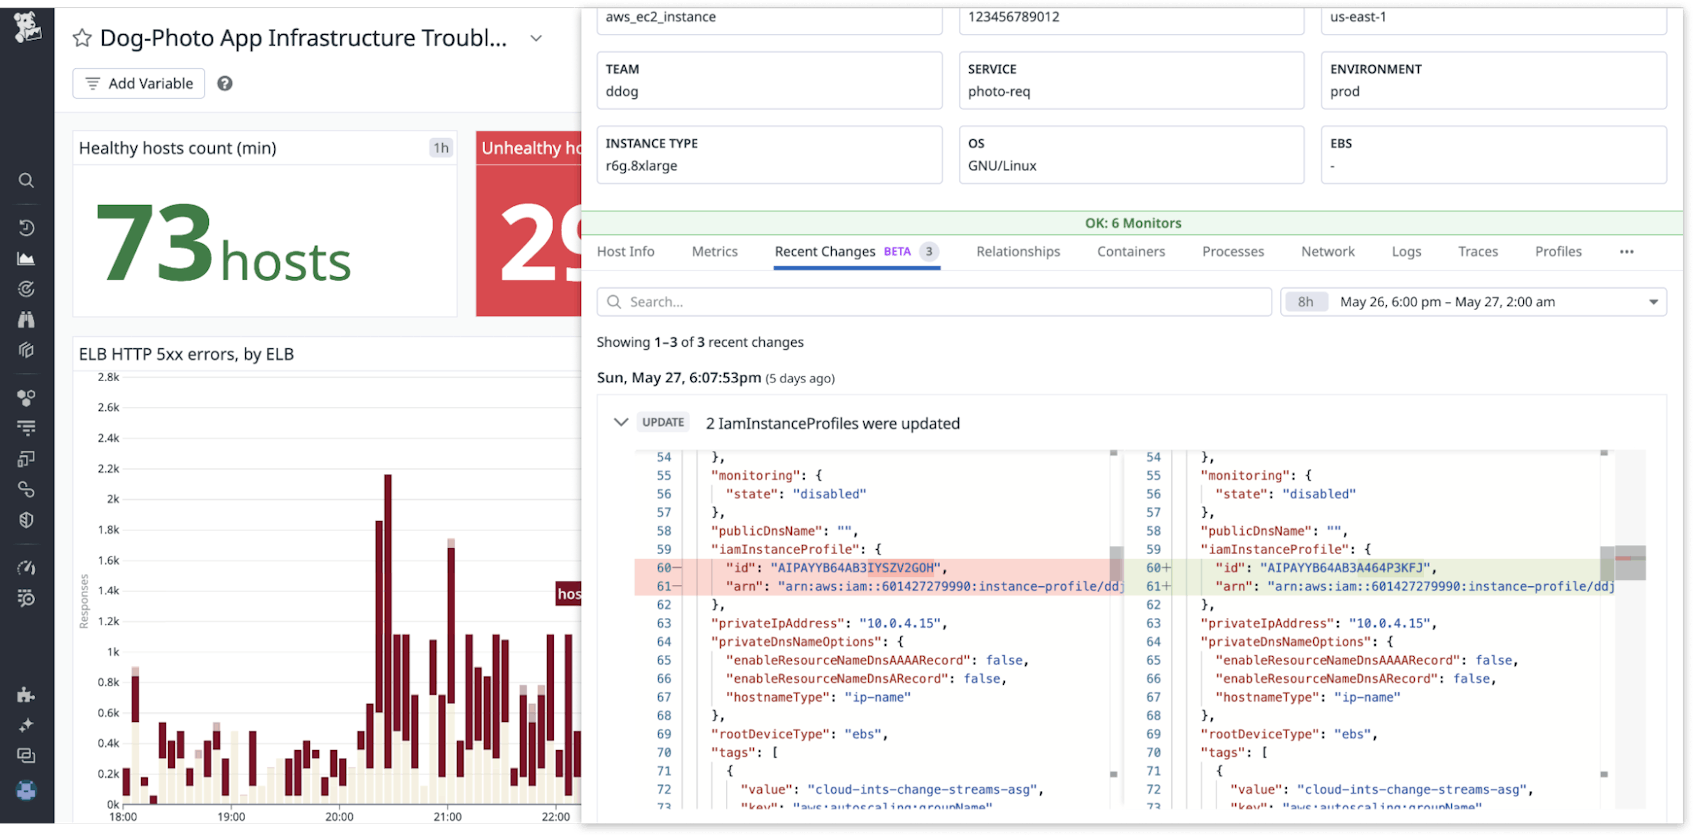
In our investigation above, the associated host’s Recent Changes shows that there was one recent change made to this EC2 instance. When you expand to see the side-by-side configuration differences applied in the most recent change, you observe a change to the IAM role attached to the EC2 instance. This information allows you to determine a probable root cause of the incident: This IAM role change likely restricted the EC2 instance’s access to the S3 bucket and triggered the monitoring alert you were paged for.
Armed with this knowledge, you choose to roll back this change via Terraform. Within a minute of deploying the fix, you can confirm that the rollback was successful after observing a new change automatically appear in the Recent Changes tab. In addition, access errors have stopped appearing in the logs.
From the error graph of the dashboard, where you started, you can also validate that HTTP 500 errors have returned to normal levels. You mark the incident as resolved.
Streamlined troubleshooting
You can now readily access host telemetry, monitor insights, and configuration changes in a single side panel view. These side panels, which can be invoked from your dashboards and monitor status pages, help you stay within the context of your typical troubleshooting workflow and reduce the time needed to identify and resolve issues.
To start viewing infrastructure insights, you can enable resource collection for your cloud accounts. And to start troubleshooting with Recent Changes, simply sign up for the Preview and follow the instructions in our documentation.
If you’re not yet a Datadog user, you can sign up for a 14-day free trial today.
