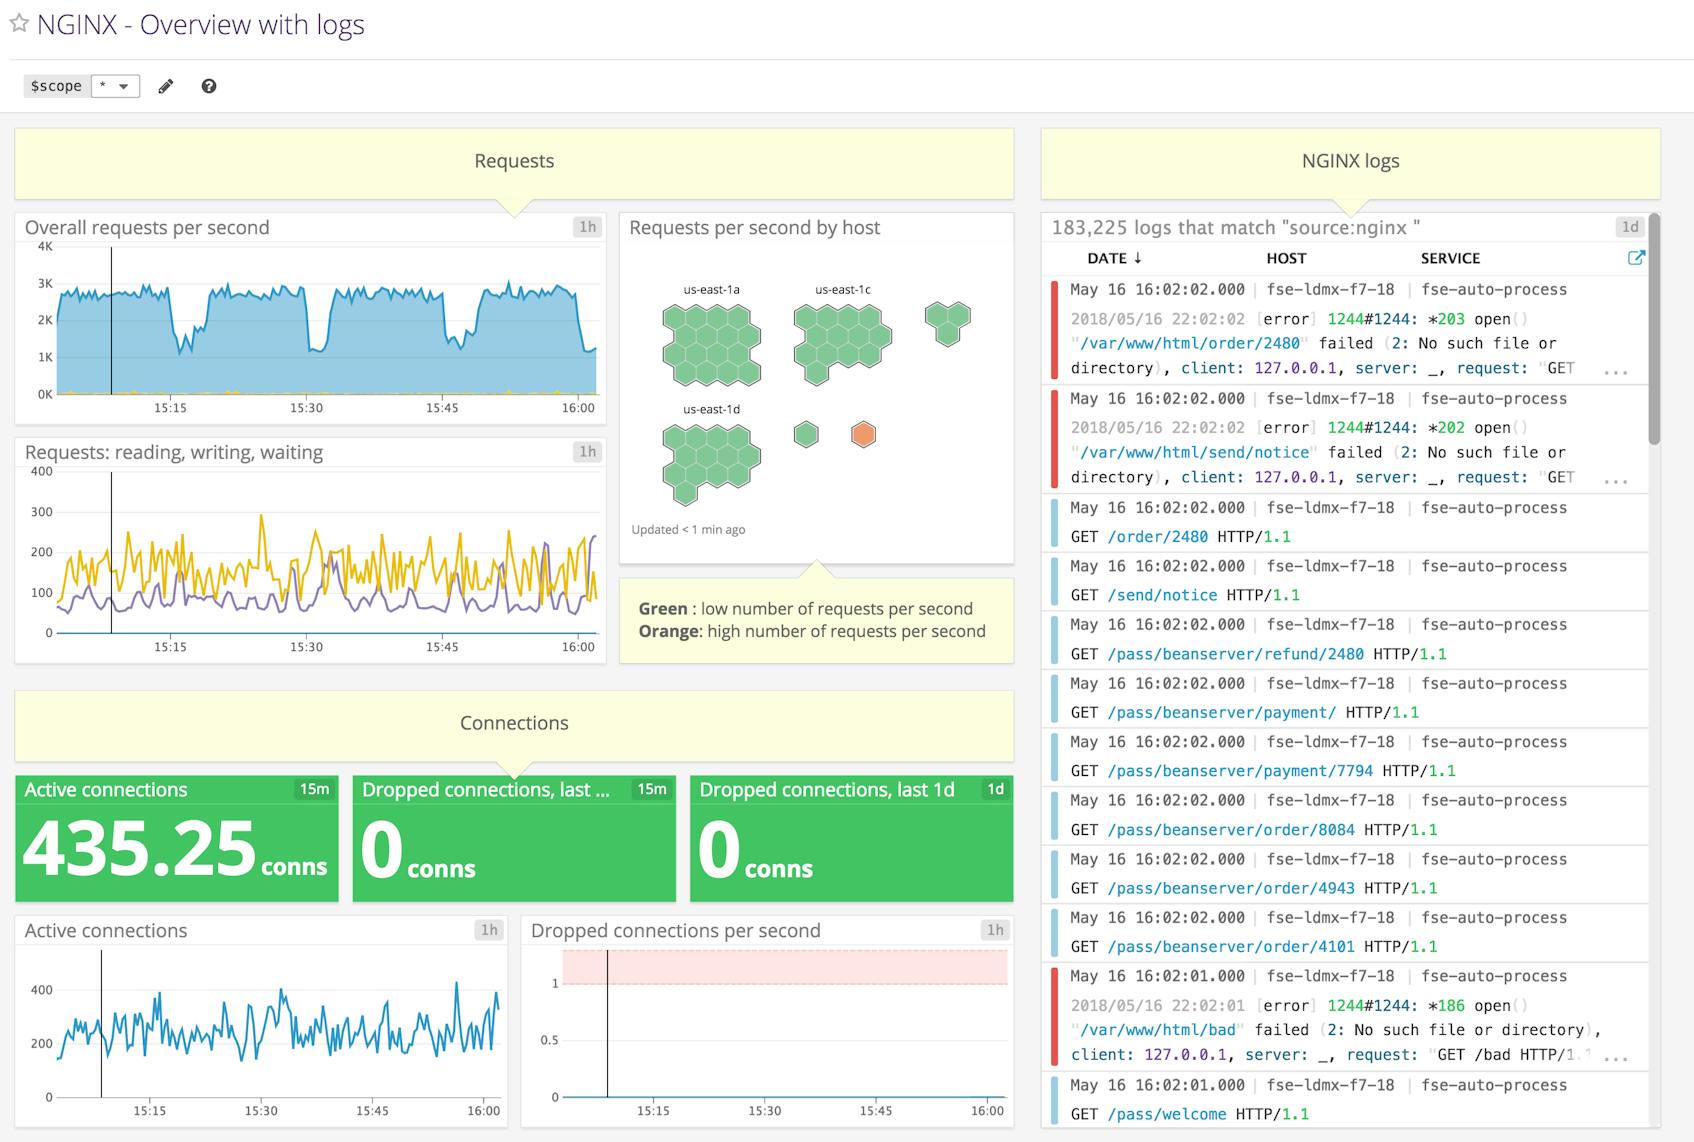
If you’ve already read our post on monitoring NGINX, you know how much information you can gain about your web environment from just a handful of metrics. And you’ve also seen just how easy it is to start collecting metrics from NGINX on ad hoc basis. But to implement comprehensive, ongoing NGINX monitoring, you will need a robust monitoring system to store and visualize your metrics and logs, and to alert you when anomalies happen. In this post, we’ll show you how to set up NGINX performance monitoring and log collection in Datadog so that you can use customizable dashboards like this:
Datadog allows you to build graphs and alerts around individual hosts, services, processes, metrics—or virtually any combination thereof. For instance, you can monitor all of your NGINX hosts, or all hosts in a certain availability zone, or you can monitor a single key metric being reported by all hosts with a certain tag. This post will show you how to:
- Monitor NGINX performance metrics on Datadog dashboards, alongside all your other systems
- Send NGINX logs to Datadog for monitoring and analysis
- Set up alerts to automatically notify you of unexpected changes
Configuring NGINX
To collect metrics from NGINX, you first need to ensure that NGINX has an enabled status module and a URL for reporting its status metrics. Step-by-step instructions for configuring open source NGINX and NGINX Plus are available in our companion post on metric collection.
Integrating Datadog and NGINX
Install the Datadog Agent
The Datadog Agent is the open source software that collects and reports metrics from your hosts so that you can view and monitor them in Datadog. Installing the Agent usually takes just a single command.
As soon as your Agent is up and running, you should see your host reporting metrics in your Datadog account.
Configure the Agent
Next you’ll need to create a simple NGINX configuration file for the Agent. You can find the location of the Agent’s configuration directory for integrations (conf.d) for your OS here. In that directory you will find an nginx.d subdirectory containing an NGINX configuration template named conf.yaml.example. Copy this file to conf.yaml, and edit it to provide the status URL and optional tags for each of your NGINX instances:
conf.yaml
init_config:

instances:

  - nginx_status_url: http://localhost/nginx_status/
    tags:
      - instance:foo
If you’re using NGINX Plus, you’ll also need to set the use_plus_api parameter to true for each instance. See the documentation for further information about configuring the Agent for NGINX Plus.
Restart the Agent
You must restart the Agent to load your new configuration file. Execute the restart command for your platform, as shown in the Agent documentation.
Verify the configuration settings
To check that Datadog and NGINX are properly integrated, run the Agent’s status command and look for nginx under the Running Checks section.
Install the integration
Finally, switch on the NGINX integration inside your Datadog account. It’s as simple as clicking the “Install Integration” button under the Configuration tab in the NGINX integration settings.
Metrics!
Once the Agent begins reporting NGINX performance metrics, you will see an NGINX dashboard among your list of available dashboards in Datadog.
The basic NGINX dashboard displays a handful of graphs encapsulating most of the key metrics highlighted in our introduction to NGINX monitoring.
Collect, analyze, and alert on NGINX metrics and logs with Datadog.
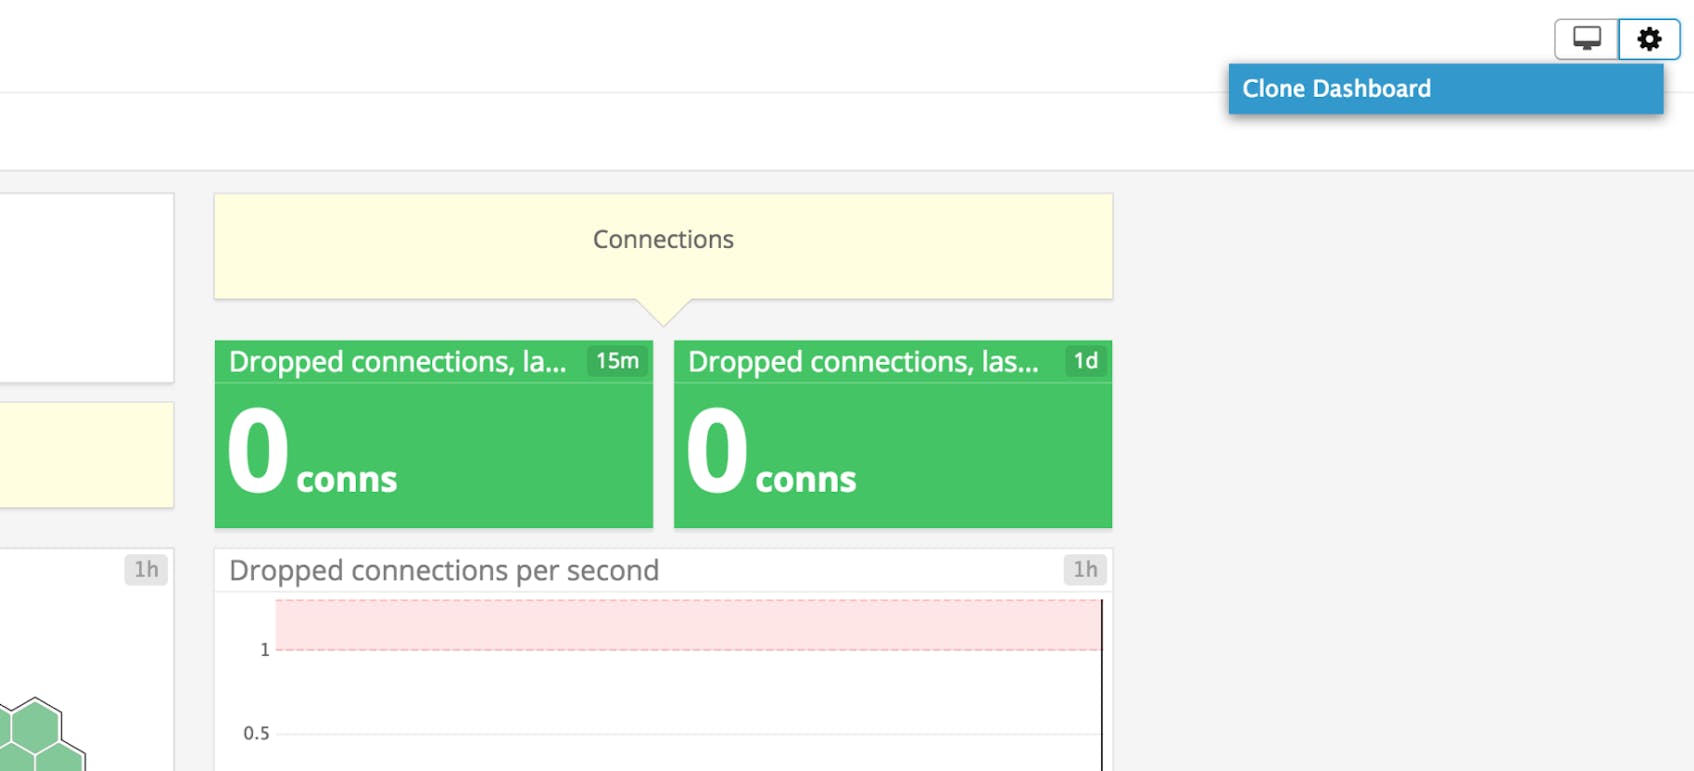
You can easily create a comprehensive dashboard for monitoring your entire web stack by adding additional graphs with important metrics from outside NGINX. For example, you might want to monitor host-level metrics on your NGINX hosts, such as system load. To start building a custom dashboard, simply clone the default NGINX dashboard by clicking on the gear near the upper right of the dashboard and selecting “Clone Dashboard”.
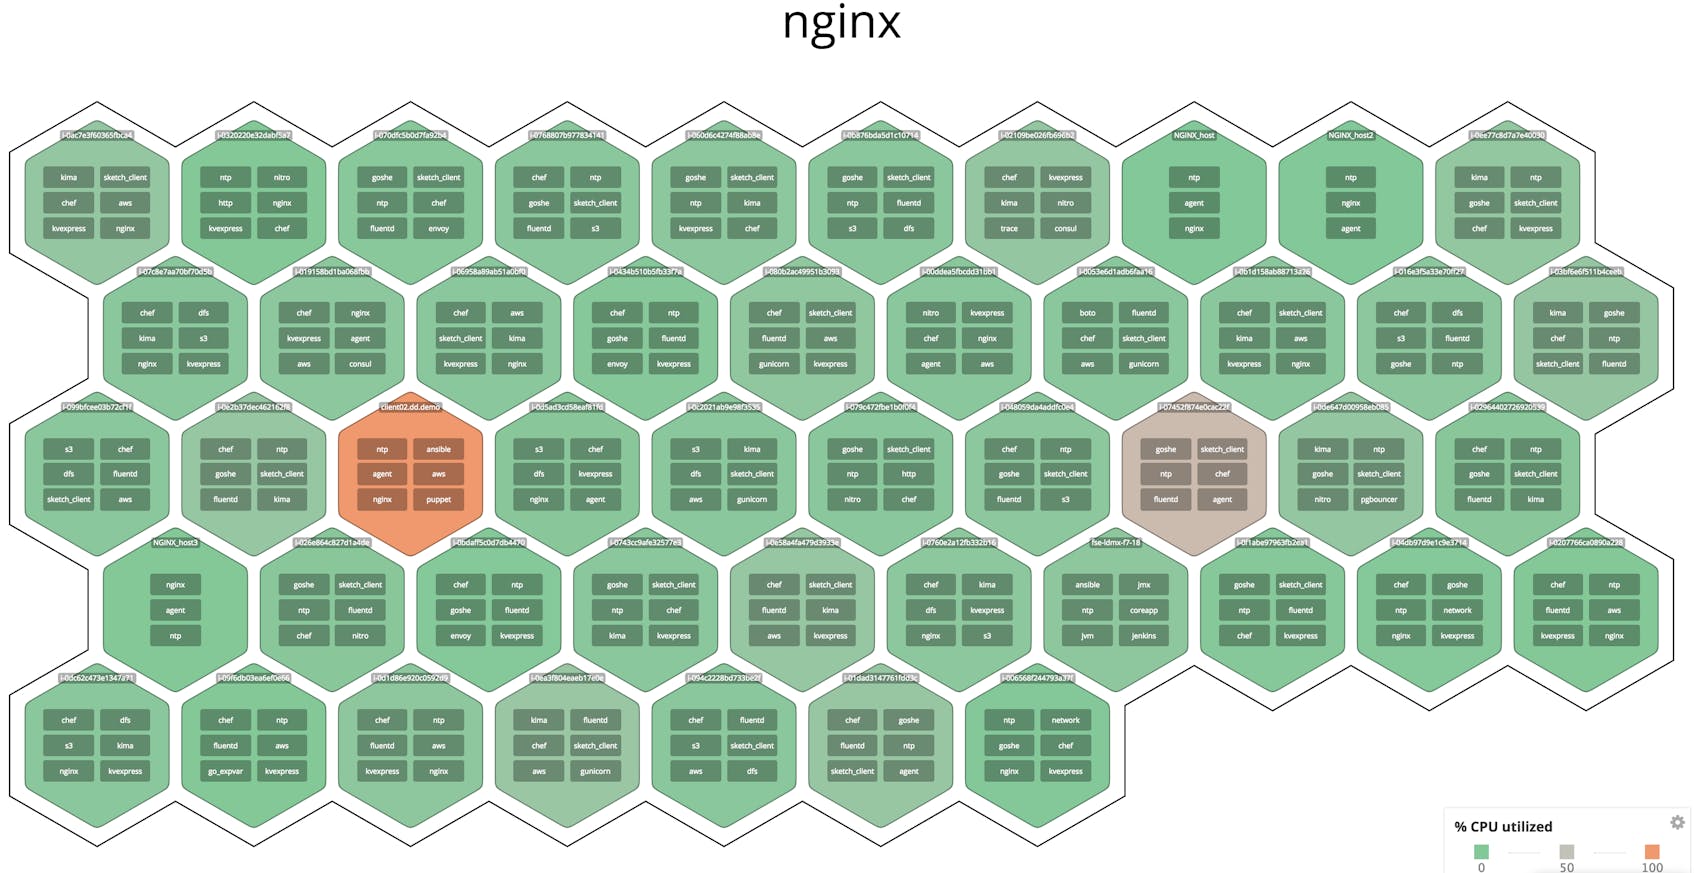
You can also monitor your NGINX instances at a higher level using Datadog’s host maps—for instance, color-coding all your NGINX hosts by CPU usage to identify potential hotspots.
Capturing NGINX logs
Now that you’re collecting NGINX metrics, the next step is to start collecting logs as well. This will extend your visibility beyond metrics, so you can search and filter based on facets like Status Code and URL Path. To show how Datadog log management works, we’ll walk through how you can configure an NGINX server to submit logs to Datadog, and we’ll see how those will look in your Datadog account.
Enabling logging
Log collection is disabled in the Agent by default. To enable it, edit the Agent configuration file, datadog.yaml. (The path to this file varies by platform. See the Datadog Agent documentation for more information.) Uncomment the relevant line and set logs_enabled to true:
datadog.yaml
# Logs agent is disabled by default
logs_enabled: true
Next, modify the configuration of the NGINX integration. Add the following content to the logs item within the Agent’s config file for the integration, conf.d/nginx.d/conf.yaml. This tells the Agent where to find the NGINX logs, and specifies some metadata to be applied:
conf.yaml
logs:
 - type: file
   path: /var/log/nginx/access.log
   service: my.nginx.service
   source: nginx
   sourcecategory: http_web_access
This applies a service name of my.nginx.service to all the logs generated by this NGINX instance. This service tag is also applied to request traces in Datadog APM, enabling you to pivot smoothly between sources of monitoring data for your applications and infrastructure. The configuration above also applies source and sourcecategory tags, which you can use to aggregate data from multiple sources and hosts.
Finally, execute the Agent’s restart command for your platform, as shown in the Agent documentation.
Use JSON logs for automatic parsing
Datadog will process any log formatted as JSON automatically, turning key-value pairs into attributes that you can use to group and filter. You can configure your NGINX access logs to escape JSON characters, making it straightforward to get your logs into Datadog. The configuration snippet below shows how you can log embedded variables from the NGINX core and proxy modules. Some of these values are collected as standard attributes, which help you correlate logs from disparate sources by providing consistent names for data that can appear in logs throughout your stack.
    log_format json_custom escape=json
    '{'
      '"http.url":"$request_uri",'
      '"http.version":"$server_protocol",'
      '"http.status_code":$status,'
      '"http.method":"$request_method",'
      '"http.referer":"$http_referer",'
      '"http.useragent":"$http_user_agent",'
      '"time_local":"$time_local",'
      '"remote_addr":"$remote_addr",'
      '"remote_user":"$remote_user",'
      '"body_bytes_sent":"$body_bytes_sent",'
      '"request_time":$request_time,'
      '"response_content_type":"$sent_http_content_type",'
      '"X-Forwarded-For":"$proxy_add_x_forwarded_for",'
      '"custom_key":"custom_value"'
    '}';
(Note that if you want to be able to create a measure from a log attribute, you should leave its value unquoted, as we’ve shown with the request_time and http.status_code attributes in the example above.)
Along with NGINX configuration variables, Datadog will also process the pair "custom_key":"custom_value" (or any pair you choose) into an attribute, helping you organize your log data using any dimension that’s relevant to your use case. Take care not to use custom variable names that would collide with any reserved attributes.
Viewing log info in Datadog
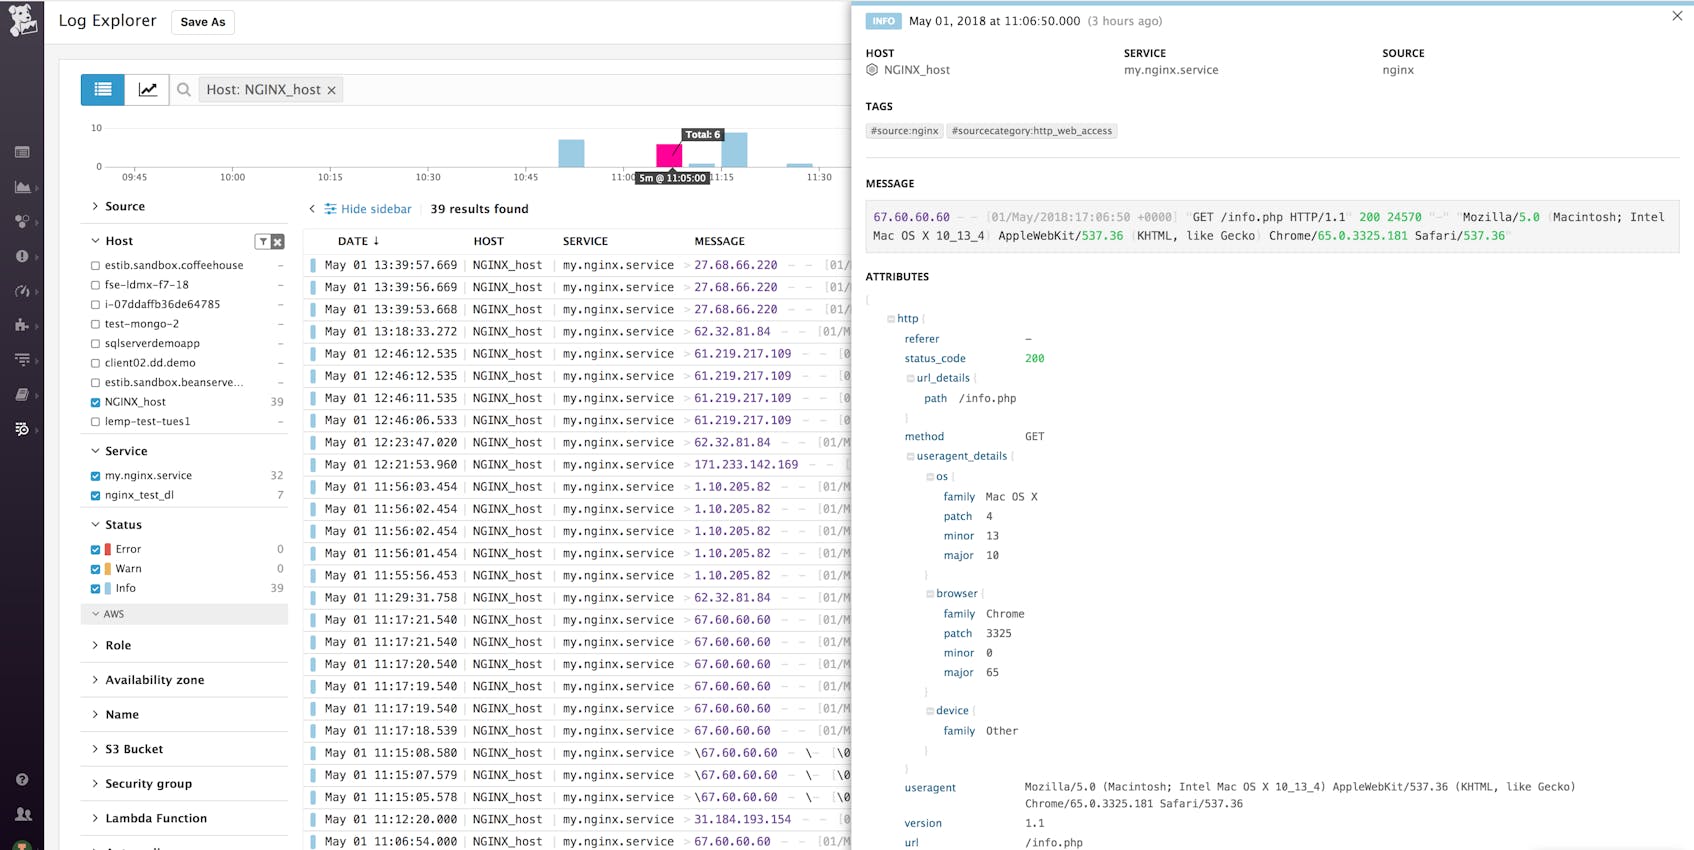
You can now see information from your NGINX logs begin to appear on the Log Explorer page in your Datadog account. To isolate this service’s logs, click my.nginx.service under the Service list in the sidebar.
In the example image below, the log entry shows that NGINX processed a GET request for the file info.php and returned a status code of 200.
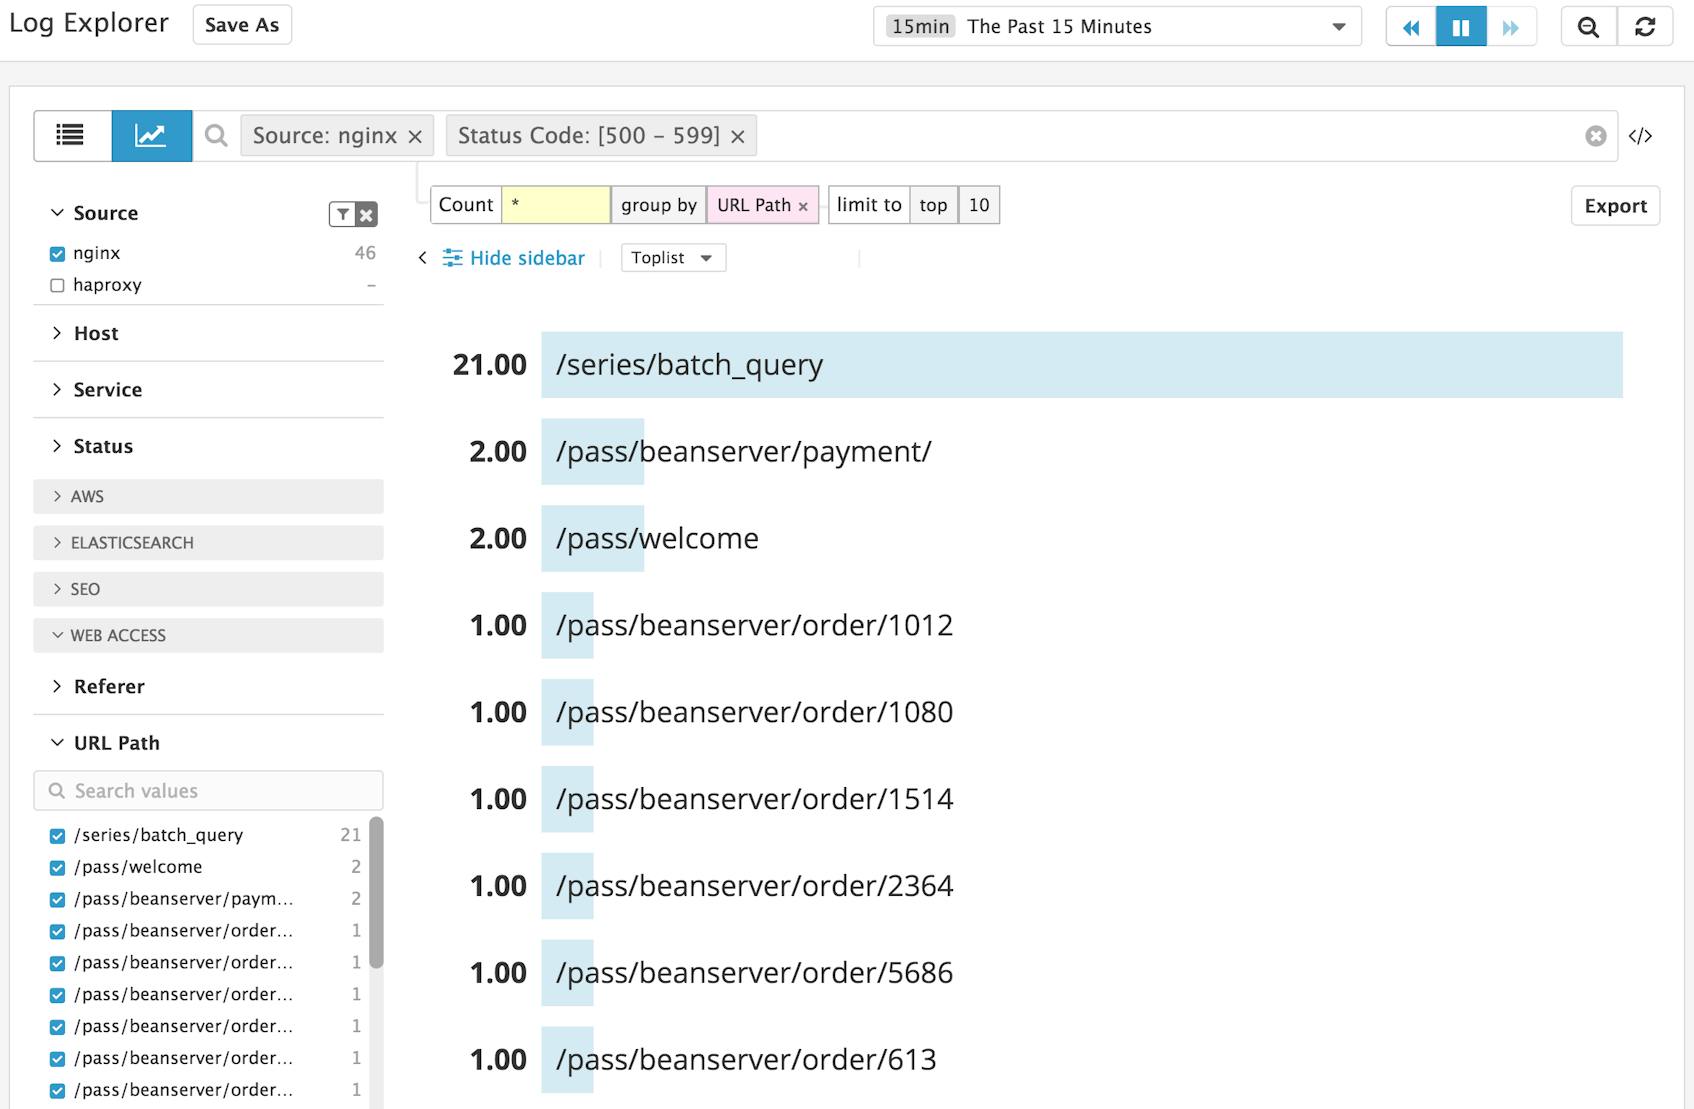
In the Log Explorer, you can filter logs to see information that’s not easily discernible in the log stream. To visualize your logs, you can click the Analytics button in the top-left corner and use the facet controls in the left column to filter and aggregate your log data. In the example below, we’ve used the URL Path and Status Code facets to see which endpoints return the most 5xx errors.
For more information, see our docs on exploring, searching, and graphing your logs.
Extending NGINX logs
By default, NGINX writes logs in the Combined Log Format. You can customize the log format, as described in the NGINX documentation. (For an example of this, see part 2 of this series, which shows how to add request processing time to your NGINX logs.) When you install Datadog’s NGINX integration, a processing pipeline is enabled to automatically parse NGINX logs. This is how the raw data in your logs is automatically extracted and processed into structured data for analysis and graphing. If you modify your NGINX log format (for example, to include request processing time), you’ll need to modify the pipeline to extract data from the new format. See the Datadog pipeline documentation to learn how to clone and modify the NGINX pipeline.
Alerting on NGINX metrics and logs
Once Datadog is capturing and visualizing your metrics and logs, you will likely want to set up some alerts to automatically notify you when there are problems.
Alerts based on your NGINX metrics
You can create alerts based on the metric values you define as normal for your infrastructure or application. A threshold-based alert triggers when a metric exceeds a set value (such as when your dropped requests count is above zero). A change-based alert can notify you, for example, when requests per second drops by more than 30 percent.
You can also create advanced alerts based on the automatic detection of anomalies (metrics that fall outside historical patterns) and outliers (hosts performing differently from similar hosts in your environment).
See our documentation on metric monitors for guidance on creating these types of alerts.
Alerts based on your NGINX logs
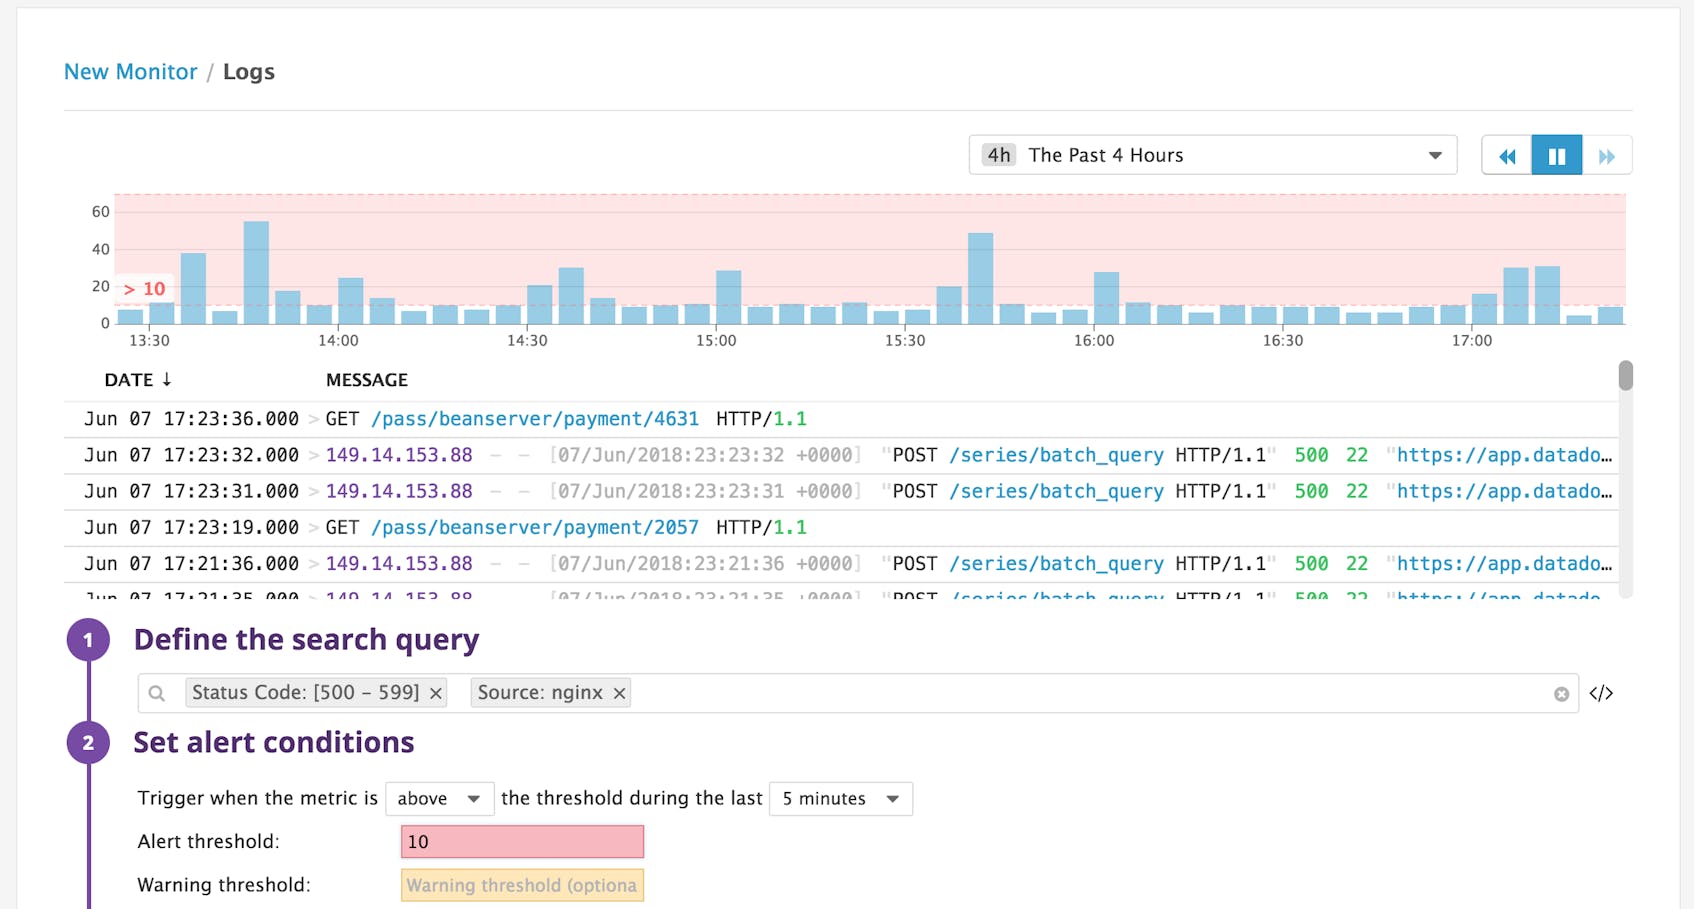
You can build alerts around key data collected in your logs—HTTP response codes and request processing time—that aren’t available on the standard NGINX status page.
Alerting on HTTP response code
NGINX logs requests that are successful (e.g., 2xx) and unsuccessful (e.g., 4xx and 5xx). Because of this, in Datadog you can build an alert that notifies you when your server-side error rate exceeds an acceptable limit.
Alerting on request processing time
As another example, if you extend the NGINX log format to include request processing time and modify your log pipeline to extract the additional data, you can create an alert to notify you of an unexpected uptick in slow requests.
See Datadog’s log monitor documentation to get started creating alerts based on log data.
Improve your NGINX visibility
In this post we’ve walked you through integrating NGINX with Datadog to visualize your key metrics and logs, and to notify your team when your web infrastructure shows signs of trouble.
If you’ve followed along using your own Datadog account, you should now have greatly improved visibility into what’s happening in your web environment, as well as the ability to create automated alerts tailored to your environment, your usage patterns, and the indicators that are most valuable to your organization.
If you don’t yet have a Datadog account, you can sign up for a free trial and start monitoring your infrastructure, your applications, and your services today.
Source Markdown for this post is available on GitHub. Questions, corrections, additions, etc.? Please let us know.


