In the previous post in this series, we dug into the data you should track so you can properly monitor your Kubernetes cluster. Next, you will learn how you can start inspecting your Kubernetes metrics and logs using free, open source tools.
In this post we’ll cover several ways of retrieving and viewing observability data from your Kubernetes cluster:
- Querying and visualizing resource metrics from Kubernetes
- Gathering cluster-level status information
- Viewing logs from Kubernetes pods
Collect resource metrics from Kubernetes objects
Resource metrics track the utilization and availability of critical resources such as CPU, memory, and storage. Kubernetes provides a Metrics API and a number of command line queries that allow you to retrieve snapshots of resource utilization with relative ease.
First things first: Deploy Metrics Server
Before you can query the Kubernetes Metrics API or run kubectl top commands to retrieve metrics from the command line, you’ll need to ensure that Metrics Server is deployed to your cluster. As detailed in Part 2, Metrics Server is a cluster add-on that collects resource usage data from each node and provides aggregated metrics through the Metrics API. Metrics Server makes resource metrics such as CPU and memory available for users to query, as well as for the Kubernetes Horizontal Pod Autoscaler to use for auto-scaling workloads.
Depending on how you run Kubernetes, Metrics Server may already be deployed to your cluster. For instance, Google Kubernetes Engine clusters include a Metrics Server deployment by default, whereas Amazon Elastic Kubernetes Service clusters do not. Run the following command using the kubectl command line utility to see if metrics-server is running in your cluster:
kubectl get pods --all-namespaces | grep metrics-serverIf Metrics Server is already running, you’ll see details on the running pods, as in the response below:
kube-system metrics-server-v0.3.1-57c75779f-8sm9r 2/2 Running 0 16hIf no pods are returned, you can deploy the latest version of the Metrics Server by running the following command:
kubectl apply -f https://github.com/kubernetes-sigs/metrics-server/releases/latest/download/components.yamlUse kubectl get to query the Metrics API
Once Metrics Server is deployed, you can query the Metrics API to retrieve current metrics from any node or pod using the below commands. You can find the name of your desired node or pod by running kubectl get nodes or kubectl get pods, respectively:
kubectl get --raw /apis/metrics.k8s.io/v1beta1/nodes/<NODE_NAME> | jq

kubectl get --raw /apis/metrics.k8s.io/v1beta1/namespaces/<NAMESPACE>/pods/<POD_NAME> | jq
For example, the following command retrieves metrics on a busybox pod deployed in the default namespace:
kubectl get --raw /apis/metrics.k8s.io/v1beta1/namespaces/default/pods/busybox | jqThe Metrics API returns a JSON object, so (optionally) piping the response through jq displays the JSON in a more human-readable format:
{
  "kind": "PodMetrics",
  "apiVersion": "metrics.k8s.io/v1beta1",
  "metadata": {
    "name": "busybox",
    "namespace": "default",
    "selfLink": "/apis/metrics.k8s.io/v1beta1/namespaces/default/pods/busybox",
    "creationTimestamp": "2019-12-10T18:23:20Z"
  },
  "timestamp": "2019-12-10T18:23:12Z",
  "window": "30s",
  "containers": [
    {
      "name": "busybox",
      "usage": {
        "cpu": "0",
        "memory": "364Ki"
      }
    }
  ]
}
If multiple containers are running in the same pod, the API response will include separate resource statistics for each container.
You can query the CPU and memory usage of a Kubernetes node with a similar command:
kubectl get --raw /apis/metrics.k8s.io/v1beta1/nodes/gke-john-m-research-default-pool-15c38181-m4xw | jq

{
  "kind": "NodeMetrics",
  "apiVersion": "metrics.k8s.io/v1beta1",
  "metadata": {
    "name": "gke-john-m-research-default-pool-15c38181-m4xw",
    "selfLink": "/apis/metrics.k8s.io/v1beta1/nodes/gke-john-m-research-default-pool-15c38181-m4xw",
    "creationTimestamp": "2019-12-10T18:34:01Z"
  },
  "timestamp": "2019-12-10T18:33:41Z",
  "window": "30s",
  "usage": {
    "cpu": "62789706n",
    "memory": "641Mi"
  }
}
View metric snapshots using kubectl top
Once Metrics Server is deployed, you can retrieve compact metric snapshots from the Metrics API using kubectl top. The kubectl top command returns current CPU and memory usage for a cluster’s pods or nodes, or for a particular pod or node if specified.
For example, you can run the following command to display a snapshot of near-real-time resource usage of all cluster nodes:
kubectl top node

NAME                                               CPU(cores)   CPU%   MEMORY(bytes)   MEMORY%
gke-john-m-research-2-default-pool-42552c4a-fg80   89m          9%     781Mi           67%
gke-john-m-research-2-default-pool-42552c4a-lx87   59m          6%     644Mi           55%
gke-john-m-research-2-default-pool-42552c4a-rxmv   53m          5%     665Mi           57%
This output shows three worker nodes in a GKE cluster. Each line displays the total amount of CPU (in cores, or in this case m for millicores) and memory (in MiB) that the node is using, and the percentages of the node’s allocatable capacity those numbers represent. Likewise, to query resource utilization by pod in the web-app namespace, run the command below (note that if you do not specify a namespace, the default namespace will be used):
kubectl top pod --namespace web-app

NAME                                CPU(cores)   MEMORY(bytes)
nginx-deployment-76bf4969df-65wmd   12m           1Mi
nginx-deployment-76bf4969df-mmqvt   16m           1Mi
You can also display a resource breakdown at the container level within pods by adding a --containers flag. The command below shows that one of our kube-dns pods, which run in the kube-system namespace, comprises four individual containers, and breaks down the pod’s resource usage among those containers:
kubectl top pod kube-dns-79868f54c5-58hq8 --namespace kube-system --containers

POD                         NAME               CPU(cores)   MEMORY(bytes)
kube-dns-79868f54c5-58hq8   prometheus-to-sd   0m           6Mi
kube-dns-79868f54c5-58hq8   sidecar            1m           10Mi
kube-dns-79868f54c5-58hq8   kubedns            1m           7Mi
kube-dns-79868f54c5-58hq8   dnsmasq            1m           5Mi
Query resource allocations with kubectl describe
If you want to see details about the resources that have been allocated to your nodes, rather than the current resource usage, the kubectl describe command provides a detailed breakdown of a specified pod or node. This can be particularly useful to list the resource requests and limits (as explained in Part 2) of all of the pods on a specific node. For example, to view details on one of the GKE hosts returned by the kubectl top node command above, you would run the following:
kubectl describe node gke-john-m-research-2-default-pool-42552c4a-fg80The output is verbose, containing a full breakdown of the node’s workloads, system info, and metadata such as labels and annotations. Below, we’ll excerpt the workload portion of the output, which breaks down the resource requests and limits at the pod level, as well as for the entire node:
Non-terminated Pods:         (10 in total)
  Namespace                  Name                                                           CPU Requests  CPU Limits  Memory Requests  Memory Limits  AGE
  ---------                  ----                                                           ------------  ----------  ---------------  -------------  ---
  default                    nginx-deployment-76bf4969df-65wmd                              100m (10%)    0 (0%)      0 (0%)           0 (0%)         4d23h
  kube-system                fluentd-gcp-scaler-59b7b75cd7-l8wdg                            0 (0%)        0 (0%)      0 (0%)           0 (0%)         5d5h
  kube-system                fluentd-gcp-v3.2.0-77r6g                                       100m (10%)    1 (106%)    200Mi (17%)      500Mi (43%)    5d5h
  kube-system                kube-dns-79868f54c5-k4rpd                                      260m (27%)    0 (0%)      110Mi (9%)       170Mi (14%)    5d5h
  kube-system                kube-dns-autoscaler-bb58c6784-nxzzz                            20m (2%)      0 (0%)      10Mi (0%)        0 (0%)         5d5h
  kube-system                kube-proxy-gke-john-m-research-2-default-pool-42552c4a-fg80    100m (10%)    0 (0%)      0 (0%)           0 (0%)         5d5h
  kube-system                kubernetes-dashboard-57df4db6b-tlq7z                           0 (0%)        0 (0%)      0 (0%)           0 (0%)         3d
  kube-system                metrics-server-v0.3.1-57c75779f-vg6rq                          48m (5%)      143m (15%)  105Mi (9%)       355Mi (30%)    5d5h
  kube-system                prometheus-to-sd-zsp8k                                         1m (0%)       3m (0%)     20Mi (1%)        20Mi (1%)      5d5h
  kubernetes-dashboard       kubernetes-dashboard-6fd7ddf9bb-66gkk                          0 (0%)        0 (0%)      0 (0%)           0 (0%)         5d2h
Allocated resources:
  (Total limits may be over 100 percent, i.e., overcommitted.)
  Resource                   Requests     Limits
  --------                   --------     ------
  cpu                        629m (66%)   1146m (121%)
  memory                     445Mi (38%)  1045Mi (90%)
  ephemeral-storage          0 (0%)       0 (0%)
  attachable-volumes-gce-pd  0            0
Note that kubectl describe returns the percent of total available capacity that each resource request or limit represents. These statistics are not a measure of actual CPU or memory utilization, as is returned by kubectl top. (Because of this difference, the kubectl describe command will work even in the absence of Metrics Server.) In the above example, we see that the pod nginx-deployment-76bf4969df-65wmd has a CPU request of 100 millicores, accounting for 10 percent of the node’s capacity, which is one core.
Browse cluster objects in Kubernetes Dashboard
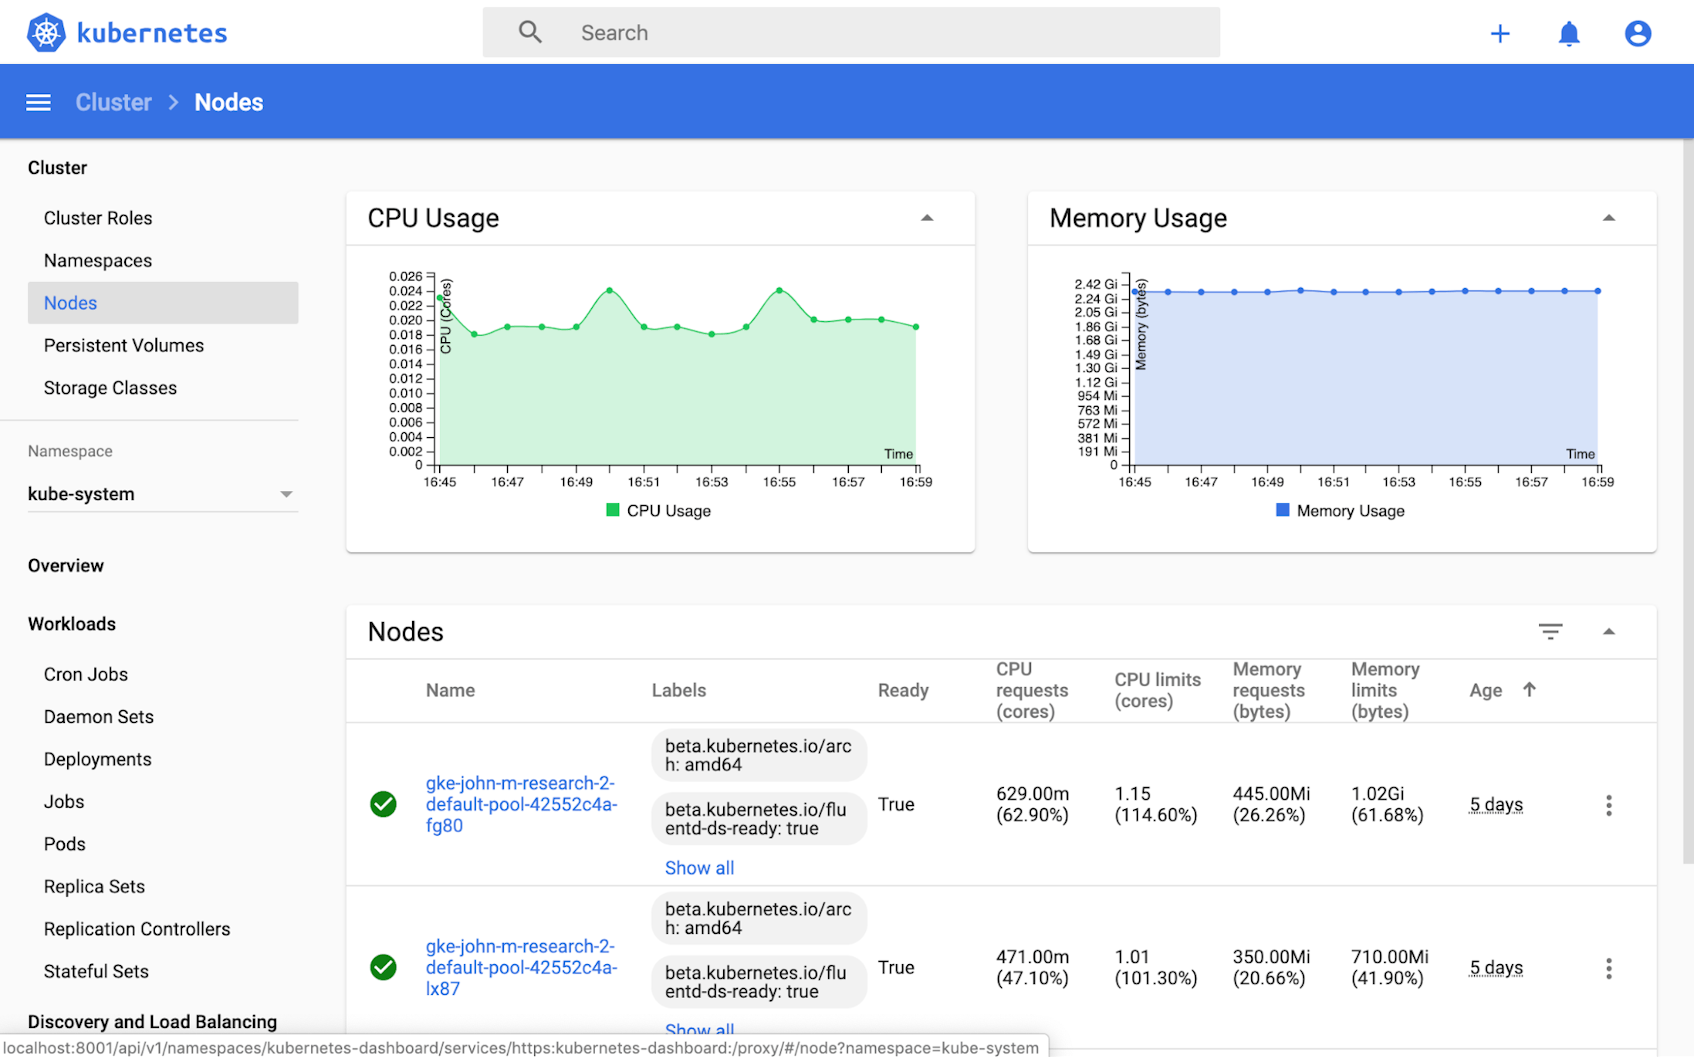
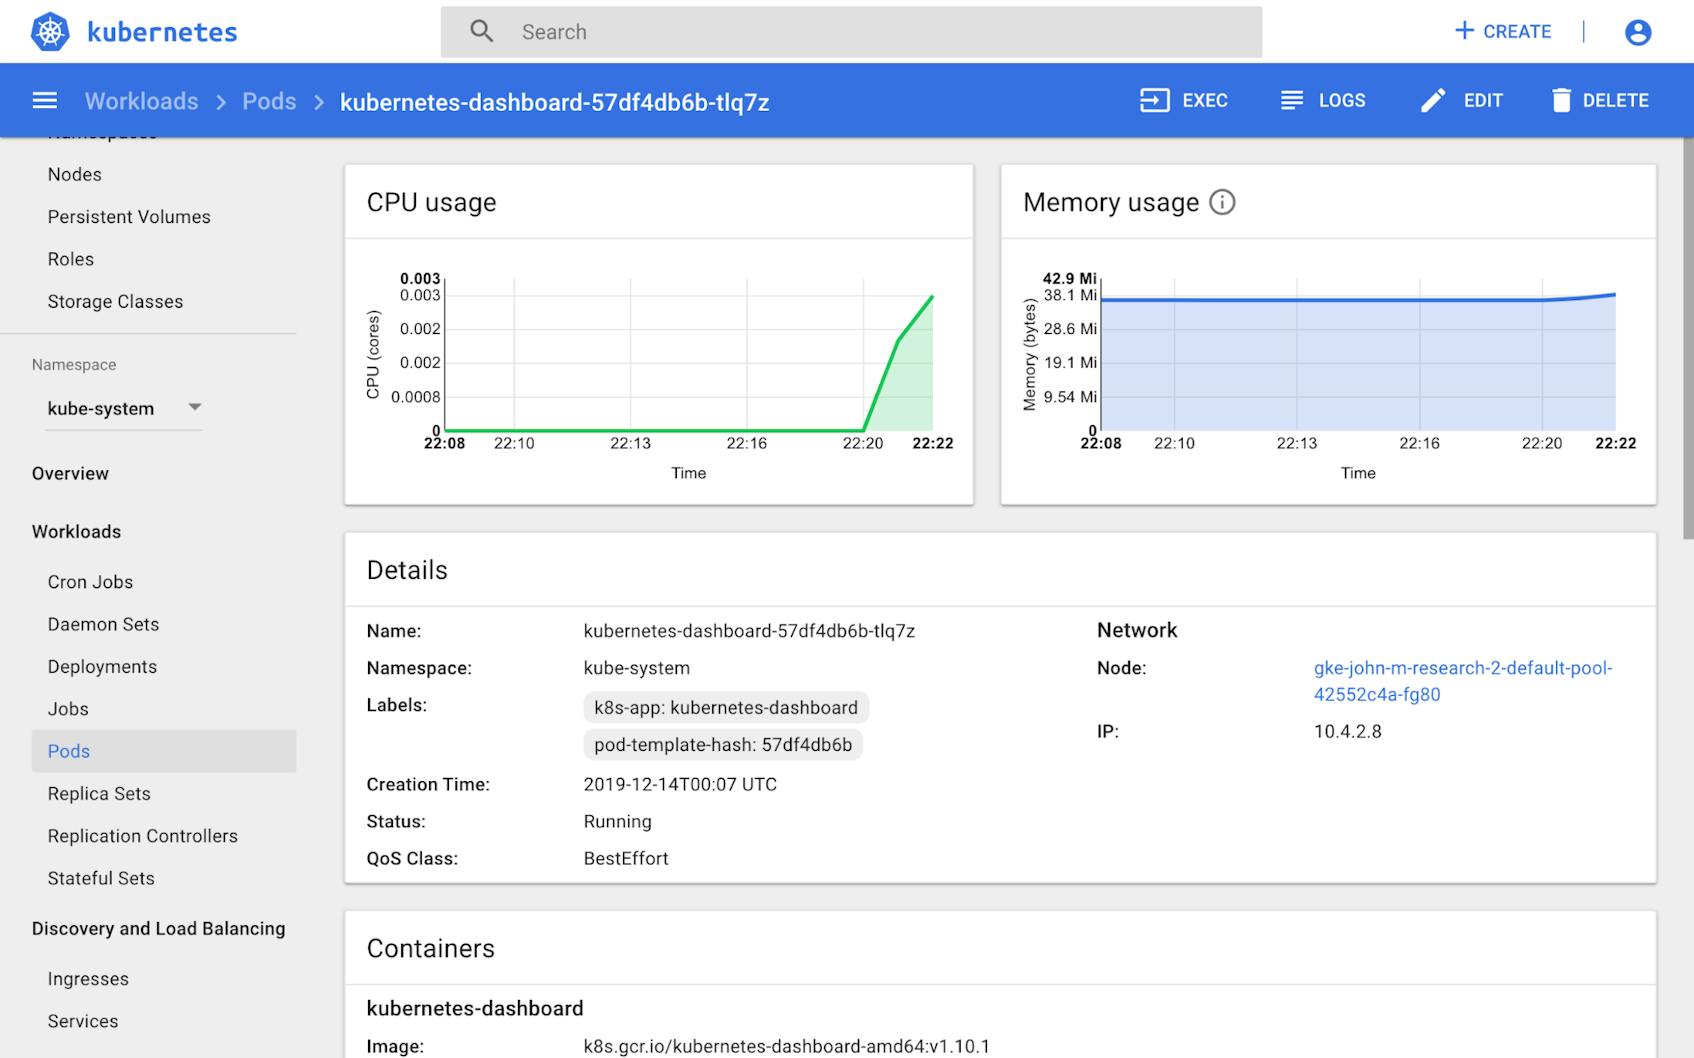
Kubernetes Dashboard is a web-based UI for monitoring and managing your cluster. Essentially, it is a graphical wrapper for the same functions that kubectl can provide: you can use Dashboard to deploy and manage applications, monitor Kubernetes objects, and more. Dashboard provides resource usage breakdowns for each node and pod, as well as detailed metadata about pods, services, Deployments, and other Kubernetes objects. Unlike kubectl top, Dashboard provides not only an instantaneous snapshot of resource usage but also some basic graphs tracking how those metrics have evolved over the previous 15 minutes.
Note that the metric graphs at the top of Dashboard’s main overview depend on the use of Heapster, which preceded Metrics Server as the primary source of resource usage data in Kubernetes. Heapster is officially deprecated, and its out-of-the-box deployment manifests will not work with some recent versions of Kubernetes. As of the time of this writing, a new version (2.0) of Dashboard is available, along with a lightweight Metrics Scraper to retrieve and store metrics from Metrics Server.
Install Dashboard
Installing Kubernetes Dashboard is fairly straightforward, as outlined in the project’s documentation. In fact, authenticating to Dashboard can be somewhat more complicated than actually deploying it, especially in a production environment. We’ll cover both installation and authentication below.
To install Kubernetes Dashboard, you can deploy the official manifest for the latest supported version. The command below deploys version 1.10.1, but you can check the GitHub page for the project to find the latest.
kubectl apply -f https://raw.githubusercontent.com/kubernetes/dashboard/v1.10.1/src/deploy/recommended/kubernetes-dashboard.yamlOnce Dashboard has been deployed, you can start an HTTP proxy to access its UI via a web browser:
kubectl proxy

Starting to serve on 127.0.0.1:8001
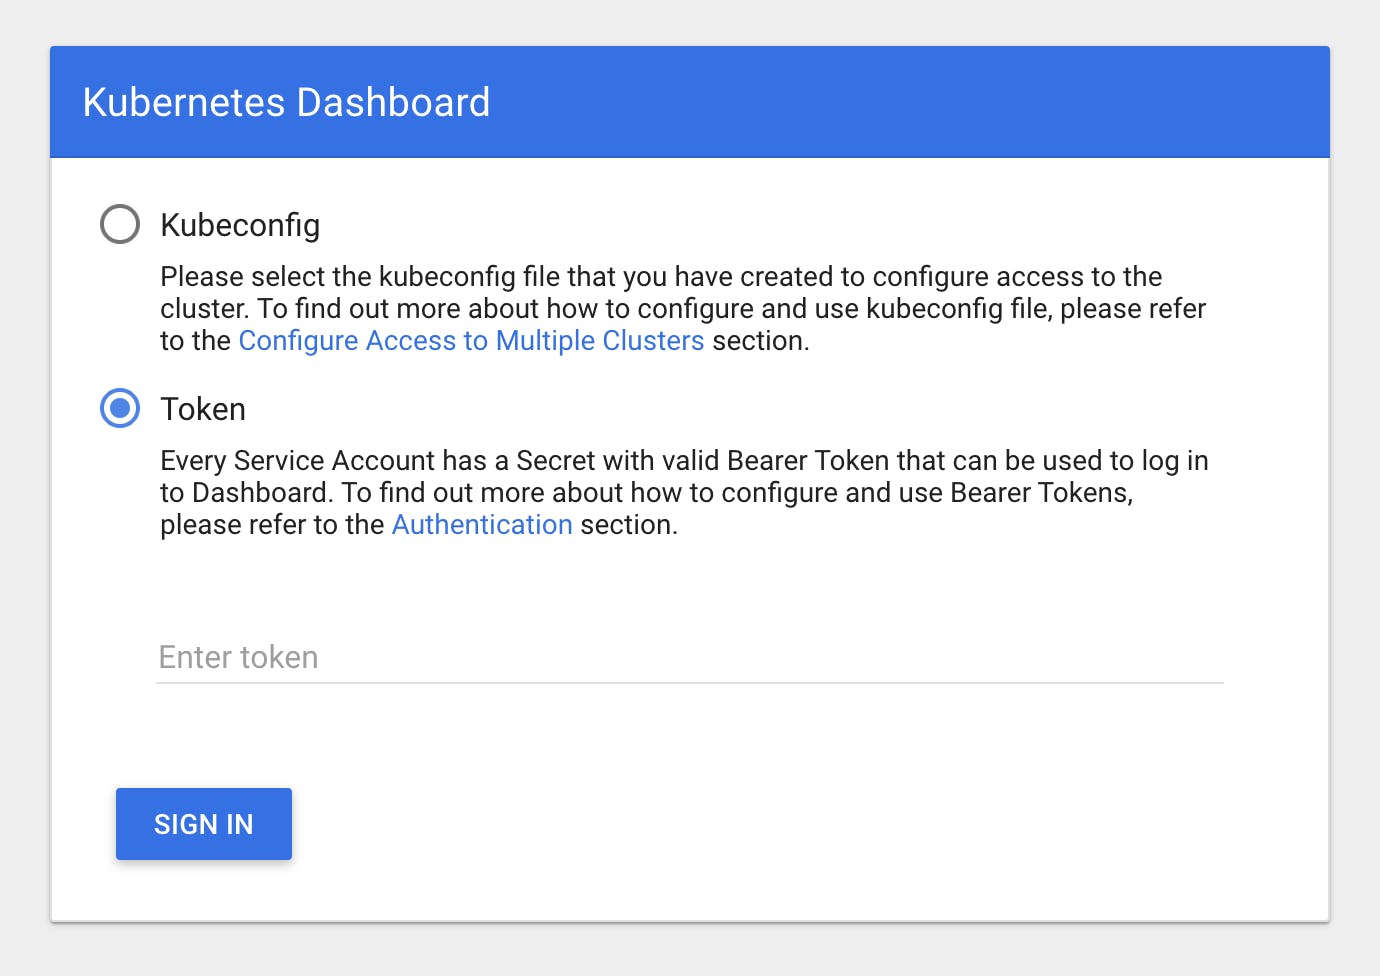
Once you see that the HTTP proxy is starting to serve requests, you can access Kubernetes Dashboard at this URL. You’ll then be prompted with a login screen, as shown below.
Generate an auth token to access Dashboard
In a demo environment, you can quickly generate a token to authenticate to Dashboard by following the instructions here. In short, the process involves creating an admin-user Service Account and an associated Cluster Role Binding, which grants admin permissions that allow the user to view all the data in Dashboard. Once you have created the Service Account and Cluster Role Binding, you can retrieve a valid token at any time (including after the initial session expires) by running the following command:
kubectl --namespace kubernetes-dashboard describe secret $(kubectl -n kubernetes-dashboard get secret | grep admin-user | awk '{print $1}')The output includes a token field under the Data section. You can copy the token value and paste it into the Dashboard authentication window:
[...]
Data
====
ca.crt:     1119 bytes
namespace:  20 bytes
token:      eyJhbGciOiJSUzI1NiIsImtpZCI6IiJ9.eyJpc3MiOiJrdWJlcm5ldGVzL3NlcnZpY2VhY2NvdW50Iiwia3ViZXJuZXRlcy5pby9zZXJ2aWNlYWNjb3VudC9uYW1lc3BhY2UiOiJrdWJlcm5ldGVzLWRhc2hib2FyZCIsImt1YmVybmV0ZXMuaW8vc2VydmljZWFjY291bnQvc2VjcmV0Lm5hbWUiOiJhZG1pbi11c2VyLXRva2VuLXM4dGw5Iiwia3ViZXJuZXRlcy5pby9zZXJ2aWNlYWNjb3VudC9zZXJ2aWNlLWFjY291bnQubmFtZSI6ImFkbWluLXVzZXIiLCJrdWJlcm5ldGVzLmlvL3NlcnZpY2VhY2NvdW50L3NlcnZpY2UtYWNjb3VudC51aWQiOiJlMjQ3OTE1ZC0xYzY2LTExZWEtOGJmMC00MjAxMGE4MDAxMjAiLCJzdWIiOiJzeXN0ZW06c2VydmljZWFjY291bnQ6a3ViZXJuZXRlcy1kYXNoYm9hcmQ6YWRtaW4tdXNlciJ9.eVT-mDYfpjKQgJsmZmLsSUxMxbetNmd2FmPetQ_j5MprOcIRY84gd51k-7HtFWT3DyOV8t2zUoQz4ppG52Pzwygsg8lF1zOM81QcdrJMU7CEqmrvQS8HQWDiheeogR8CoauUD2RHRNxzQPELPktTM_sOdo73irh-R4mkdV9smYBOeqWe7CZM6gztrSJAe3ur07THTf-ZIG48TWmQztc0nXMllrqp8ehxoTBODvvXvnFjJ47LjeHU4_r4UKMAukxxxJN7wmiXVgwZJHsJiadb-RE3rKGrioa3EQyQEk6I3fLkII-C8_NbfyfiwSUn2Rvc41WljxIl1KcyHdDMfyc1tA
Once you deploy and log in to Kubernetes Dashboard, you’ll have access to metric summaries for each pod, node, and namespace in your cluster. You can also use the UI to edit Kubernetes objects—for instance, to scale up a Deployment or to change the image version in a pod’s specification.
Collect high-level cluster status metrics
In addition to monitoring the CPU and memory usage of cluster nodes and pods, you’ll need a way to collect metrics tracking the high-level status of the cluster and its constituent objects.
As covered in Part 2, the Kubernetes API server exposes data about the count, health, and availability of pods, nodes, and other Kubernetes objects. By installing the kube-state-metrics add-on in your cluster, you can consume these metrics more easily to help surface issues with cluster infrastructure, resource constraints, or pod scheduling.
Add kube-state-metrics to your cluster
The kube-state-metrics service provides additional cluster information that Metrics Server does not. Metrics Server exposes statistics about the resource utilization of Kubernetes objects, whereas kube-state-metrics listens to the Kubernetes API and generates metrics about the state of Kubernetes objects: node status, node capacity (CPU and memory), number of desired/available/unavailable/updated replicas per Deployment, pod status (e.g., waiting, running, ready), and so on. The kube-state-metrics docs detail all the metrics that are available once kube-state-metrics is deployed.
Deploy kube-state-metrics
The kube-state-metrics add-on runs as a Kubernetes Deployment with a single replica. To create the Deployment, service, and associated permissions, you can use a set of manifests from the official kube-state-metrics project. To download the manifests and apply them to your cluster, run the following series of commands:
git clone https://github.com/kubernetes/kube-state-metrics.git
cd kube-state-metrics
kubectl apply -f examples/standard
Note that some environments, including GKE clusters, have restrictive permissions settings that require a different installation approach. Details on deploying kube-state-metrics to GKE clusters and other restricted environments are available in the kube-state-metrics docs.
Collect cluster state metrics
Once kube-state-metrics is deployed to your cluster, it provides a vast array of metrics in text format on an HTTP endpoint. The metrics are exposed in Prometheus exposition format, so they can be easily consumed by any monitoring system that can collect Prometheus metrics. To browse the metrics, you can start an HTTP proxy:
kubectl proxy

Starting to serve on 127.0.0.1:8001
You can then view the text-based metrics at http://localhost:8001/api/v1/namespaces/kube-system/services/kube-state-metrics:http-metrics/proxy/metrics or by sending a curl request to the same endpoint:
curl localhost:8001/api/v1/namespaces/kube-system/services/kube-state-metrics:http-metrics/proxy/metricsThe list of returned metrics is very long—more than 1,000 lines of text at the time of this writing—so it is helpful to identify metric(s) of interest in the kube-state-metrics docs to grep or otherwise search for. For instance, the following command returns a metric definition for kube_node_status_capacity_cpu_cores, as well as the metric’s value for the sole node in a minikube cluster:
curl http://localhost:8001/api/v1/namespaces/kube-system/services/kube-state-metrics:http-metrics/proxy/metrics | grep kube_node_status_capacity_cpu_cores

# HELP kube_node_status_capacity_cpu_cores The total CPU resources of the node.
# TYPE kube_node_status_capacity_cpu_cores gauge
kube_node_status_capacity_cpu_cores{node="minikube"} 2
Spot check via command line
Some metrics specific to Kubernetes cluster status can be easily spot-checked via the command line. The most useful command for high-level cluster checks is kubectl get, which returns the status of various Kubernetes objects. For example, you can see the number of pods available, desired and currently running for all your Deployments with this command:
kubectl get deployments

NAME       DESIRED   CURRENT   UP-TO-DATE   AVAILABLE   AGE
app        3         3         3            0           17s
nginx      1         1         1            1           23m
redis      1         1         1            1           23m
The above example shows three Deployments on our cluster. For the app Deployment, we see that, although the three requested (DESIRED) pods are currently running (CURRENT), they are not yet ready for use (AVAILABLE). In this case, it’s because the configuration specifies that pods running in this Deployment must be healthy for 90 seconds before they will be made available, and the deployment was launched just 17 seconds ago.
Likewise, we can see that the nginx and redis Deployments specify one replica (pod) each, and that both of them are currently running as desired, with one pod for each Deployment. We also see that these pods reflect the most recent desired state for those pods (UP-TO-DATE) and are available.
Viewing pod logs with kubectl logs
Viewing metrics and metadata about your nodes and pods can alert you to problems with your cluster. For example, you can see if replicas for a deployment are not launching properly, or if your nodes are running low on available resources. But troubleshooting a problem may require more detailed information and application-specific context, which is where logs can come in handy.
The kubectl logs command dumps or streams logs written to stdout from a specific pod or container:
kubectl logs <POD_NAME> # query a specific pod's logs
kubectl logs <POD_NAME> -c <CONTAINER_NAME> # query a specific container's logs
If you don’t specify any other options, this command will simply dump all stdout logs from the specified pod or container. And this does mean all, so filtering or reducing the log output can be useful. For example, the --tail flag lets you restrict the output to a specified number of the most recent log messages:
kubectl logs --tail=25 <POD_NAME>Another useful flag is --previous, which returns logs for a previous instance of the specified pod or container. The --previous flag allows you to view the logs of a crashed pod for troubleshooting:
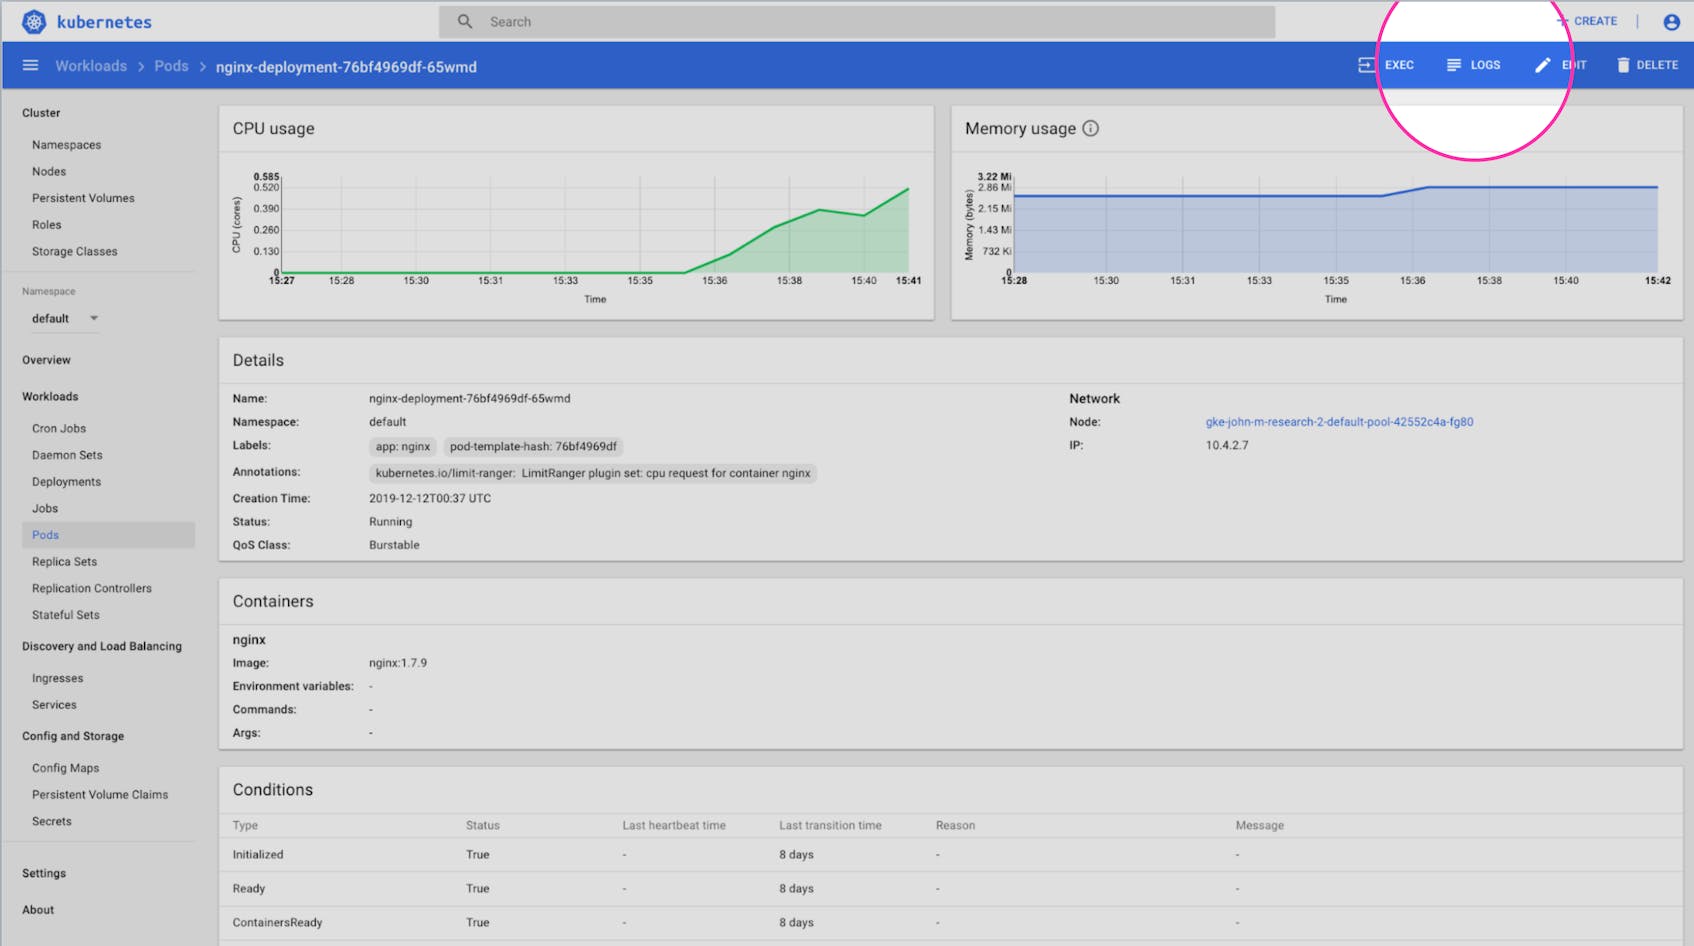
kubectl logs <POD_NAME> --previousNote that you can also view the stream of logs from a pod in Kubernetes Dashboard. From the navigation bar at the top of the “Pods” view, click on the “Logs” tab to access a log stream from the pod in the browser, which can be further segmented by container if the pod comprises multiple containers.
Production Kubernetes monitoring with Datadog
As we’ve shown in this post, Kubernetes includes several useful monitoring tools, both as built-in features and cluster add-ons. The available tooling is valuable for spot checks and retrieving metric snapshots, and can even display several minutes of monitoring data in some cases. But for monitoring production environments, you need visibility into your Kubernetes infrastructure as well as your containerized applications themselves, with much longer data retention and lookback times. Using a monitoring service can also give you access to metrics from your Control Plane, providing more insight into your cluster’s health and performance.
Datadog provides full-stack visibility into Kubernetes environments, with:
- out-of-the-box integrations with Kubernetes, Docker, containerd, and all your containerized applications, so you can see all your metrics, logs, and traces in one place
- Autodiscovery so you can seamlessly monitor applications in large-scale dynamic environments
- advanced monitoring features including outlier and anomaly detection, forecasting, and automatic correlation of observability data
From cluster status to low-level resource metrics to distributed traces and container logs, Datadog brings together all the data from your infrastructure and applications in one platform. Datadog automatically collects labels and tags from Kubernetes and your containers, so you can filter and aggregate your data using the same abstractions that define your cluster. The next and last part of this series describes how to use Datadog for monitoring Kubernetes clusters, and shows you how you can start getting visibility into every part of your containerized environment in minutes.
Source Markdown for this post is available on GitHub. Questions, corrections, additions, etc.? Please let us know.


