The ASP.NET Core framework enables you to build and deploy .NET applications on a wide variety of platforms, each of which has different observability concerns. In a previous post, we looked at monitoring a containerized ASP.NET Core application. In this guide, we’ll show how Datadog provides visibility into ASP.NET Core applications running on AWS Fargate. We’ll walk through:
- instrumenting and packaging a sample .NET application
- publishing the application to Docker Hub
- deploying the instrumented .NET application using AWS Fargate
- monitoring application performance with Datadog APM
Instrumenting your application enables you to track requests as they move across the application’s service and process boundaries, so you can identify performance bottlenecks and resolve them before they affect end users. Datadog offers out-of-the-box instrumentation for .NET Core and other .NET frameworks with the .NET tracer, which submits trace data to Datadog via the Datadog Agent. The Agent can also collect performance data from your Fargate resources, giving you complete visibility into your application and its underlying infrastructure.
Get started with a sample application
To get started, make sure you have at least version 5 of the .NET Core SDK installed, which includes the .NET CLI. This will let you generate the sample ASP.NET Core application we’ll use throughout this guide. We’ll also use Docker Hub to publish the containerized application, though you can use other container registry services such as Amazon ECR.
You can create a new web application project with all of the files needed to run a sample application via the following .NET CLI commands:
dotnet new sln -n DatadogFargateExample
dotnet new webapp -o DatadogFargateExample -n DatadogFargateExample
dotnet sln add DatadogFargateExample
These commands create a new solution file (i.e., DatadogFargateExample.sln) and add a new Razor Pages web application project and associated DatadogFargateExample directory to the file. Next, we’ll instrument the application with Datadog’s .NET tracer and publish it on Docker Hub as a Linux container.
Package an instrumented application with Docker
Docker enables you to easily package applications and their dependencies together in a single container, which you can then deploy to any environment, such as a Fargate cluster. AWS Fargate currently only supports Linux-based containers, so we will use a Linux container to package the application. To create a container, add the following Dockerfile to your project’s DatadogFargateExample directory:
./DatadogFargateExample/Dockerfile
#See https://aka.ms/containerfastmode to understand how Visual Studio uses this Dockerfile to build your images for faster debugging.

FROM mcr.microsoft.com/dotnet/aspnet:5.0 AS base
WORKDIR /app
EXPOSE 80
EXPOSE 443

FROM mcr.microsoft.com/dotnet/sdk:5.0 AS build

# Download the latest version of the tracer but don't install yet
RUN TRACER_VERSION=$(curl -s \https://api.github.com/repos/DataDog/dd-trace-dotnet/releases/latest | grep tag_name | cut -d '"' -f 4 | cut -c2-) \
    && curl -Lo /tmp/datadog-dotnet-apm.deb https://github.com/DataDog/dd-trace-dotnet/releases/download/v\${TRACER_VERSION}/datadog-dotnet-apm_\${TRACER_VERSION}_amd64.deb

WORKDIR /src
COPY ["DatadogFargateExample/DatadogFargateExample.csproj", "DatadogFargateExample/"]
RUN dotnet restore "DatadogFargateExample/DatadogFargateExample.csproj"
COPY . .
WORKDIR "/src/DatadogFargateExample"
RUN dotnet build "DatadogFargateExample.csproj" -c Release -o /app/build

FROM build AS publish
RUN dotnet publish "DatadogFargateExample.csproj" -c Release -o /app/publish

FROM base AS final

# Copy the tracer from build target
COPY --from=build /tmp/datadog-dotnet-apm.deb /tmp/datadog-dotnet-apm.deb
# Install the tracer
RUN mkdir -p /opt/datadog \
    && mkdir -p /var/log/datadog \
    && dpkg -i /tmp/datadog-dotnet-apm.deb \
    && rm /tmp/datadog-dotnet-apm.deb

# Enable the tracer
ENV CORECLR_ENABLE_PROFILING=1
ENV CORECLR_PROFILER={846F5F1C-F9AE-4B07-969E-05C26BC060D8}
ENV CORECLR_PROFILER_PATH=/opt/datadog/Datadog.Trace.ClrProfiler.Native.so
ENV DD_DOTNET_TRACER_HOME=/opt/datadog
ENV DD_INTEGRATIONS=/opt/datadog/integrations.json

WORKDIR /app
COPY --from=publish /app/publish .
ENTRYPOINT ["dotnet", "DatadogFargateExample.dll"]
The Dockerfile uses multi-stage builds to optimize the build process and ensure compatibility with Visual Studio so you can debug issues locally via Visual Studio’s container tools. You can check out Microsoft’s documentation for details.
There are four build stages in the Dockerfile above: base, build, publish, and final. The mcr.microsoft.com/dotnet/aspnet:5.0 Docker image in the base stage is based on the Debian operating system and serves as the main image to run the application in the final stage.
In the build stage, the Dockerfile uses the mcr.microsoft.com/dotnet/sdk:5.0 Docker image to first download the latest version of the Datadog .NET tracer (this image has the curl utility needed to download the tracer) then build the DatadogFargateExample project. To use a specific version of the tracer, you can remove the RUN TRACER_VERSION step from the Dockerfile and set the TRACER_VERSION environment variable via a build argument instead.
The publish stage publishes the project and its dependencies to the /app/publish directory for deployment, and the final stage installs and enables the tracer with the necessary file configurations and environment variables to auto-instrument your application. This allows the tracer to submit data to the Agent, which we will install via an ECS task definition in a later section.
You can build your Docker image and launch the container locally using the following commands:
docker build -t test/datadog-fargate-example -f ./DatadogFargateExample/Dockerfile .
docker run --rm --name datadog-test -p 8080:80 datadog-fargate-example
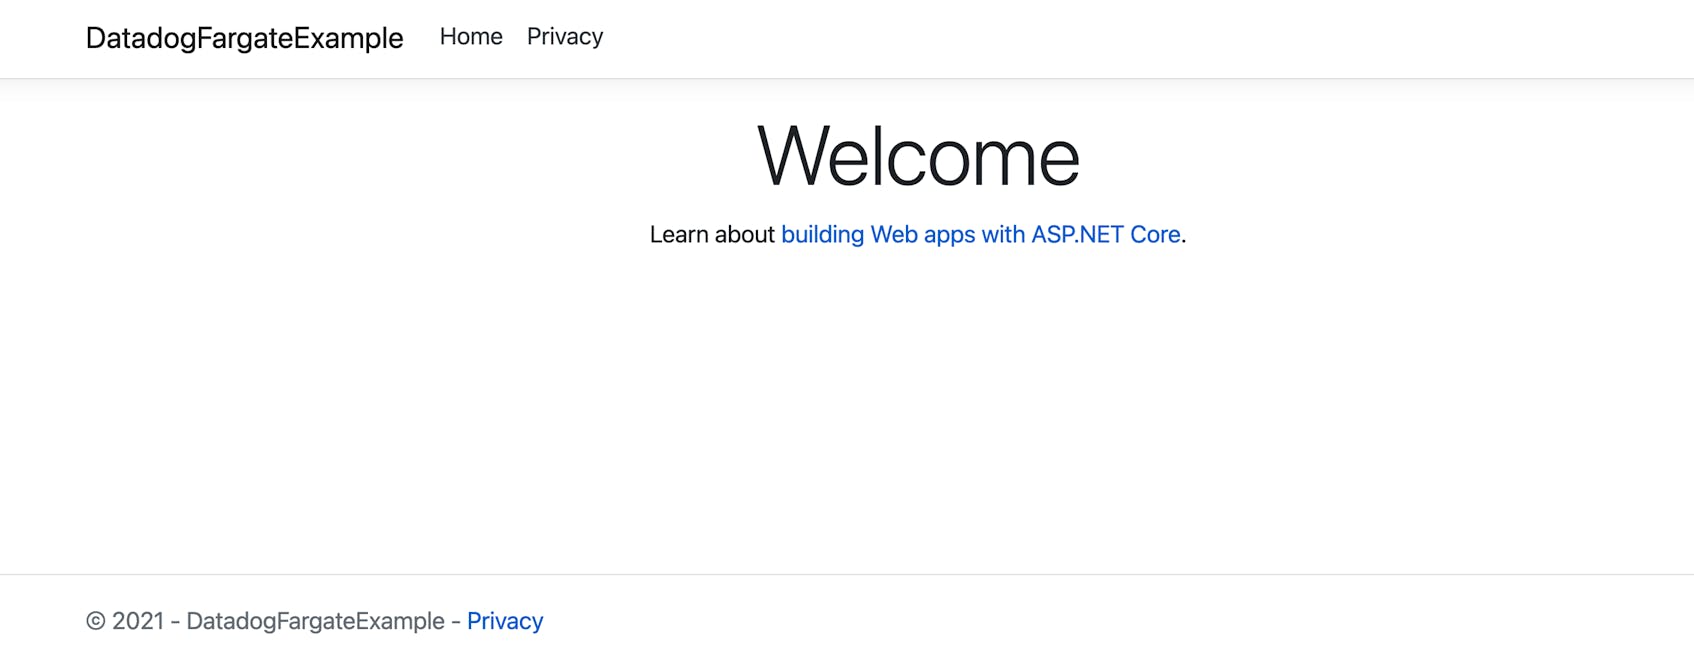
The test/datadog-fargate-example tag allows you to easily push the image to a container registry platform or pull it as a source image for a container deployed via Fargate. Once your container spins up, you can view your instrumented application by navigating to http://localhost:8080/.
Publish your image to Docker Hub
You can push the Docker image to a container registry platform like Docker Hub using the following command:
docker image push test/datadog-fargate-exampleThis publishes the image to the registry so you can use it in other environments or platforms. We’ll look at how to use the published image to deploy your .NET application via Fargate next.
Deploy a containerized .NET application with AWS Fargate
AWS Fargate is a service that enables you to run Amazon Elastic Container Service (Amazon ECS) tasks or Amazon Elastic Kubernetes Service (Amazon EKS) containers without needing to manage any underlying infrastructure. For this guide, we’ll look at leveraging Fargate with ECS by creating:
Create an Amazon ECS cluster
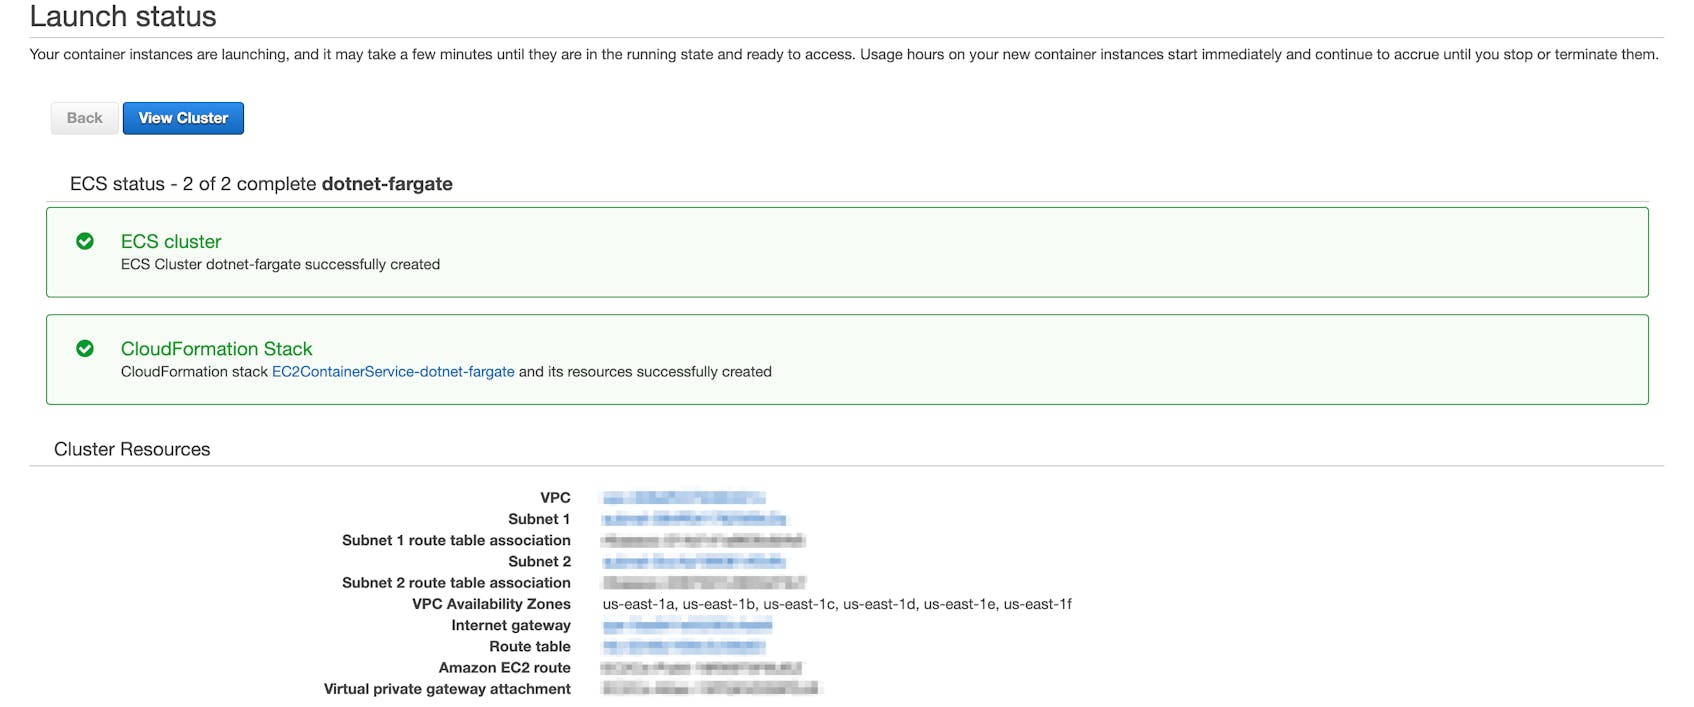
A core part of the ECS infrastructure is the cluster, which is a group of tasks and services necessary for deploying an application. You can create an ECS cluster by navigating to the Amazon ECS console in your AWS account. Select “Networking Only” as the cluster template and use the default values for the remaining configuration settings. Once provisioned, you can view your new cluster by clicking the “View Cluster” button on the “Launch status” page.
Next, we’ll walk through how to add the Datadog Agent and the application container you published to Docker Hub to the new cluster.
Create an ECS task definition
ECS clusters use task definitions to specify which containers should be created as part of a deployment. For this guide, we will add two containers to the task definition. The first will run the containerized Datadog Agent and the second your instrumented application. You can check out our documentation for detailed steps on creating a new task definition with a Datadog Agent container, but we will highlight some of the key container configurations below.
Create the Datadog Agent container
The first container uses the datadog/agent:latest image to run the Agent, which will gather data from the .NET tracer and host and submit it to Datadog. The Agent image uses environment variables (seen below) to enable APM and listen for non-local traffic, which is required when the Agent and application are running in different containers. It also uses a DD_API_KEY environment variable for connecting the Agent to your Datadog account—your unique API key can be found in your account’s settings.
Create the application container
You can use the same steps to create the second container, which will launch the instrumented application and use the Agent container as a startup dependency. Make sure that you set the image name to the name of the application container on Docker Hub (e.g., datadog-fargate-example) and, under “Port mappings,” add port 80 over TCP, which is the port we defined in the application’s Dockerfile. There are also a few environment variables that you will need to add to the “Advanced container configuration” section, as seen in the screenshot below.
These variables configure the Agent to collect the following data from your application:
DD_ENV,DD_VERSION,DD_SERVICE: sets theenv,version, andservicetags on traces for Unified Service TaggingDD_TRACE_ROUTE_TEMPLATE_RESOURCE_NAMES_ENABLED: enables improved resource names for ASP.NET Core endpointsDD_RUNTIME_METRICS_ENABLED: enables runtime metrics for the .NET runtime like thread counts and garbage collection (GC) pressure
Finally, in the “Startup Dependency Ordering” section, add the Agent container as a dependency by setting the “Container name” to datadog-agent and the “Condition” to “START”.
In the next section, we will create an application load balancer (ALB) that can automatically route public network traffic to our Agent and application containers.
Create an application load balancer
Fargate supports several different types of load balancers for ECS, but we’ll use an ALB for this guide. Create a new load balancer by following steps in the AWS documentation. You can use the default values for most of the available configuration options, but there are a few new security group rules that you will need to create.
Load balancer security groups determine what traffic is allowed to access the load balancer. On the “Assign Security Groups” page, create a new security group with a rule that uses the TCP protocol on port 80 and 0.0.0.0/0, ::/0 as a custom source. This ensures that the ALB is accessible from the public internet.
Next, on the “Configure Routing” page, create a new target group that uses the “IP address” target type and the HTTP protocol on port 80. You can use / as the health check path. Complete the remaining steps to create your load balancer.
Once the ALB is created, make note of its DNS name (found in the “Description” tab for the load balancer) as you will need it to access your application. Next, we will create a service to launch the application and all of its resources.
Create an ECS service
The final step for deploying the Agent and .NET application is to create a new ECS service for the cluster. We can use this service to schedule and launch all of the necessary components to run the application, such as the load balancer we created previously and the containers defined in our task definition.
You can create a new service on the “Clusters” page of the Amazon ECS console. Select your ECS cluster and click the “Create” button in the “Services” tab. There are a few settings that you will need to configure for the service. First, make sure the service uses “Fargate” as the launch type and the task definition you created earlier. In the “VPC and security groups” section, use your application load balancer’s VPC, subnets, and security group. In the “Load balancing” section of the “Configure network” page, select the load balancer you created earlier and add the application container in the “Container to load balance” section. Finally, the “Production listener port” needs to use the existing “80:HTTP” listener and the “Target group name” needs to use the name of your application container that you defined in your task definition.
Once the service launches successfully, navigate to the service’s “Details” tab to view the security group and add a new inbound rule. The new rule should use “All TCP’’ as the type and your ALB security group as the custom source. This setting allows the ALB to route traffic to your cluster; without it, your cluster may restart repeatedly due to “failed health checks”.
After finishing these steps, you can use the DNS name associated with the ALB you created earlier to navigate to your application and generate traffic. Since the application is instrumented with the .NET tracer and configured to submit traces via the Agent, you will start seeing real-time performance data for your ECS cluster and .NET application in Datadog.
Monitor application performance with Datadog
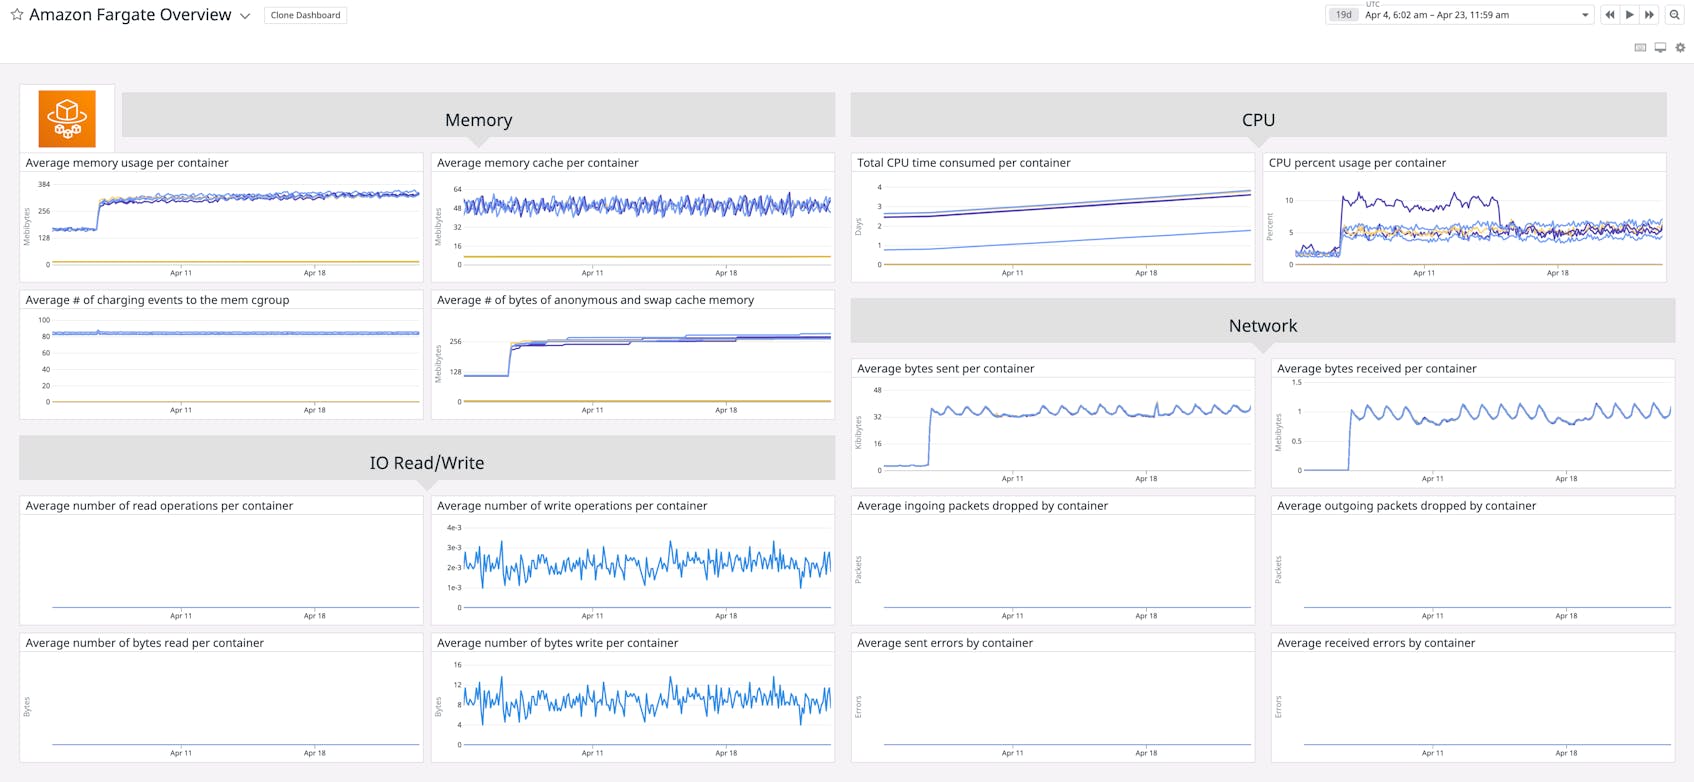
Datadog provides full visibility into the health and performance of your Fargate resources, such as the memory and CPU utilization of your ECS tasks. You can use the built-in integration dashboard to get a high-level overview of your Fargate environment and ensure that the underlying infrastructure supporting your .NET application is performing optimally.
The dashboard can alert you to significant changes in container performance, such as a sudden increase in memory usage for your application’s container, which you can troubleshoot further using Datadog APM.
Visualize traces with Datadog
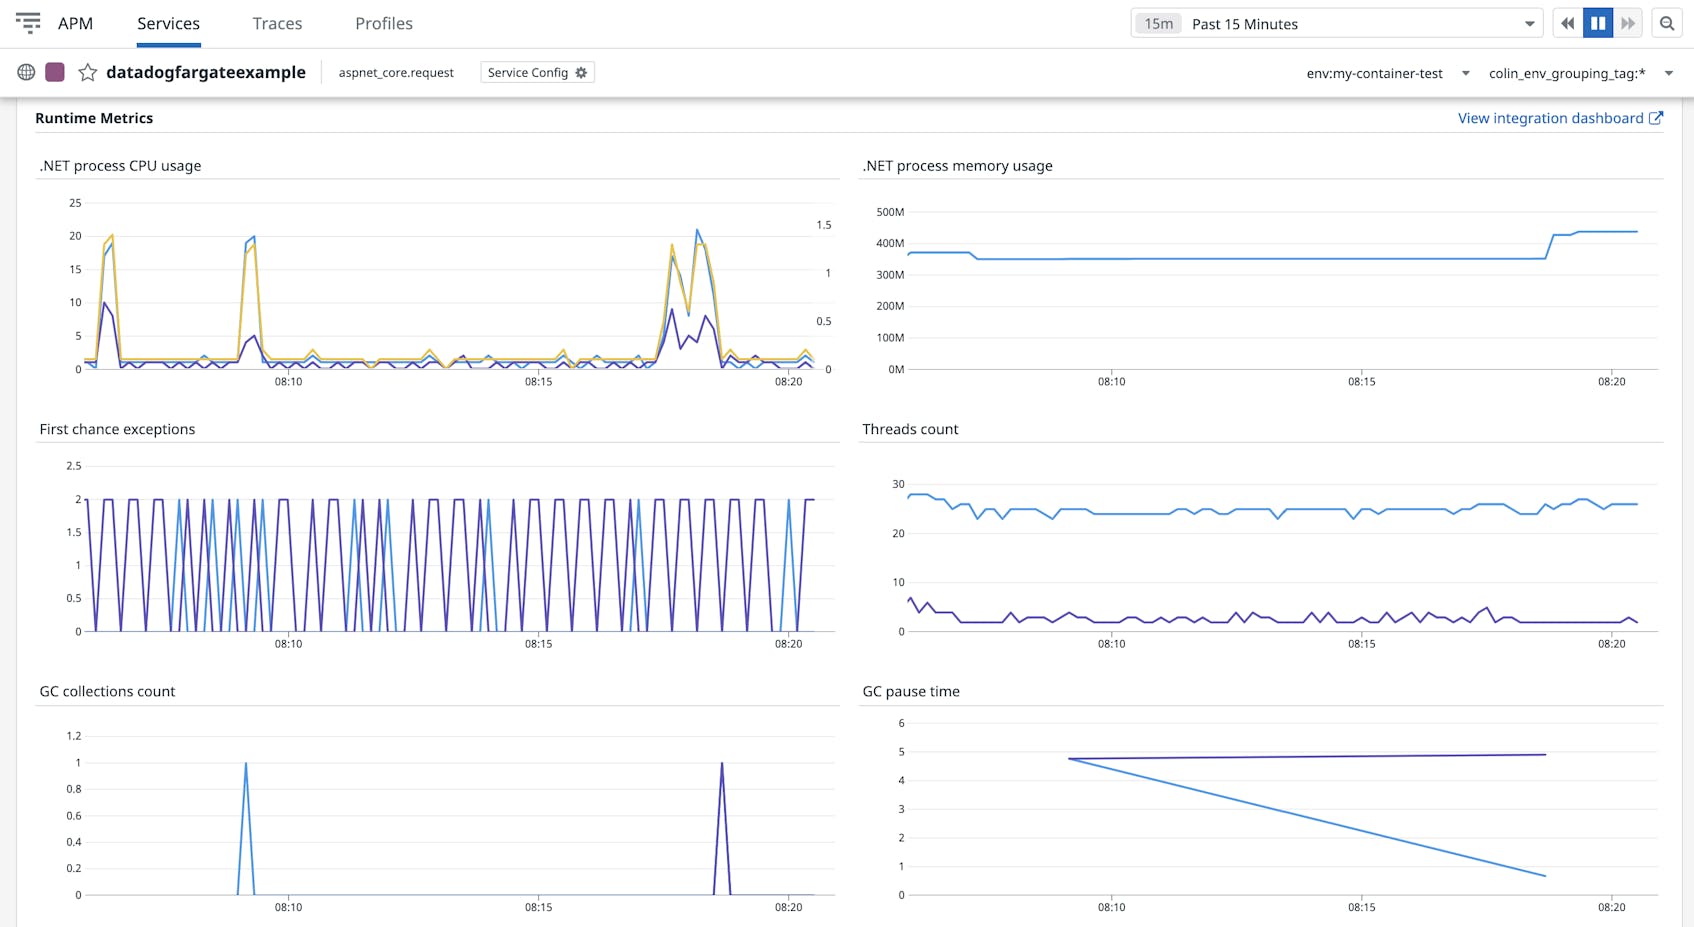
Datadog APM enables you to track distributed traces from your .NET application so you can get a better understanding of how application services process requests. To view your application’s traces, navigate to the service page in your Datadog account and locate the DatadogFargateExample service under the my-container-test environment, which reflects the values you set for your application container’s DD_SERVICE and DD_ENV environment variables. You can select that service to see a high-level overview of application performance and visualizations for key metrics, such as the total number of requests, errors, and request latency.
You can also view your application’s runtime metrics alongside trace data in order to troubleshoot common performance issues, such as first-chance exceptions, so you have more context for resolving the problem before it becomes more serious.
For even greater visibility into your application, you can connect .NET logs to your traces by automatically injecting trace and span IDs into your logs. This enables you to quickly pivot between your traces and .NET logs to get a better picture of what is going on in your application. You can also add custom instrumentation to your application’s business logic to monitor critical services, such as those that process payments, and ensure they are performing optimally.
.NET Core + AWS Fargate
In this post, we’ve shown how you can instrument a .NET Core application with Datadog’s .NET tracer and deploy it as a container via AWS Fargate. We also looked at how you can use Datadog to monitor application and infrastructure performance in one place. Check out our documentation for more information about tracing your applications and getting visibility into application performance, regardless of the environment or platform. If you don’t already have a Datadog account, you can sign up for a free trial.


