When you’re running databases at scale, finding performance bottlenecks can often feel like looking for a needle in a haystack. In any troubleshooting scenario, you need to know the exact state of your database at the onset of an issue, as well as its behavior leading up to it. But databases themselves do not store historical performance metrics, which makes it extremely difficult to identify trends and determine whether the issue is caused by inefficient queries, suboptimal database design, or resource saturation. Developers also typically need to dig into each database individually to investigate, which prolongs downtime and other customer-facing issues.
Today, we’re excited to announce the release of Database Monitoring, which delivers deep visibility into databases across all of your hosts. With historical query performance metrics, explain plans, and host-level metrics all in one place, developers and database administrators can easily understand the health and performance of their databases and quickly troubleshoot any issues that arise.
In this post, we’ll show you how Database Monitoring enables you to:
- See the performance of normalized queries at a glance
- Troubleshoot slow queries with detailed explain plans
- Analyze historical trends in query performance
- Explore and visualize sampled queries
- Detect infrastructure-level issues impacting your database
See the performance of normalized queries at a glance
Inefficient queries can deplete your database’s resources and block other queries from running, so it’s important to identify and optimize them in order to ensure your application remains performant. Databases aggregate similar query statements into normalized queries—in which literal values, such as names, passwords, and dates, are replaced with question marks—to generate statistics that help database administrators troubleshoot issues with query execution. But because databases do not provide a way to sort or filter normalized queries, it can be challenging to identify the most problematic ones.
Database Monitoring enables you to track the performance of normalized queries across all of your hosts in a summary graph and sortable list, so you can see at a glance which types of queries are executed the most, how long they’re taking, how many rows are returned, and more. This helps you identify, for instance, if there are any long-running queries that return only a small number of rows, which could be a sign that your data is not indexed properly. You can also drill down to a smaller subset of queries using tags like service, host, and cluster_name to create a more focused view for your investigation.
Troubleshoot slow queries with detailed explain plans
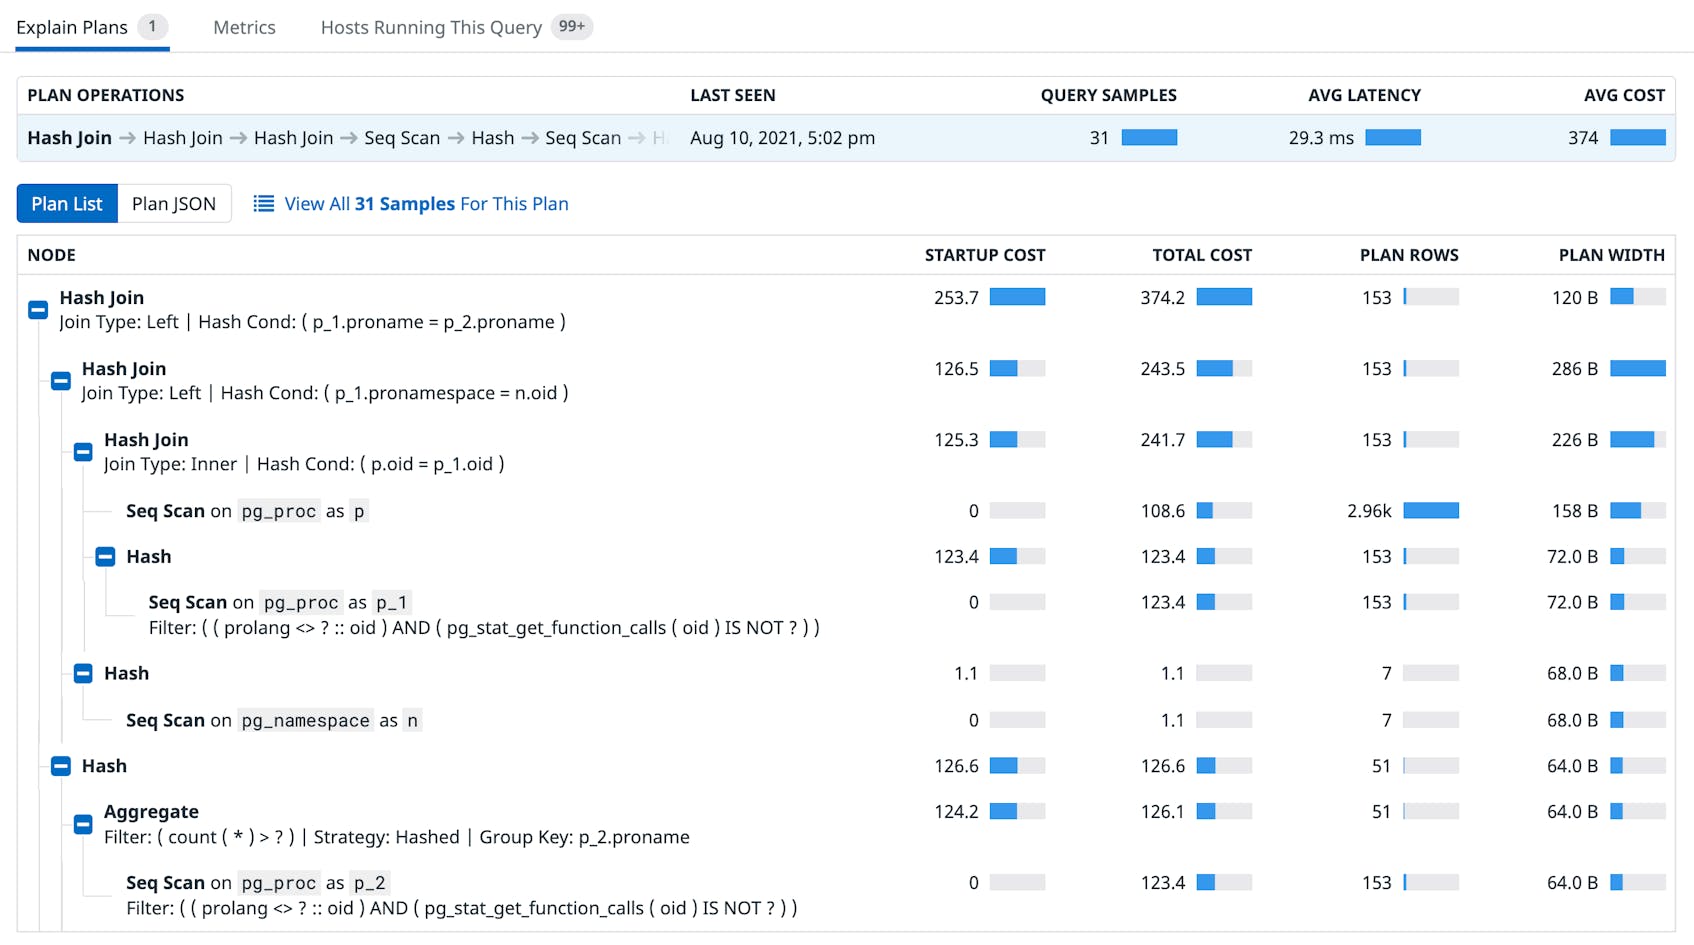
If you notice that a particular normalized query is taking a long time to execute, you can click on it to open the Query Details panel, which includes detailed explain plans (also known as execution plans) for that particular query. An explain plan uses a node tree to map the sequence of steps chosen by the query planner to execute the query. Each node in the tree represents a single operation such as a table scan, sort, join, or aggregation.
In Database Monitoring, you can see the estimated cost of running each node, as well as the number of rows and bytes expected to be returned, which can help you identify operation hotspots. For instance, if your plan includes a costly sequential scan, you might want to consider creating indexes on important columns to encourage the database to use an index scan instead. Explain plans also show you how table joins are performed (i.e., which joins are used and in which order) so you can adjust your query if the query planner has selected a suboptimal plan.
Analyze historical trends in query performance
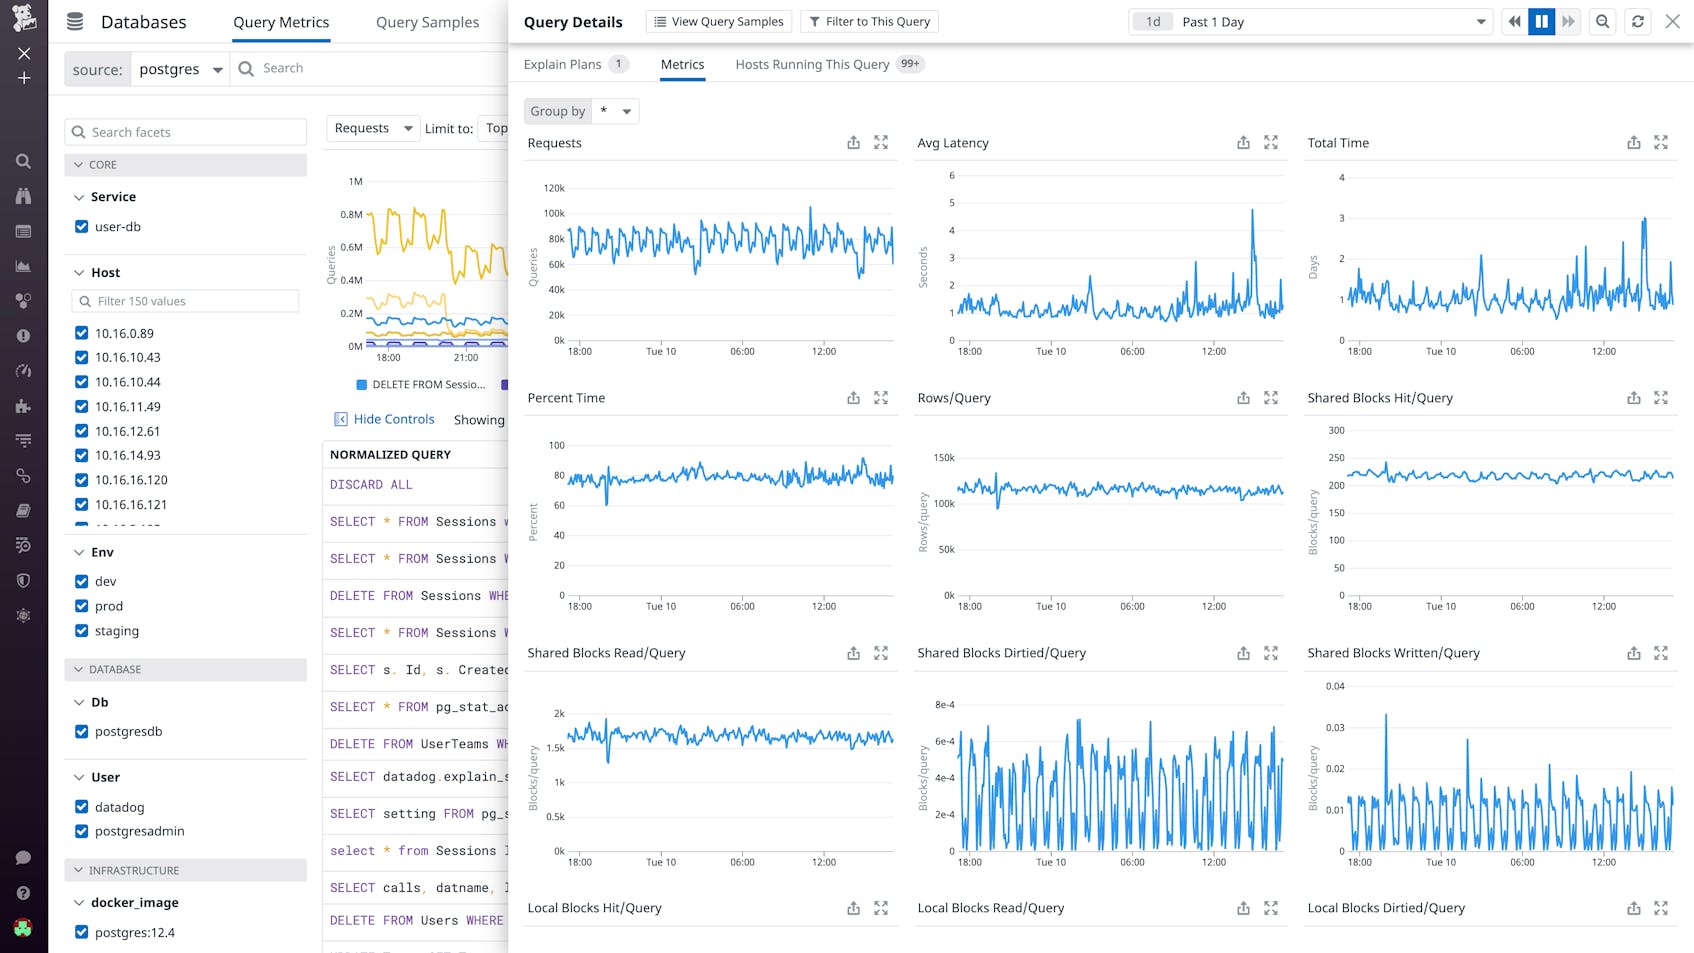
Historical performance data provides crucial insight into changes in database behavior and the efficacy of your optimizations, but the database itself can only report statistics on its present state. Database Monitoring addresses this issue by providing timeseries graphs for key performance indicators of normalized queries, such as total execution time, number of requests, and shared block activity. These metrics, which are available in the Metrics tab of the Query Details panel, are stored at full granularity for three months, allowing you to track performance trends over the long term. You can easily add these graphs to any dashboard, such as your MySQL or PostgreSQL dashboards, and correlate them with higher-level metrics like throughput, replication, and connections for a more comprehensive view of your database’s performance.
You can also set up automated alerts on any query metric to stay ahead of potential issues. For instance, you can create an anomaly monitor that will notify you if any query to your production cluster takes unusually long to execute, as shown in the screenshot above.
Explore and visualize sampled queries
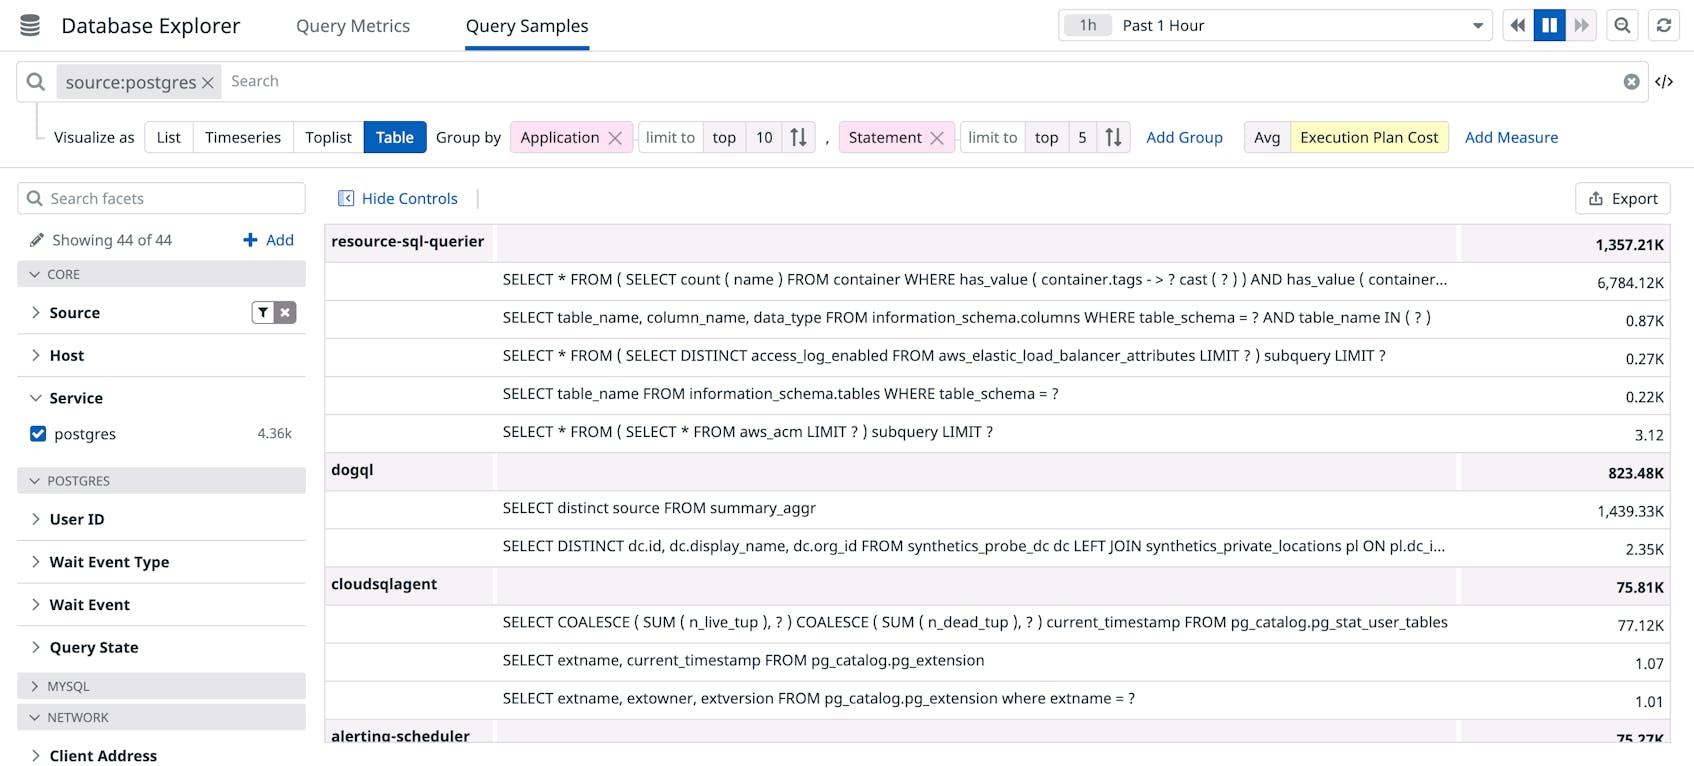
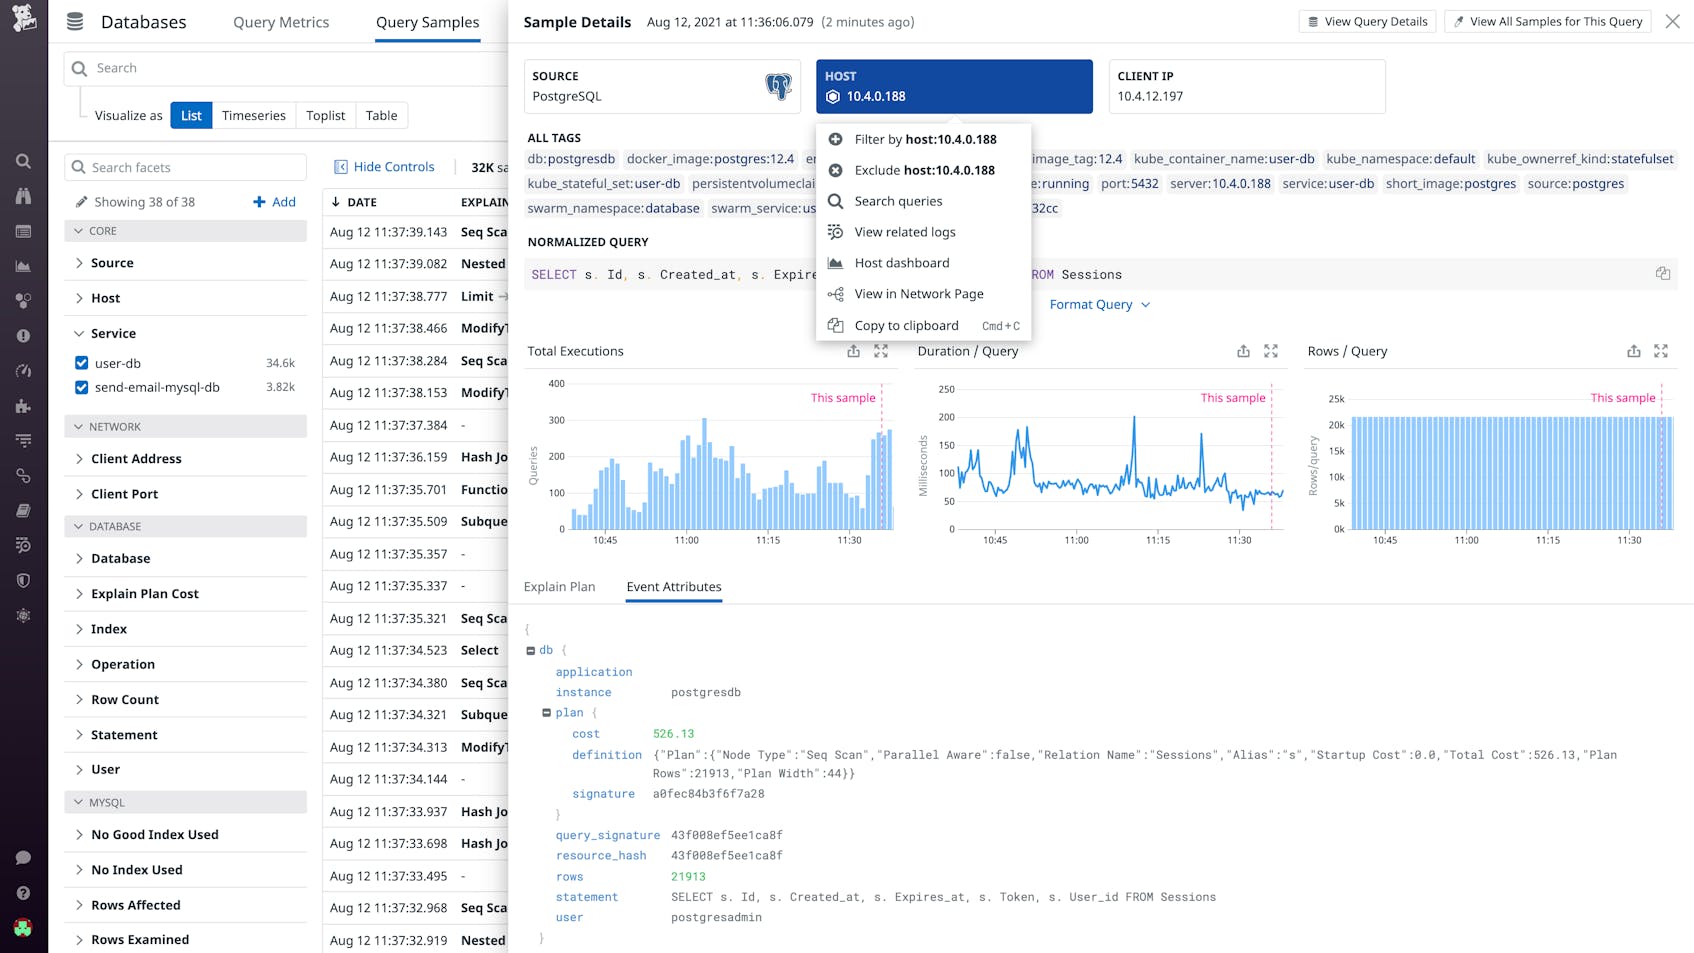
While normalized queries give you a high-level overview of database performance, sampled queries provide more granular insights. Datadog periodically collects a random sample of queries from all your databases—and enables you to see where each sample query was executed (i.e., on which host or application), along with other details such as its duration, cost, and explain plan. Datadog also converts sample query metadata into tags, which you can use to search, filter, and visualize individual queries when troubleshooting an issue or performing open-ended exploration. For example, you can use a table to group your most expensive queries by application in order to determine which ones you should optimize first.
Detect infrastructure-level issues impacting your database
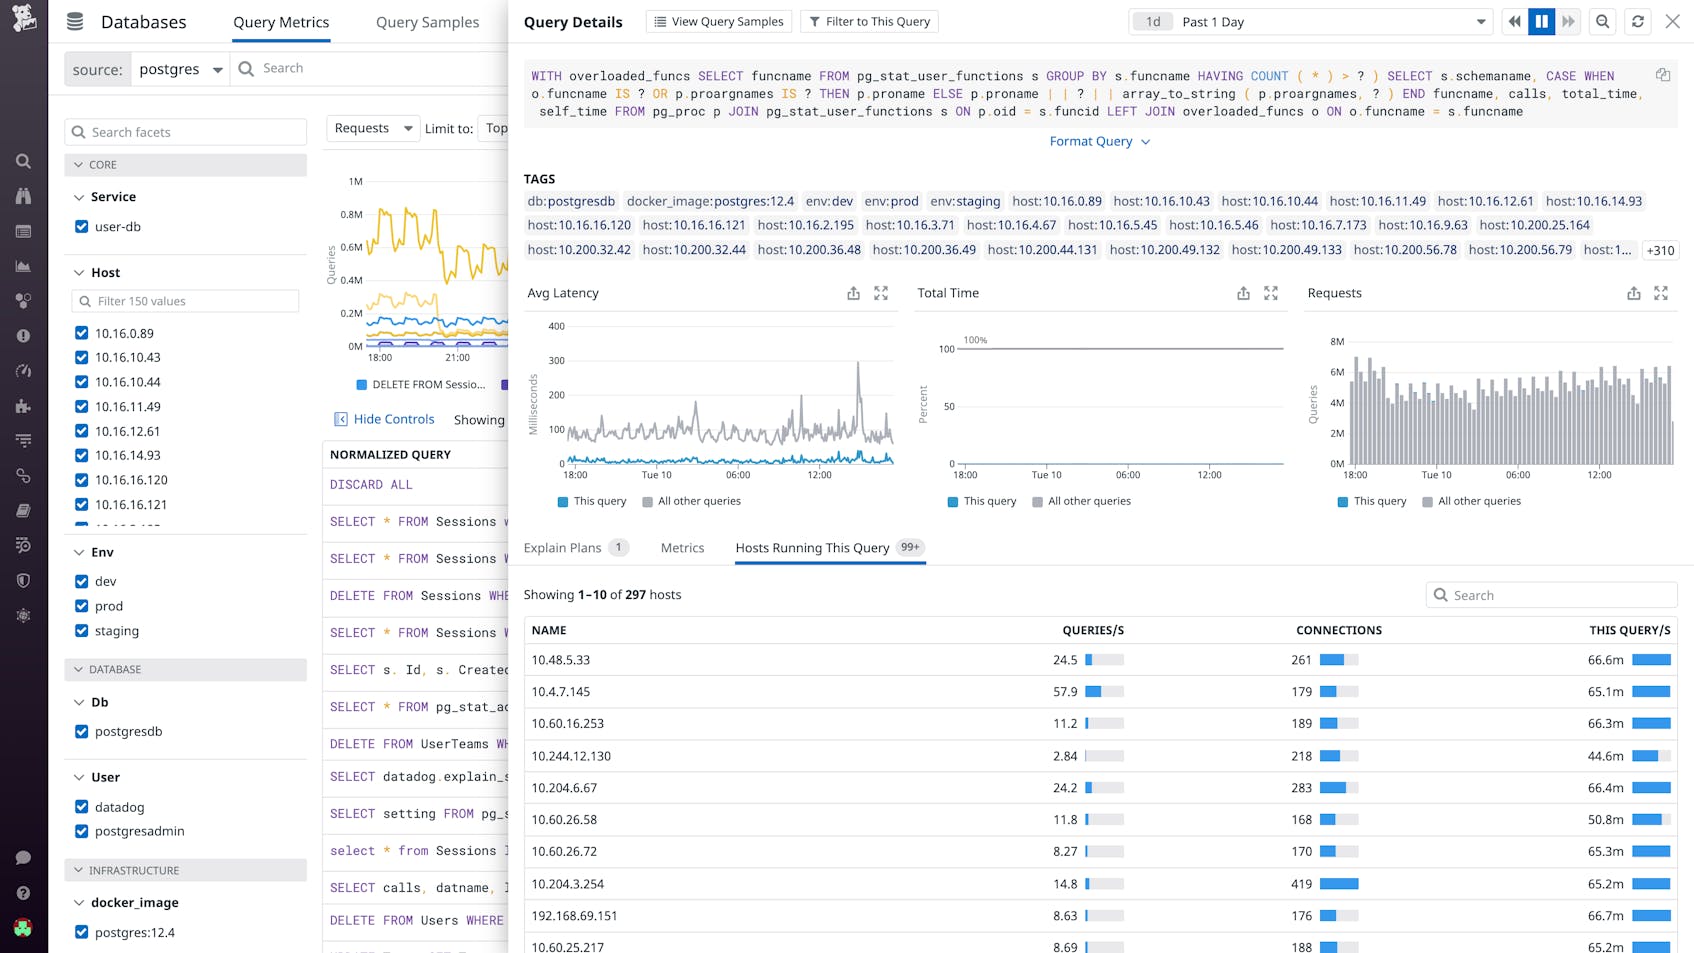
Query optimization can resolve some database issues, but others may be rooted in the underlying infrastructure. Database Monitoring automatically correlates normalized queries with host metrics to help you easily identify resource bottlenecks that degrade the performance of your databases. In the Query Details panel, you can see which of your hosts are running that normalized query, along with throughput and client connection metrics that indicate how busy those hosts are. If you see that a particular host is handling a disproportionate amount of traffic, you may need to adjust your load balancer or scale up your resources. To gather more context, you can click on the host and navigate to its default dashboard, which can be customized to include data from any part of your stack. Similarly, as you’re performing analysis in Query Samples, you can click on a sampled query and pivot to its host’s dashboard, logs, and network data for lower-level insights.
Start using Database Monitoring today
Datadog Database Monitoring tracks historical query performance metrics, explain plans, and host-level metrics from every database in your environment, so you can better understand their performance and troubleshoot issues effectively. Database Monitoring currently supports MySQL 5.6+ and PostgreSQL 9.6+ databases, regardless of whether they’re self-hosted or fully managed. Check out our documentation to learn how to get started. And if you’re not yet using Datadog, sign up for a 14-day free trial today.


