Modern applications rely on databases, making database performance and reliability essential. As systems grow in scale and complexity, identifying the impact and addressing the root causes of database performance issues—such as long query durations or missing indexes—becomes increasingly challenging.
Datadog Database Monitoring (DBM) Recommendations address these challenges by providing a clear, prioritized view of performance bottlenecks. By highlighting key signals and reducing noise, they help teams optimize database performance and resolve issues before they impact production, even in distributed or multi-cloud environments.
In this post, we’ll look at how DBM Recommendations:
- Surface key findings across database hosts and queries
- Prioritize issues by severity to focus on what matters most
- Offer detailed summaries and actionable next steps to drive improvements
Identify opportunities to enhance performance
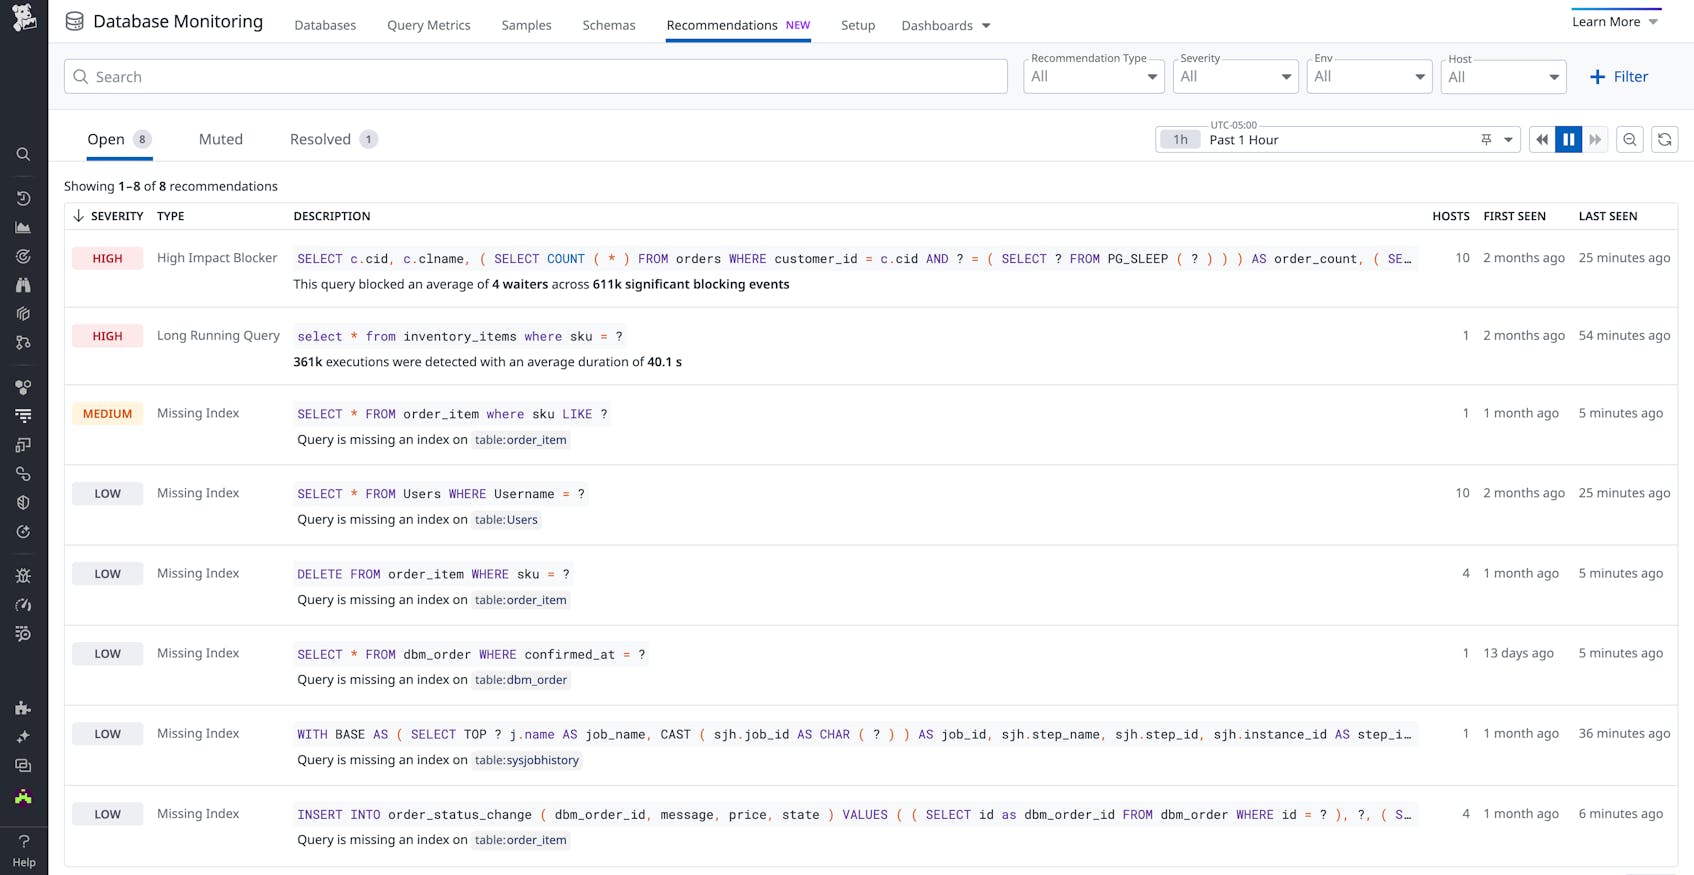
The Recommendations tab in DBM surfaces key findings—such as high-impact blocking queries, unused indexes, and low disk space alerts—and provides actionable steps to improve performance across databases. This centralized view allows teams to quickly pinpoint and address performance issues before they escalate.
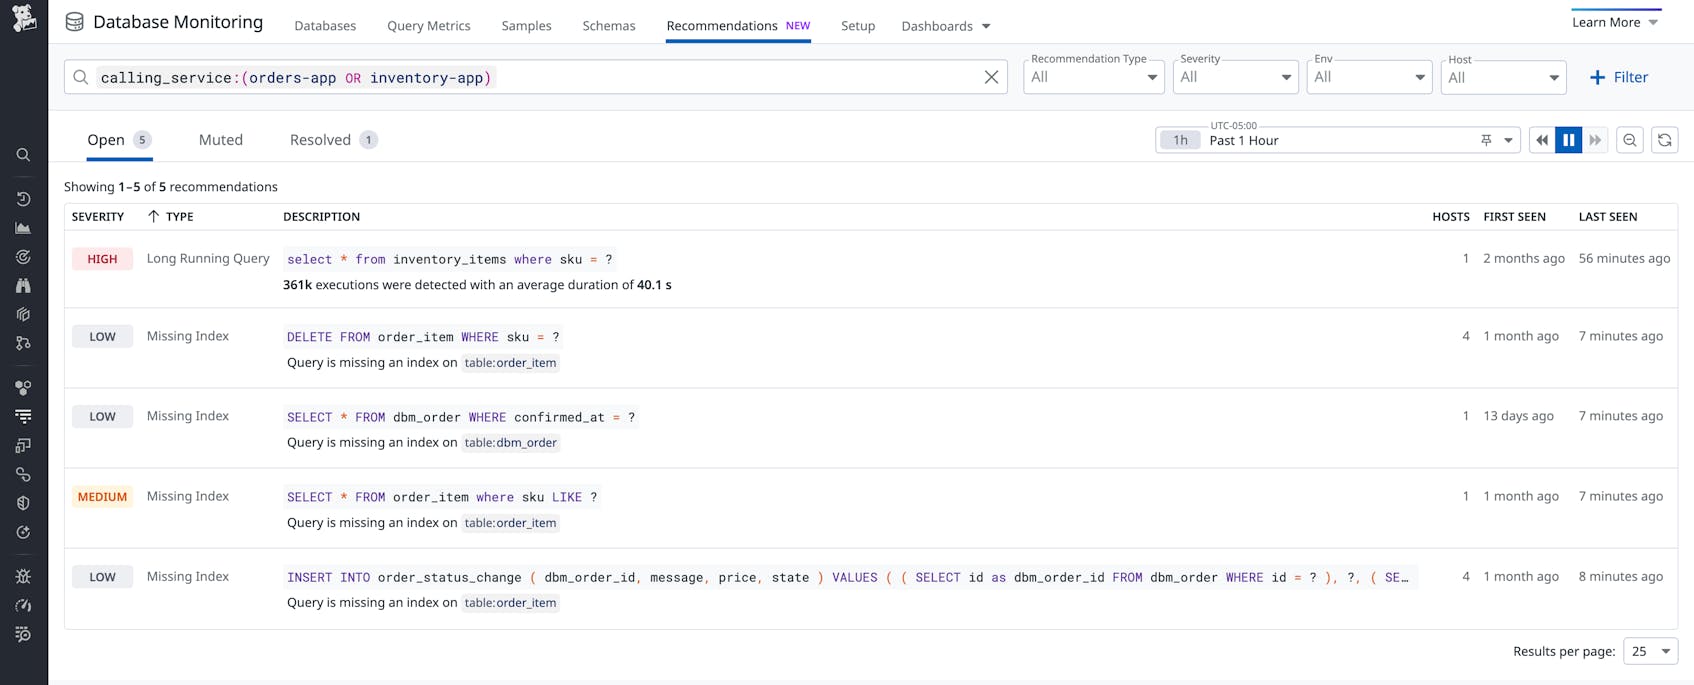
The ability to filter by calling service, powered by Datadog APM, helps application developers understand how their queries perform so they can collaborate more effectively with database administrators. This capability reduces reliance on database users or IPs, making it easier to identify query sources. DBM also supports filtering by recommendation type, severity, environment, and more, helping users focus on the most relevant information.
Let’s observe a specific recommendation card. High-impact blockers, like the one shown below, can be investigated further by viewing the affected waiting queries, identifying the involved hosts, and determining when the issue first occurred.
These findings are integrated across DBM, from host views to query views, enabling targeted troubleshooting in the Databases tab for host-level issues or Query Metrics for query-specific analysis. In the host detail, pictured below, clicking on a recommendation opens a detailed card with information about the problem and suggested next steps.
Recommendations are also available in the normalized query side panel, accessible from DBM’s Query Metrics tab.
By including these findings in multiple areas of the Datadog platform and providing guidance to address them, DBM Recommendations enable teams to proactively improve performance and maintain smooth database operations.
Prioritize what matters most
Not all database events affect systems equally. With this in mind, DBM Recommendations assign a severity label to each finding, helping teams concentrate on areas where they can have the biggest impact.
For example, a flagged long-running query is marked as high-severity if the query accounts for a significant percentage of the total execution time compared to other queries on the same database host.
Users can suppress recommendations by muting or resolving them to reduce noise and focus on active priorities, with the option to revisit them later under the Muted and Resolved tabs.
By prioritizing items by severity and enabling users to organize recommendations, DBM ensures teams can focus on improvements that drive meaningful results.
Act on findings with details and suggested next steps
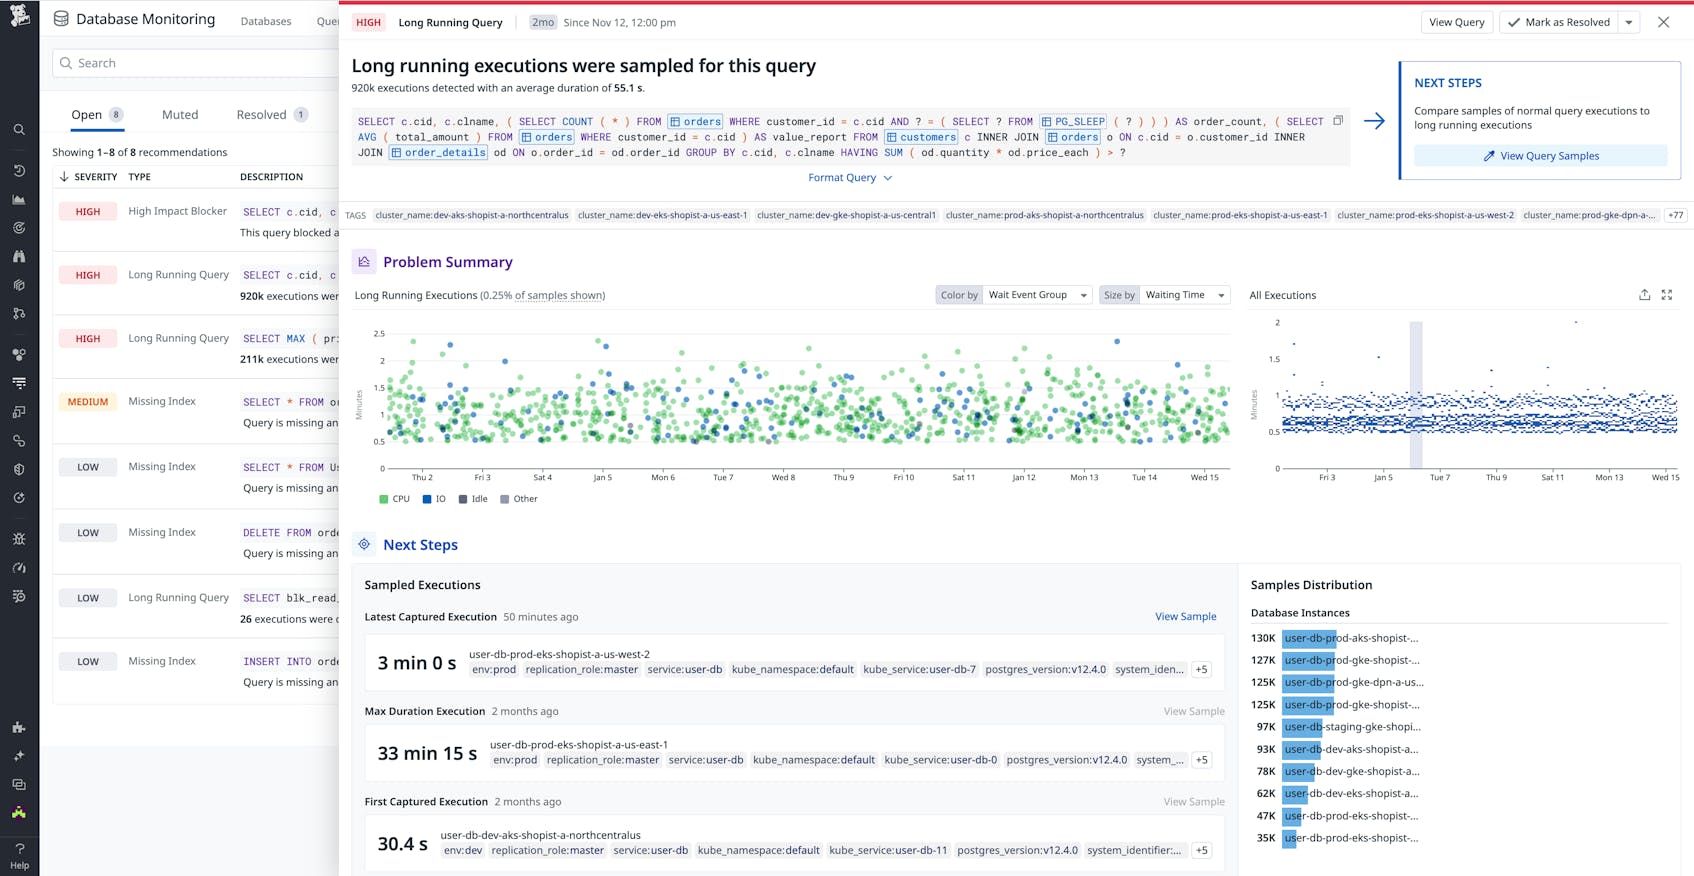
DBM Recommendation cards simplify complex database performance issues with detailed summaries, relevant telemetry, and practical guidance. These cards highlight important metrics and trends, showing how each event impacts database health and performance.
Flagged queries include details such as the frequency of blocking events, which queries are waiting, and how often durations are prolonged. Visualizations of execution trends, wait events, and query behavior across database hosts help teams connect findings to broader system performance, identify change in query behavior, and analyze deviations from normal baselines.
DBM Recommendations also provide next steps for each finding. For example, if a missing index is detected, the recommendation is to create an index to optimize query performance. When low disk space is flagged, the suggested action is to increase storage capacity. These steps give teams a clear path to resolution, reducing the time spent diagnosing issues and enabling faster fixes.
DBM also allows teams to create custom monitors based on recommendations, enabling alerts for query performance problems or high resource utilization. These monitors help teams address potential risks before they escalate.
By turning detailed findings into actionable recommendations, DBM helps resolve issues quickly, increase efficiency, and ensure optimal database performance.
Get started with Datadog DBM Recommendations
Datadog DBM enhances database monitoring by consolidating critical signals and helping teams prioritize the most impactful issues. By cutting through noise and highlighting important findings, DBM Recommendations empower teams to proactively improve database performance and stability.
Check out our documentation to get started with Datadog DBM Recommendations. If you’re not yet a Datadog user, sign up for a 14-day free trial today.


