This post is part 2 of a 3-part MySQL monitoring series. Part 1 explores key performance statistics in MySQL, and Part 3 explains how to set up MySQL monitoring in Datadog.
As covered in Part 1 of this series, MySQL users can access a wealth of performance metrics and statistics via two types of database queries:
- Querying internal server status variables for high-level summary metrics
- Querying the performance schema and sys schema for a more granular view
In this article we’ll walk through both approaches to metric collection. We’ll also discuss how to view those metrics in the free MySQL Workbench GUI or in a full-featured monitoring system.
Collecting server status variables
Out of the box, recent versions of MySQL come with about 350 metrics, known as server status variables. Each of them can be queried at the session or global level.
Each of the server status variables highlighted in Part 1 of this series can be retrieved using a SHOW STATUS statement:
SHOW GLOBAL STATUS LIKE 'Questions';
+---------------+-------+
| Variable_name | Value |
+---------------+-------+
| Questions     | 89537 |
+---------------+-------+
These statements also support pattern matching to query a family of related metrics simultaneously. To check metrics on connection errors, for instance:
SHOW GLOBAL STATUS LIKE '%Connection_errors%';
+-----------------------------------+-------+
| Variable_name                     | Value |
+-----------------------------------+-------+
| Connection_errors_accept          | 0     |
| Connection_errors_internal        | 0     |
| Connection_errors_max_connections | 15    |
| Connection_errors_peer_address    | 0     |
| Connection_errors_select          | 0     |
| Connection_errors_tcpwrap         | 0     |
+-----------------------------------+-------+
Server status variables are easy to collect on an ad hoc basis, as shown above, but they can also be queried programmatically and passed into an external monitoring system.
Querying the performance schema and sys schema
Enabling the performance schema
The performance schema stores performance metrics about individual SQL statements, rather than the summary statistics of the server status variables. The performance schema comprises database tables that can be queried like any other.
The performance schema is enabled by default since MySQL 5.6.6. You can verify that it is enabled by running the following command from a shell prompt:
mysqld --verbose --help | grep "^performance-schema\s"
In the output, you should see a line like this:
performance-schema TRUE
To enable the performance schema, add the following line under the [mysqld] heading in your my.conf file:
performance_schema
The configuration change will be picked up after server restart.
Performance schema queries
Once the performance schema is enabled, it will collect metrics on all the statements executed by the server. Many of those metrics are summarized in the events_statements_summary_by_digest table, available in MySQL 5.6 and later.
Metrics on query volume, latency, errors, time spent waiting for locks, index usage, and more are available for each normalized SQL statement executed. (Normalization here means stripping data values from the SQL statement and standardizing whitespace.)
You can query the performance schema using ordinary SELECT statements. For instance, to find the statement with the longest average run time:
SELECT digest_text
     , count_star
     , avg_timer_wait
  FROM events_statements_summary_by_digest
 ORDER BY avg_timer_wait DESC
 LIMIT 1;
+---------------------------------------+------------+----------------+
| digest_text                           | count_star | avg_timer_wait |
+---------------------------------------+------------+----------------+
| SELECT * FROM `employees` . `titles`  |          2 |   468854512000 |
+---------------------------------------+------------+----------------+
Here we see that one query, which has been executed twice, takes nearly half a second to complete on average. (All timer measurements are reported in picoseconds.)
A full sample row from this table can be found in Part 1 of this series, along with example queries to extract metrics on query run time and errors for each MySQL schema.
Installing the sys schema
Though you can query the performance schema directly, it is generally easier to use the sys schema. The sys schema contains easily interpretable tables for inspecting your performance data.
The sys schema comes installed with MySQL starting with version 5.7.7, but users of earlier versions can install it in seconds. For instance, to install the sys schema on MySQL 5.6:
git clone https://github.com/mysql/mysql-sys.git
cd mysql-sys/
mysql -u root -p < ./sys_56.sql
For MySQL 5.7, simply replace the file name in the final command with ./sys_57.sql.
If you prefer to work in a GUI, you can also install the sys schema using the MySQL Workbench tool.
Sys schema queries
The tables of the sys schema distill the information of the performance schema into a more user-friendly, readable form. Its ease of use makes the sys schema ideal for ad hoc investigations or performance tuning, as opposed to programmatic access.
The sys schema documentation provides detailed information on the various tables and functions, along with a number of useful examples. For instance, to summarize all the statements executed on each host, along with their associated latencies:
SELECT * FROM host_summary_by_statement_type;
+------+----------------------+--------+---------------+-------------+--------------+-----------+---------------+---------------+------------+
| host | statement            | total  | total_latency | max_latency | lock_latency | rows_sent | rows_examined | rows_affected | full_scans |
+------+----------------------+--------+---------------+-------------+--------------+-----------+---------------+---------------+------------+
| hal  | create_view          |   2063 | 00:05:04.20   | 463.58 ms   | 1.42 s       |         0 |             0 |             0 |          0 |
| hal  | select               |    174 | 40.87 s       | 28.83 s     | 858.13 ms    |      5212 |        157022 |             0 |         82 |
| hal  | stmt                 |   6645 | 15.31 s       | 491.78 ms   | 0 ps         |         0 |             0 |          7951 |          0 |
| hal  | call_procedure       |     17 | 4.78 s        | 1.02 s      | 37.94 ms     |         0 |             0 |            19 |          0 |
| hal  | create_table         |     19 | 3.04 s        | 431.71 ms   | 0 ps         |         0 |             0 |             0 |          0 |
...
+------+----------------------+--------+---------------+-------------+--------------+-----------+---------------+---------------+------------+
Note that in the table above, all timer measurements have been converted from raw picosecond counts to human-readable units.
See Part 1 of this series for examples of how to use the sys schema to surface slow-running queries or to find the source of errors.
Using the MySQL Workbench GUI
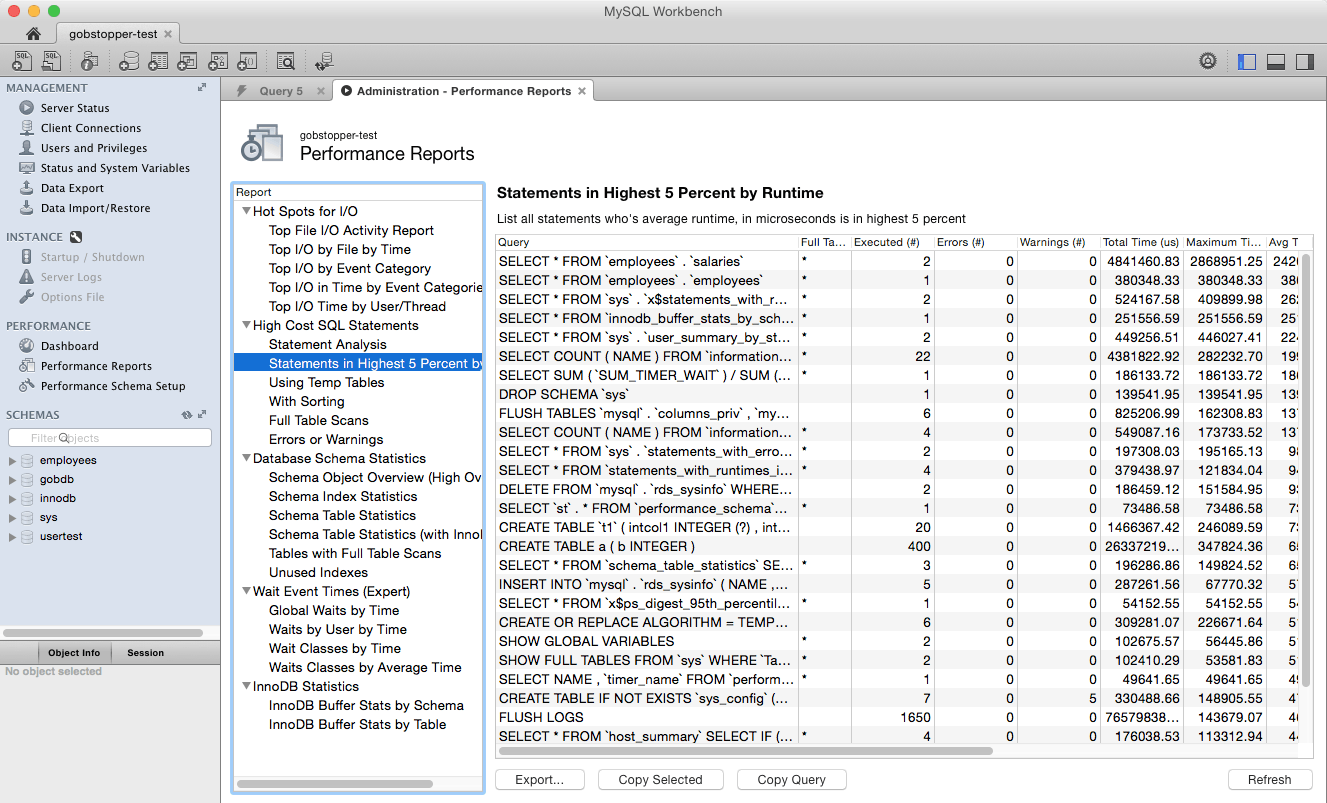
MySQL Workbench is a free application with a GUI for managing and monitoring a MySQL instance. MySQL Workbench provides a high-level performance dashboard, as well as an easy-to-use interface for browsing the performance metrics available from the sys schema.
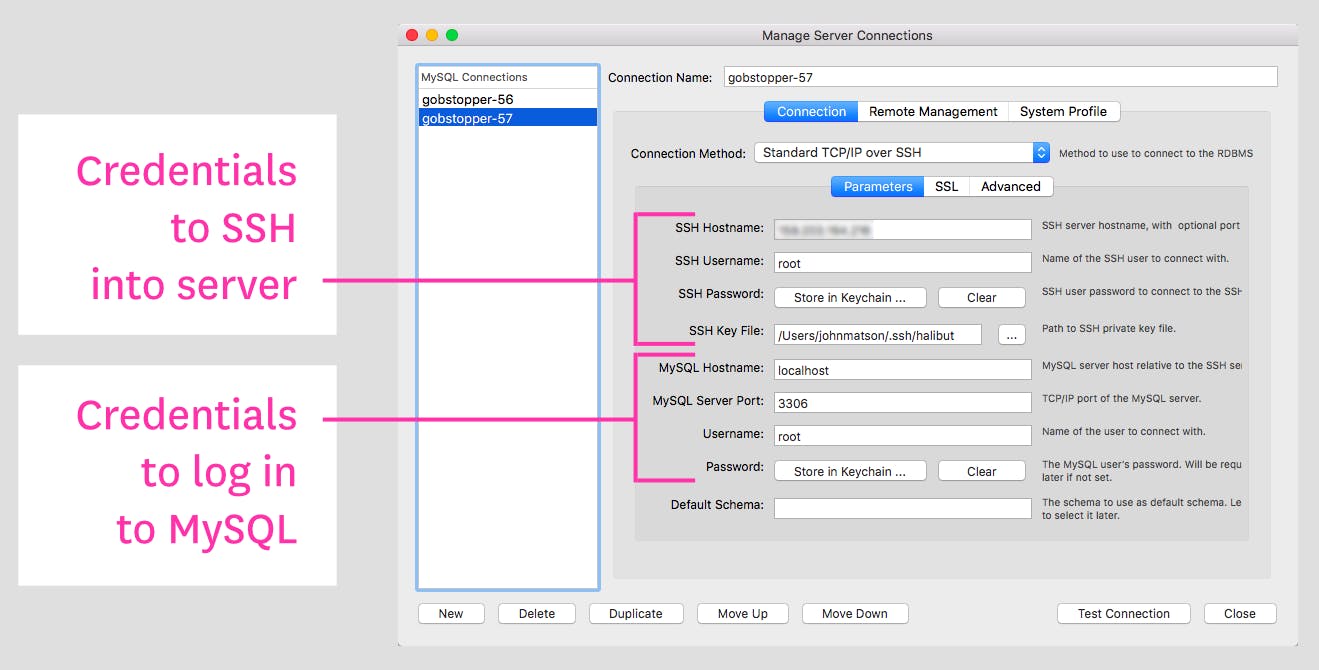
If you are running MySQL on a remote server, you can connect MySQL Workbench to your database instance via SSH tunneling:
You can then view recent metrics on the performance dashboard or click through the statistics available from the sys schema:
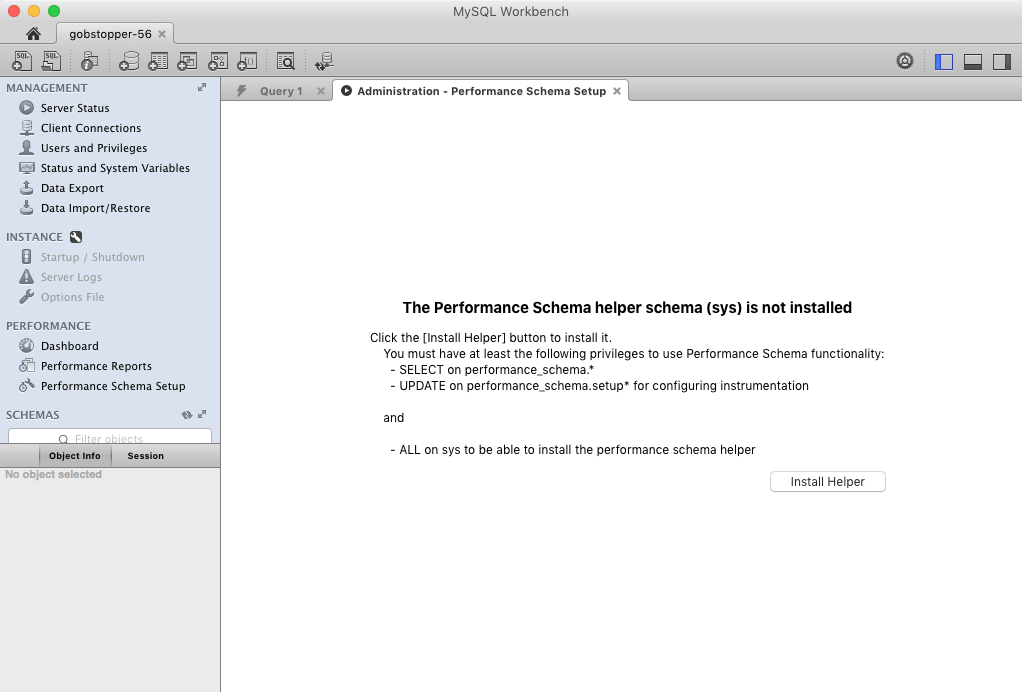
If you are using a version before MySQL 5.7.7 and you have not installed the sys schema, MySQL Workbench will prompt you to install it from the GUI.
Using a full-featured monitoring tool
All of the metric collection methods listed above are useful for ad hoc performance checks, investigation, and tuning. Some of these metrics can also be accessed programmatically—server status variables, in particular, can easily be queried and parsed at regular intervals. But to implement ongoing monitoring of a production MySQL database, you will likely want to use a full-featured monitoring tool that integrates with MySQL.
Mature monitoring platforms allow you to visualize and alert on real-time metrics, as well as view your metrics’ evolution over time. They also allow you to correlate your metrics across systems, so you can quickly determine if errors from your application originated in MySQL, or if increased query latency is due to system-level resource constraints. Part 3 of this series shows you how to set up comprehensive MySQL monitoring with Datadog.
Wrap-up
In this post we have shown you how to collect summary or low-level metrics from MySQL. Whether you prefer writing SQL queries or using a GUI, the approaches described above should help you gain immediate insight into the usage patterns and performance of your MySQL databases.
In the next and final part of this series, we’ll show you how you can quickly integrate MySQL with Datadog for continuous, comprehensive monitoring.


