Editor’s note (September 2021): This post has been updated to include new information about ActiveMQ Artemis.
In Part 1 of this series, we looked at how ActiveMQ works, the differences between ActiveMQ Classic and ActiveMQ Artemis, and the key metrics you can monitor to ensure proper performance of your messaging infrastructure, whichever version you’re using. In this post, we’ll show you some of the tools that you can use to collect ActiveMQ metrics. This includes tools that ship with ActiveMQ, and some other tools that make use of Java Management Extensions (JMX) to monitor ActiveMQ brokers, destinations, and addresses.
| Tool | Description | Metrics it collects |
|---|---|---|
| ActiveMQ command line tools | Scripts that are included with ActiveMQ | Limited broker and destination metrics |
| ActiveMQ Web Console | A GUI-based tool that’s included with ActiveMQ | Limited broker and destination metrics |
| JConsole | A GUI-based tool that’s included with the JDK and uses JMX to fetch metrics | Broker and destination metrics, JVM metrics |
| Hawtio | A GUI-based tool that uses JMX to fetch metrics | Broker and destination metrics, JVM metrics |
| Statistics plugin and management message API | Tools for fetching metrics as JMS messages | Broker and destination metrics |
ActiveMQ command line tools
ActiveMQ comes with scripts you can execute from a Windows or Unix-like command line interface (CLI) to retrieve basic metrics about your broker, destinations (in ActiveMQ Classic), and addresses (in ActiveMQ Artemis). The commands differ across platforms, and the ActiveMQ documentation for Classic and Artemis describes the syntax of the commands and their arguments.
ActiveMQ Classic CLI tools
ActiveMQ Classic’s bstat command shows you the number of messages enqueued and dequeued by each destination, as well as the TotalEnqueueCount and TotalDequeueCount broker metrics we looked at in Part 1 of this series. The example below shows an excerpt of the output of the bstat command on an Ubuntu host.
[...]
BrokerName = localhost
TotalEnqueueCount = 57100
TotalDequeueCount = 0
TotalMessageCount = 57100
TotalConsumerCount = 0
Uptime = 1 hour 6 minutes

Name = TEST_QUEUE
destinationName = TEST_QUEUE
destinationType = Queue
EnqueueCount = 57100
DequeueCount = 0
ConsumerCount = 0
DispatchCount = 0
[...]
You can use the dstat command to view most of the ActiveMQ Classic destination metrics from Part 1 of this series. The output below shows a sample of the statistics returned by the dstat command on an Ubuntu host. As you can see, the dstat output names these metrics differently than their JMX attribute names: ProducerCount appears in the Producer # column, ConsumerCount appears as Consumer #, QueueSize as Queue Size, and MemoryPercentUsage as Memory %.
[...]
Name		Queue Size	Producer #	Consumer #	Enqueue #	Dequeue #	Forward #	Memory %	Inflight #
TEST_QUEUE	57100	        1		0               57100           0		0               70              0
You can use bstat and dstat commands to view some of the key metrics we introduced in Part 1 of this series, but you won’t see data on metrics like ExpiredCount, StorePercentUsage, or TempPercentUsage. In the following sections, we’ll describe several other tools that provide more complete visibility into the performance of your ActiveMQ Classic broker and destinations.
ActiveMQ Artemis CLI tools
Artemis organizes messages into addresses, and each address comprises some number of queues. You can use Artemis’s queue command to see information about the queues that exist on the running broker. This command identifies the address each queue belongs to and shows the count of messages and consumers associated with that queue. It also reports each queue’s routing type, which determines the type of messaging it supports—point-to-point or pub/sub. The snippet below shows how you would use Artemis’s queue command to inspect queue0, a test queue that currently holds three messages.
./artemis queue stat --queueName queue0

Connection brokerURL = tcp://localhost:61616
|NAME                     |ADDRESS                  |CONSUMER_COUNT |MESSAGE_COUNT |MESSAGES_ADDED |DELIVERING_COUNT |MESSAGES_ACKED |SCHEDULED_COUNT |ROUTING_TYPE |
|queue0                   |queue0                   |0              |3             |3              |0                |0              |0               |ANYCAST      |
ActiveMQ Web Console
The ActiveMQ Web Console is an interactive, GUI-based tool that gives you an easy way to view metrics. Since it ships with ActiveMQ Classic and ActiveMQ Artemis, you don’t need to install anything to start using it. The Web Console operates on port 8161 by default, so your ActiveMQ host will need to be configured to accept connections on that port (or you can update your Classic or Artemis configuration to use a different port).
The main page of the ActiveMQ Classic Web Console—shown below—displays information about the broker’s memory usage, as well as store usage and temp usage. You can navigate the console using the tabs on the top of the page to see data from your destinations, including the number of pending messages and the number of consumers.
The ActiveMQ Classic Web Console shows most (but not all) of the broker and destination metrics we highlighted in our guide to key ActiveMQ metrics, plus information about some optional features like broker networks and scheduled messages. To get access to all of the metrics we covered in Part 1, and to view historical data about your JVM’s resource usage, you’ll need to directly query Java Management Extensions (JMX) by using a tool like JConsole.
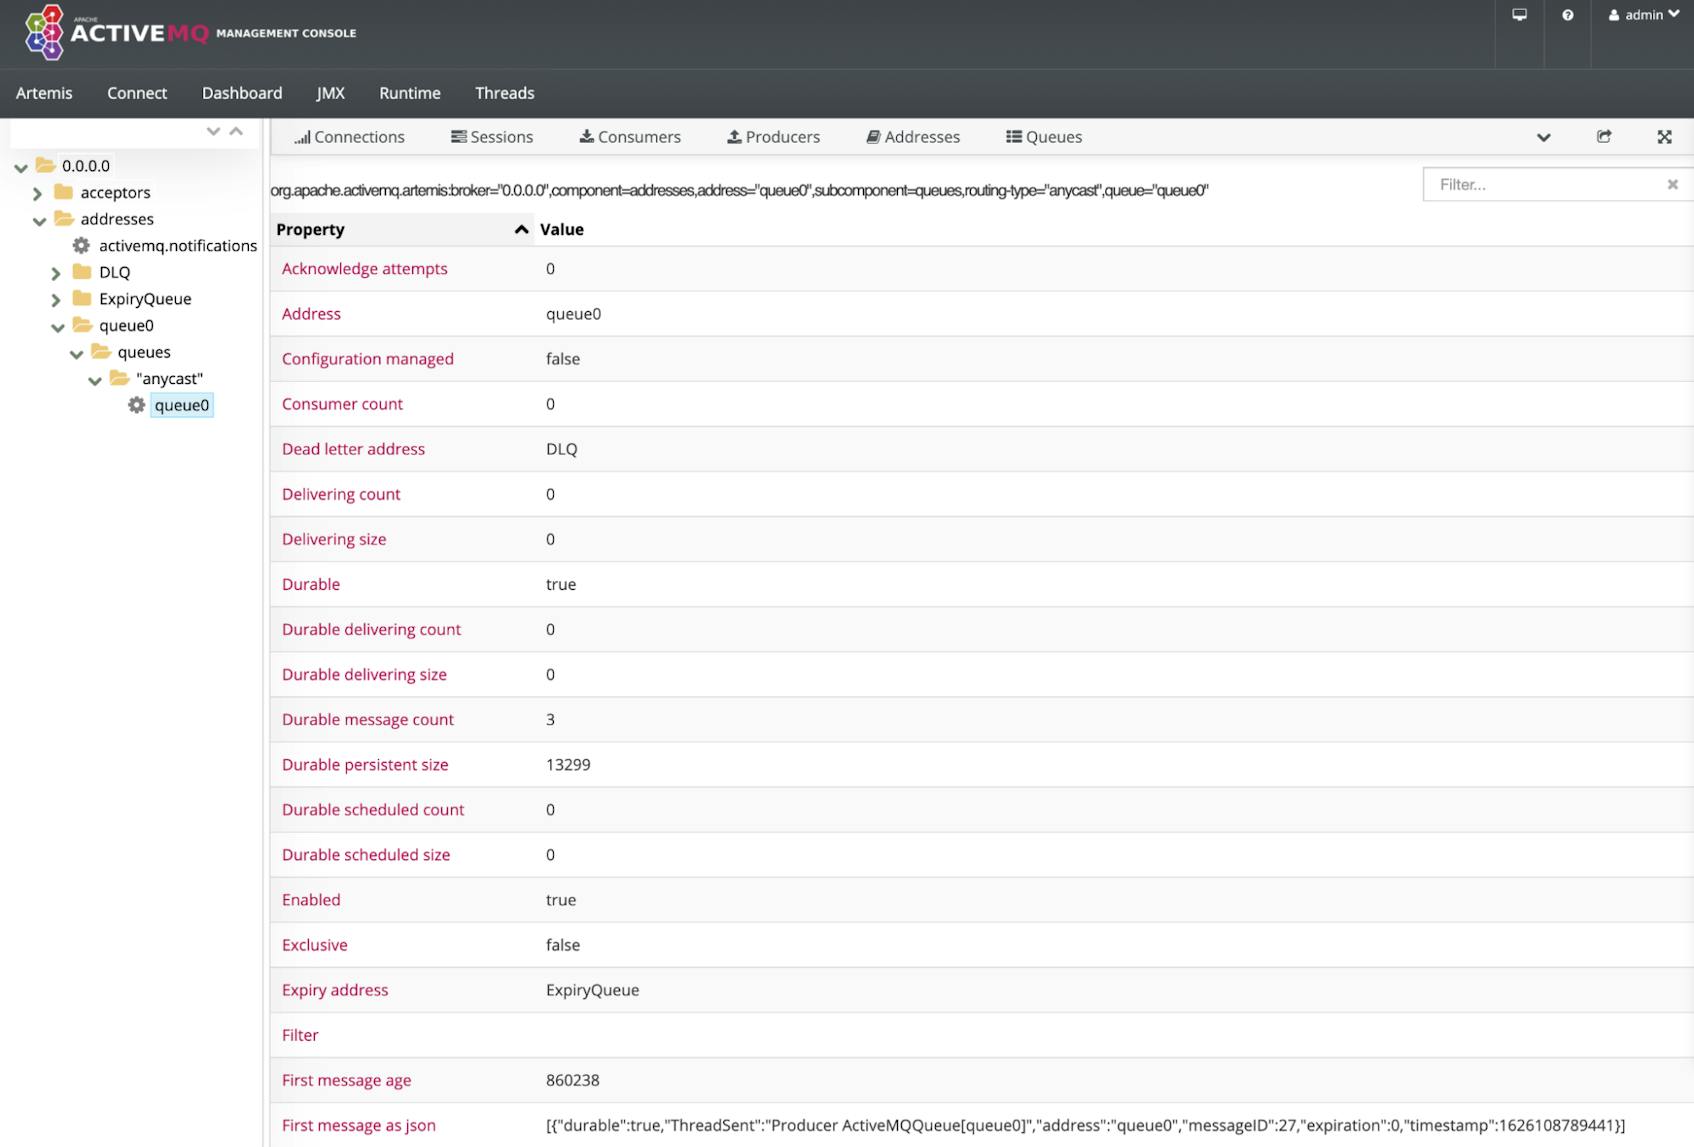
ActiveMQ Artemis uses an embedded instance of Hawtio to provide a similar Web Console that displays broker, address, and queue metrics. In the screenshot below, the Web Console shows configuration data and metrics from a queue named queue0 (which belongs to an address that is also named queue0).
Just as with the Classic version, Artemis provides metrics via JMX, so you can also use JConsole to inspect its performance and execute some operations on the broker. In the next section, we’ll describe how to configure ActiveMQ so you can access these metrics and operations via JConsole.
Collecting ActiveMQ metrics with JMX and JConsole
Like other Java applications, ActiveMQ exposes metrics through JMX. JConsole is an application you can use to monitor any Java app that implements JMX, including both versions of ActiveMQ—Classic and Artemis. JConsole is included in the Java Development Kit (JDK), and it can communicate with any Java application that provides MBeans: JMX-compliant objects that expose the app’s attributes and operations.
In this section, we’ll show you how to configure and launch JConsole, then we’ll look at how to use it to view ActiveMQ metrics.
Configuring ActiveMQ to allow remote monitoring via JConsole
JConsole is a GUI-based tool, so it requires a platform that provides a GUI environment in which it can run. Because your ActiveMQ infrastructure may not provide a GUI environment, and because JConsole is fairly resource intensive, you’ll often need to run JConsole on a machine other than your ActiveMQ host. To do so, you’ll need to configure your ActiveMQ host to allow remote access, which demands appropriate security considerations. See the Oracle or Apache documentation for guidance on configuring secure remote JMX access for production environments.
Launching JConsole
JConsole is included in the JDK, so you’ll need to install that on your client machine if you haven’t already. Launch JConsole from a command line by typing the full path to the JConsole program. In the example below, JConsole is installed in the /usr/bin/ directory. (See Oracle’s JConsole documentation for more information about launching JConsole.)
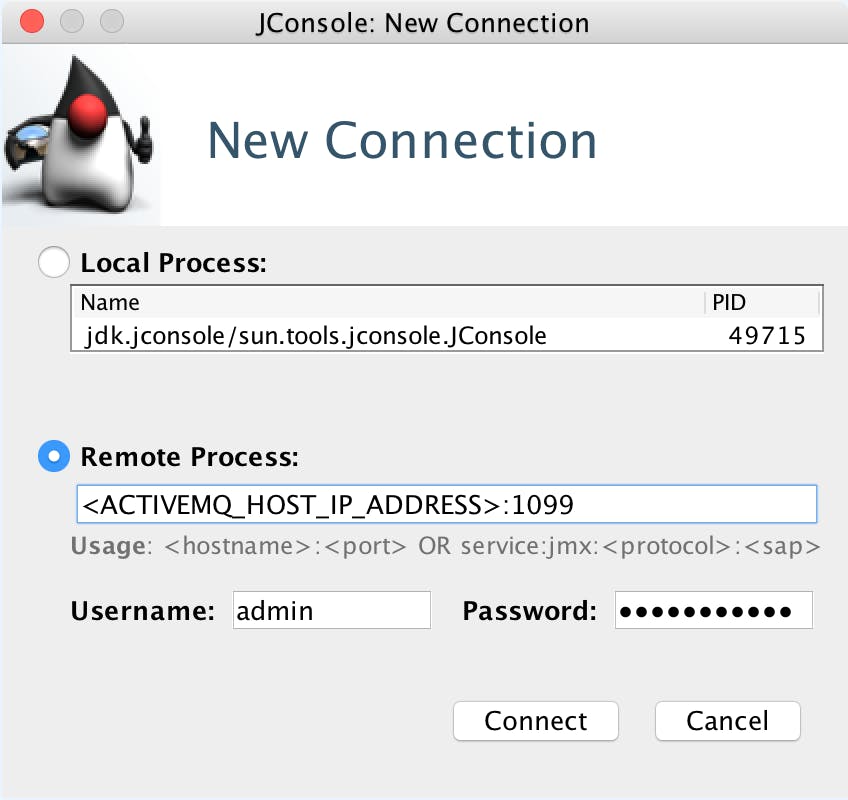
/usr/bin/jconsoleSelect Remote Process in the JConsole GUI and enter your ActiveMQ host’s IP address, followed by the port you configured for JMX access. Enter the username and password—if any—that your server requires for remote JMX access, then click Connect.
Viewing ActiveMQ metrics in JConsole
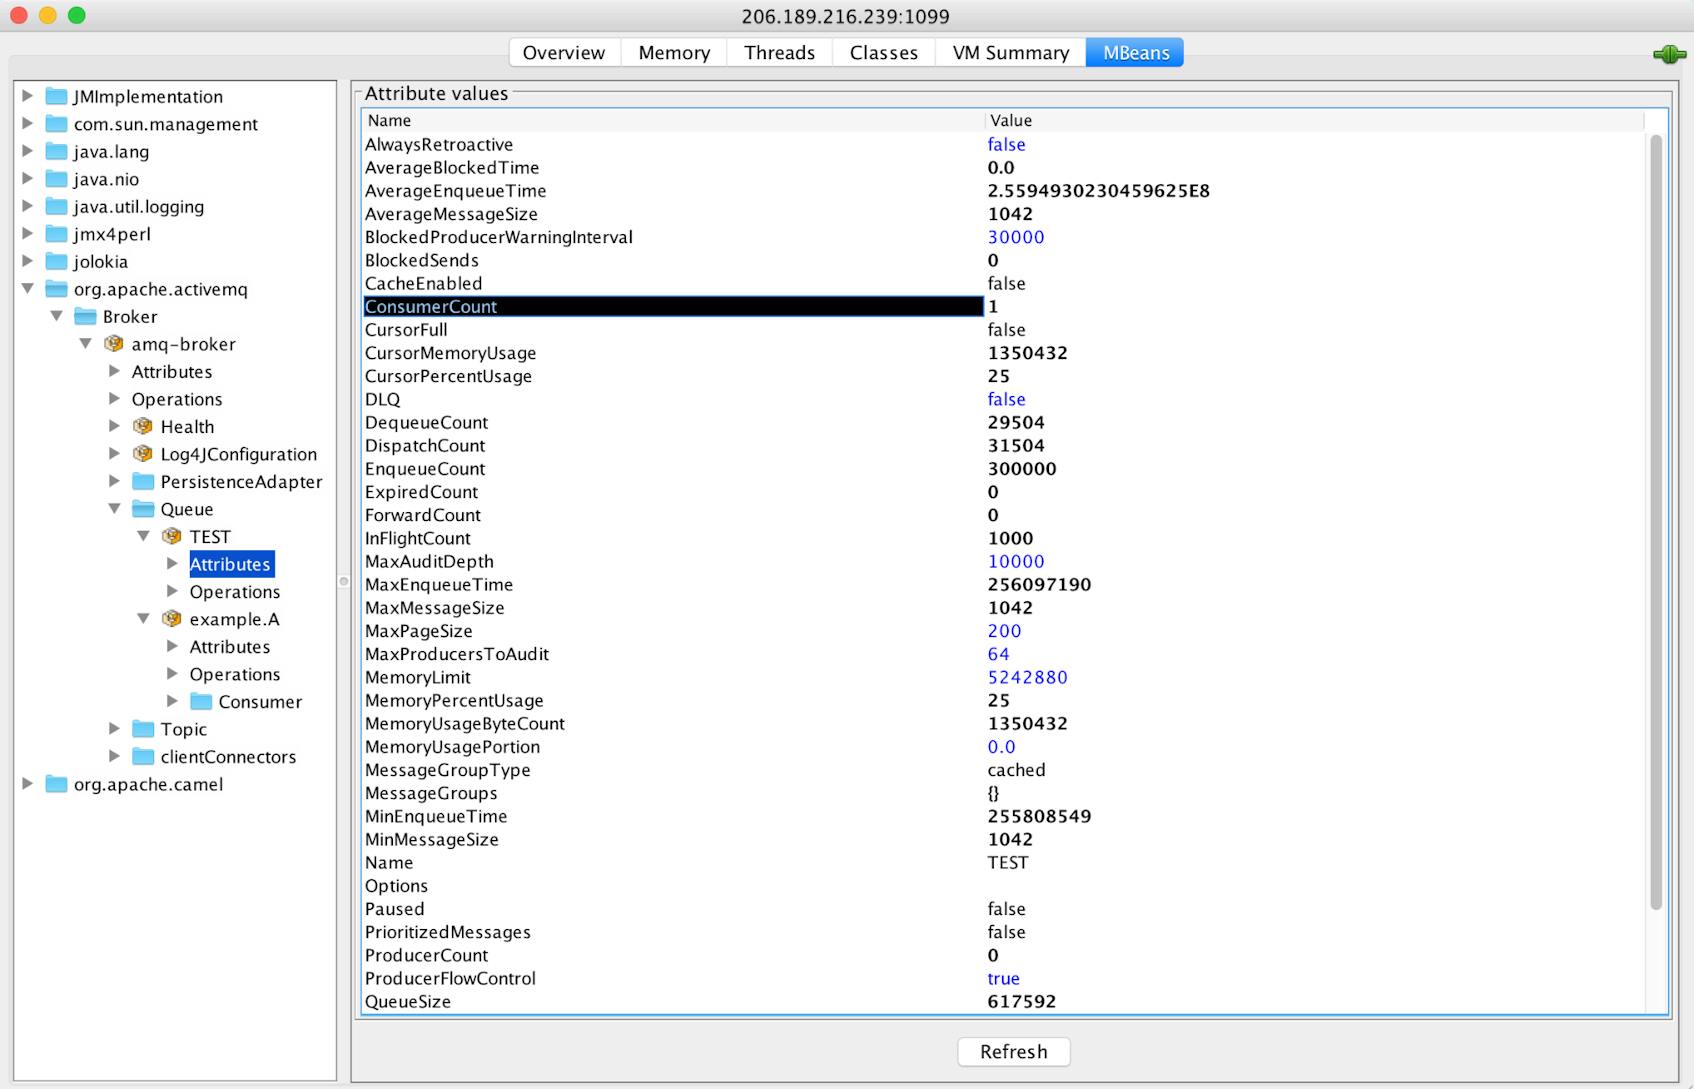
JConsole’s MBeans tab shows all the JMX sources available in the JVM, formatted as a tree. The top level of each JMX source is its domain, and below that are the MBeans that belong to that domain. ActiveMQ Classic’s JMX domain is org.apache.activemq and Artemis’s domain is org.apache.activemq.artemis. Under that is a Broker MBean, which contains MBeans for all destinations or addresses associated with that broker. Part 1 of this series lists ActiveMQ’s broker and destination metrics, along with their associated JMX attributes. You’ll see all those attributes listed within the MBeans shown in JConsole.
The broker and destination data you see in JConsole is current as of when you load the page, but it doesn’t update automatically. Use the Refresh button to ensure your data is up to date.
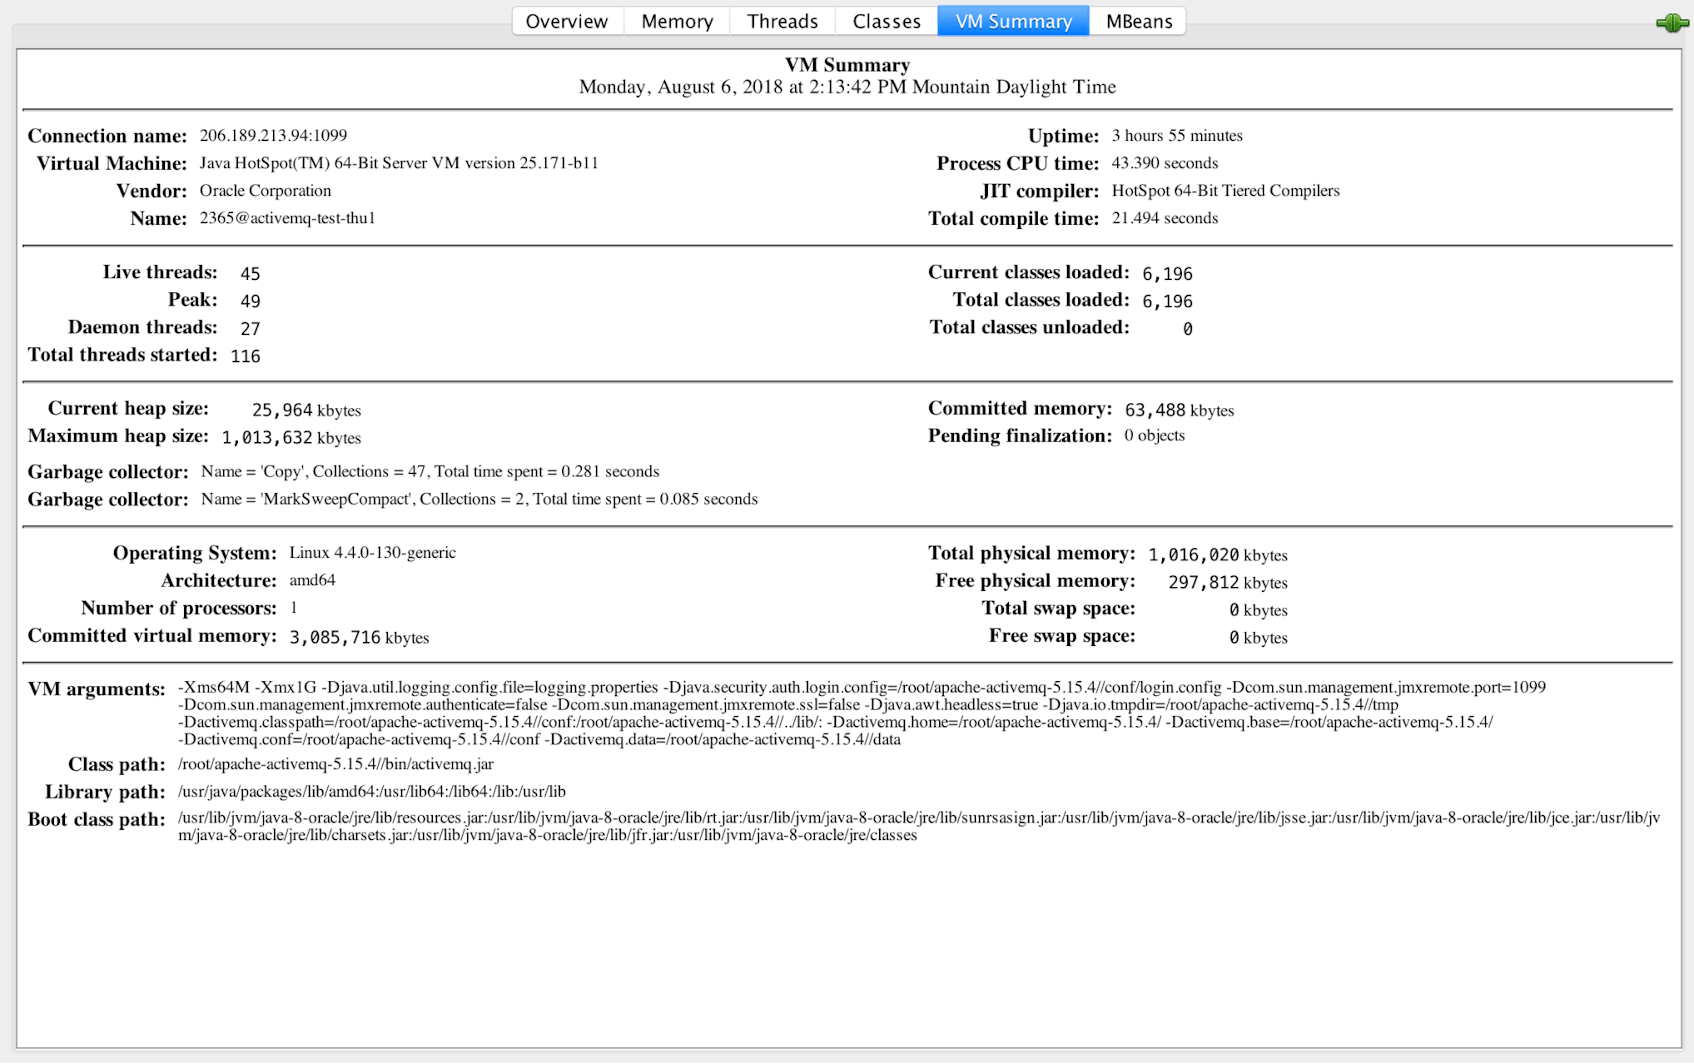
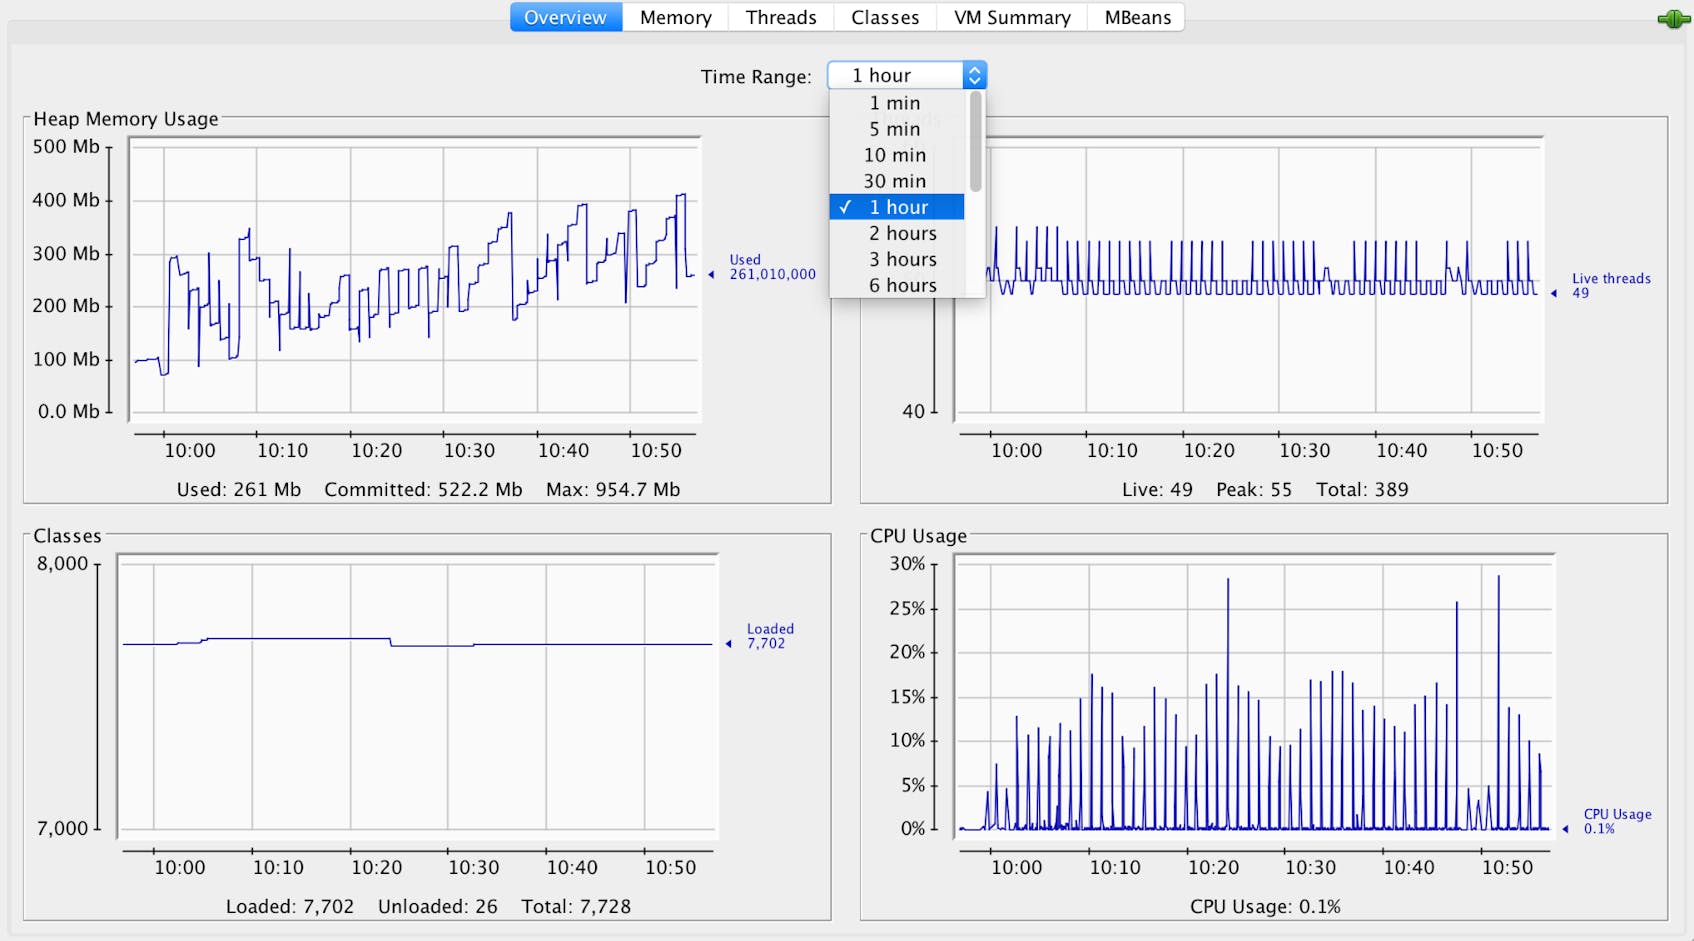
In addition to displaying metrics about ActiveMQ, JConsole shows you operating information about the JVM in which ActiveMQ is running. Under the VM Summary tab, you can see information about threads and memory usage that can provide useful context when you’re investigating ActiveMQ performance issues.
Like the Web Console, JConsole is a graphical user interface. Unlike the Web Console, JConsole allows you to see some historical data. Although JConsole doesn’t show historical data about ActiveMQ’s metrics, you can view timeseries data about JVM resource usage. You can graph the JVM’s memory and CPU usage metrics, and also the count of classes and threads used by the JVM. These visualizations can help you spot trends in your JVM’s performance. Use the Time Range dropdown to select your desired range—scaled down to the past minute, or zoomed out to the entire time JConsole has been running.
We’ve shown how JConsole allows you to remotely view ActiveMQ metrics using JMX. But JConsole doesn’t provide graphs of your ActiveMQ metrics, and it requires you to open a port to allow traffic specifically for JMX requests. In the next section, we’ll look at Hawtio, a JMX monitoring tool that works over HTTP and helps you visualize ActiveMQ metrics with timeseries graphs.
Hawtio
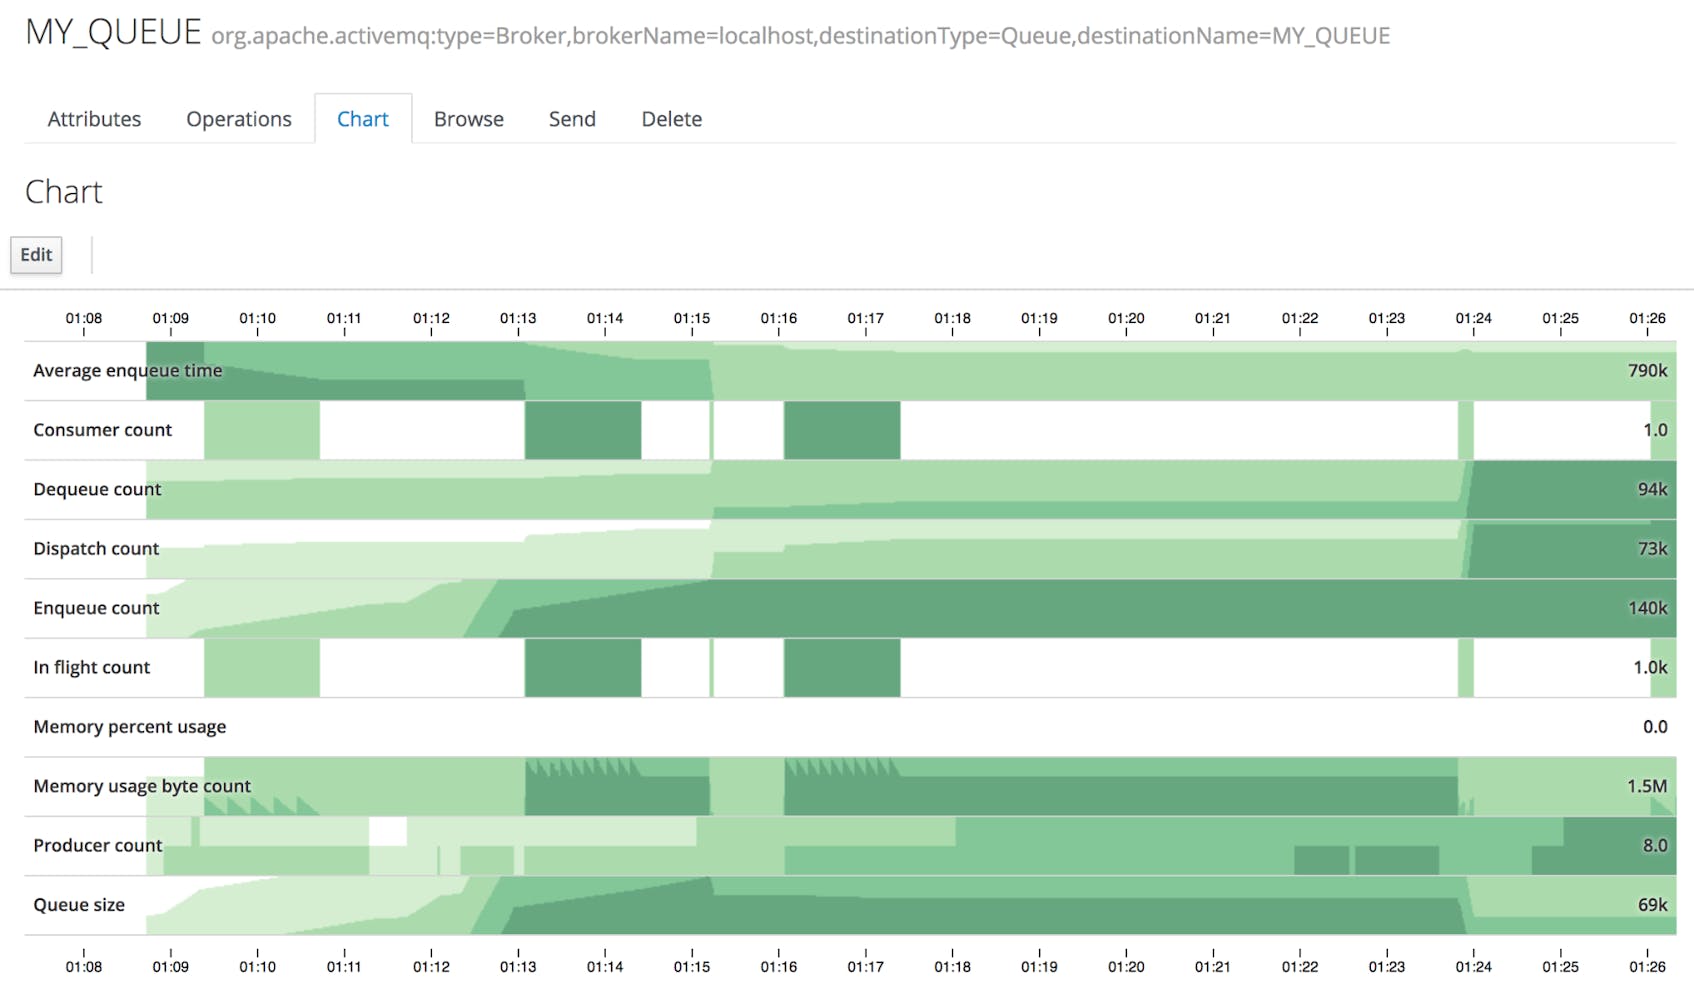
Hawtio is an open source, GUI-based tool that you can use to monitor Java applications that expose metrics via JMX. In an ActiveMQ Classic installation, Hawtio works as a web app similar to the Web Console. In ActiveMQ Artemis, a built-in instance of Hawtio is used to power the Web Console. Hawtio displays broker and destination metrics as numerical data, and as timeseries graphs, which Hawtio calls Charts.
Hawtio uses horizon graphs to visualize metrics. These are a type of timeseries graph that uses color to maintain a consistent height even if the maximum y-axis value changes over time. The darkest regions represent the highest values. A new value that would fall above the graph’s preexisting upper limit is represented in a darker shade and is plotted within the graph’s existing height.
The Hawtio frontend makes HTTP calls to a Jolokia server that’s included in your ActiveMQ installation. Jolokia’s role is to serve JMX data via REST endpoints. The Hawtio UI sends requests and receives JSON responses over HTTP, which could make it easier to use in your environment, since HTTP ports are likely already in use and not blocked by a firewall.
Hawtio, JConsole, and the ActiveMQ Web Console are GUI-based tools that don’t allow you to programmatically fetch ActiveMQ metrics. For a more thorough approach to monitoring your ActiveMQ setup, you can use tools that allow you to write code to automate your monitoring.
Next, we’ll look at the statistics plugin and the management message API, which allow you to collect metrics by sending and receiving JMS messages.
Statistics plugin (Classic) and management message API (Artemis)
ActiveMQ Classic includes a statistics plugin that uses its native messaging functionality to send metrics. The gateway for communicating with the statistics plugin is a set of destinations created automatically by ActiveMQ. When you send an empty message to a statistics destination, ActiveMQ will respond by sending broker or destination metrics in a JMS message to a destination you specify.
For example, to generate a JMS message containing broker metrics, you can send an empty message to the broker statistics destination (named ActiveMQ.Statistics.Broker). To fetch metrics for a destination named MY_DESTINATION, send an empty message to ActiveMQ.Statistics.Destination.MY_DESTINATION. You can also use wildcards in the names of statistics destinations—for example, to generate statistics messages that contain metrics for all destinations, send a message to ActiveMQ.Statistics.Destination.>. See the ActiveMQ documentation for more information about wildcards.
Artemis offers similar functionality in its management message API. You can send a message to the server’s management address identifying a resource (i.e., a broker, address, or queue), along with the desired metric and a reply-to address, and ActiveMQ will return the value of the metric.
To automate your ActiveMQ monitoring, you can write a producer to programmatically prompt the statistics plugin or management message API for metrics, and a consumer to receive and process them. You can get started with the sample code that’s included in the statistics plugin documentation or the example in the Artemis source code.
Comprehensive ActiveMQ monitoring
ActiveMQ works in conjunction with other applications (such as producers and consumers) to send and receive messages. The tools covered in this post can provide you with metrics from some of your messaging infrastructure (brokers, destinations, and the JVM) but don’t help you monitor the rest (producers, consumers, and infrastructure). With a complete ActiveMQ monitoring strategy, you can correlate metrics and logs from ActiveMQ with APM and infrastructure metrics from your producers and consumers to identify bottlenecks and troubleshoot performance issues.
Datadog allows you to collect, visualize, and alert on data from more than 850 technologies across your messaging infrastructure. Coming up in Part 3 of this series, we’ll look at how Datadog can help you monitor all the pieces of your ActiveMQ setup.
Acknowledgments
We’d like to thank Gary Tully of Red Hat for his technical review of this series.
Source Markdown for this post is available on GitHub. Questions, corrections, additions, etc.? Please let us know.


