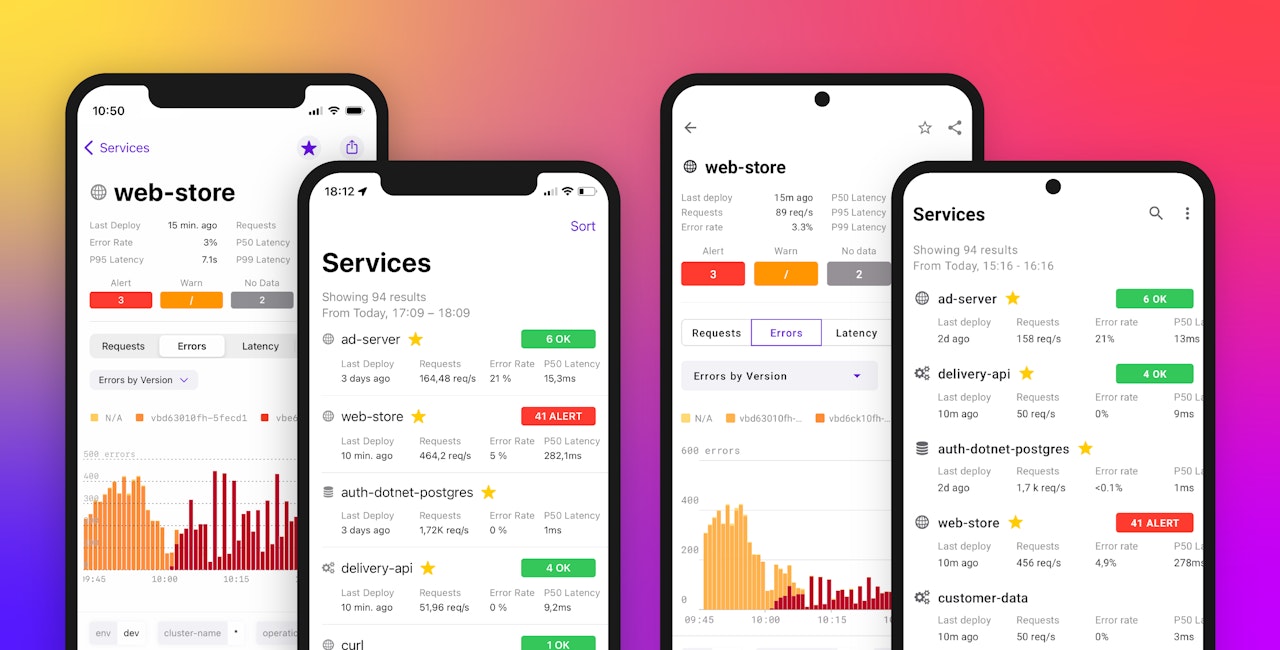
When you’re on-call for a critical service and get alerted to an issue that could impact customers, you need quick access to key performance metrics in order to effectively troubleshoot. But all too often, digging into this data requires you to switch from your mobile device to a laptop, restricting your ability to troubleshoot on the go and disrupting your routine.
To streamline detection and remediation of critical service issues wherever you are, we’re pleased to share that APM is now available on the Datadog mobile app. With APM, you can quickly assess crucial performance metrics from your services, triage alerts, declare incidents, and drill down to investigate slow endpoints—all right from your mobile device.
In this post, we’ll walk through how APM on the Datadog mobile app helps you:
Track key performance metrics across services
If you notice an issue with one of your services, application performance metrics can help you understand the state of your system, assess the severity of the issue, and determine next steps. The Datadog mobile app enables you to set up home screen monitor widgets that notify you when issues are detected in your services, databases, or serverless functions. From the home screen, you can easily dive into real-time performance metrics, filterable by tags like environment and datacenter. You can also pivot to a detailed service page to start gathering diagnostic information about any affected resources.
For example, if you receive an email or PagerDuty alert on your mobile device that a service is throwing a high number of errors, you can use the service page directly on the Datadog mobile app—without switching to a laptop—to identify which endpoints or transactions are impacted. Because the monitor was tagged with the name of the service, you can navigate directly to the associated service page in the mobile app. On this page, you can view request rate, error, and duration (RED) metrics that can help you investigate the source of the issue. The service page also includes deployment tracking information, enabling you to see whether the issue is related to a recent release.
In this case, you can see that issues started right when a new deployment occurred. To judge the impact and start troubleshooting, you can sort your endpoints by error rate. Doing so shows you that several critical resources are impacted by the faulty deployment. You’re then able to pivot to the resource pages for the affected endpoints, allowing you to view associated traces and monitors for deeper analysis.
After investigating an issue, you can take any next steps without ever leaving the mobile app. If the issue was incorrectly triggered due to a false alarm or a synthetic test, you can mute the monitor. Or if you find that the errors are affecting a crucial resource, you can declare an incident and contact the appropriate teams via the mobile app.
Declare and manage incidents on the go
Once you determine an issue is severe enough to warrant further action, you can start responding to it directly from the Datadog mobile app and enrich your investigation with APM data so that no time is wasted. From the service page, you can create a new incident and assign it a priority and commander. To give responders more context around the incident, you can easily share important application performance metrics by adding APM dashboard widgets to the incident timeline. In the scenario described above, for example, you could help responders quickly visualize the onset and scope of the issue by adding a graph of the spike in errors. Your team can then use this data to decide whether to roll back the deployment or ship a hotfix.
To prepare for future incidents, you can set up APM monitors to track KPIs in your application and configure them to notify your phone. You can receive notifications directly from the Datadog mobile app or through our integrations with services like PagerDuty, Slack, and Jira. When you’re ready to start troubleshooting, you can jump directly from the notification to relevant APM metrics in the mobile app for further investigation.
Triage and troubleshoot app performance issues anywhere
APM is now integrated into the Datadog mobile app, enabling you to pinpoint performance issues and manage incidents wherever you are. Along with mobile dashboards, APM data gives you even more context for investigating issues without migrating to a laptop. If you’re an existing customer, install the Datadog mobile app with the help of our documentation or the QR code below. Or, if you’re new to Datadog, sign up for a 14-day free trial.


