Real-world applications of the Datadog Cluster Agent (Part 1)
11月 5, 2024
Intro
Since its introduction in 2018, the Datadog Cluster Agent (DCA) has evolved from “nice-to-have” to an essential component in a robust Kubernetes monitoring solution with Datadog. In this two-part series, we’ll explore the key features and capabilities of the Datadog Cluster Agent, providing insights into how it can enhance your Kubernetes observability strategy.
Part 1 will focus on three crucial aspects: the DCA’s role in metadata caching, monitoring external services, and collecting cluster scoped data such as kube-state-metrics (KSM). In Part 2, we’ll shift our focus to the scalability aspects of the Datadog Cluster Agent, covering topics such as autoscaling with external metrics and scaling the Kubernetes State Metrics Core check.
Caching Kubernetes metadata with the Datadog Cluster Agent
Driven by the widespread growth in Kubernetes usage and scale of Kubernetes clusters, In January 2021, with version 2.7.0 of the Datadog helm chart, the Datadog Cluster Agent officially transitioned to must-have status and was enabled by default to provide the best “out of the box” experience for our customers monitoring Kubernetes. As the clusters increase in node count, metadata caching by the Datadog Cluster Agent becomes a critical feature that alleviates the burden of querying the Kubernetes API server for metadata. By intelligently caching and exposing metadata about your cluster’s components, such as pods, nodes, and services, the Cluster Agent streamlines the monitoring process, reducing latency and overhead.
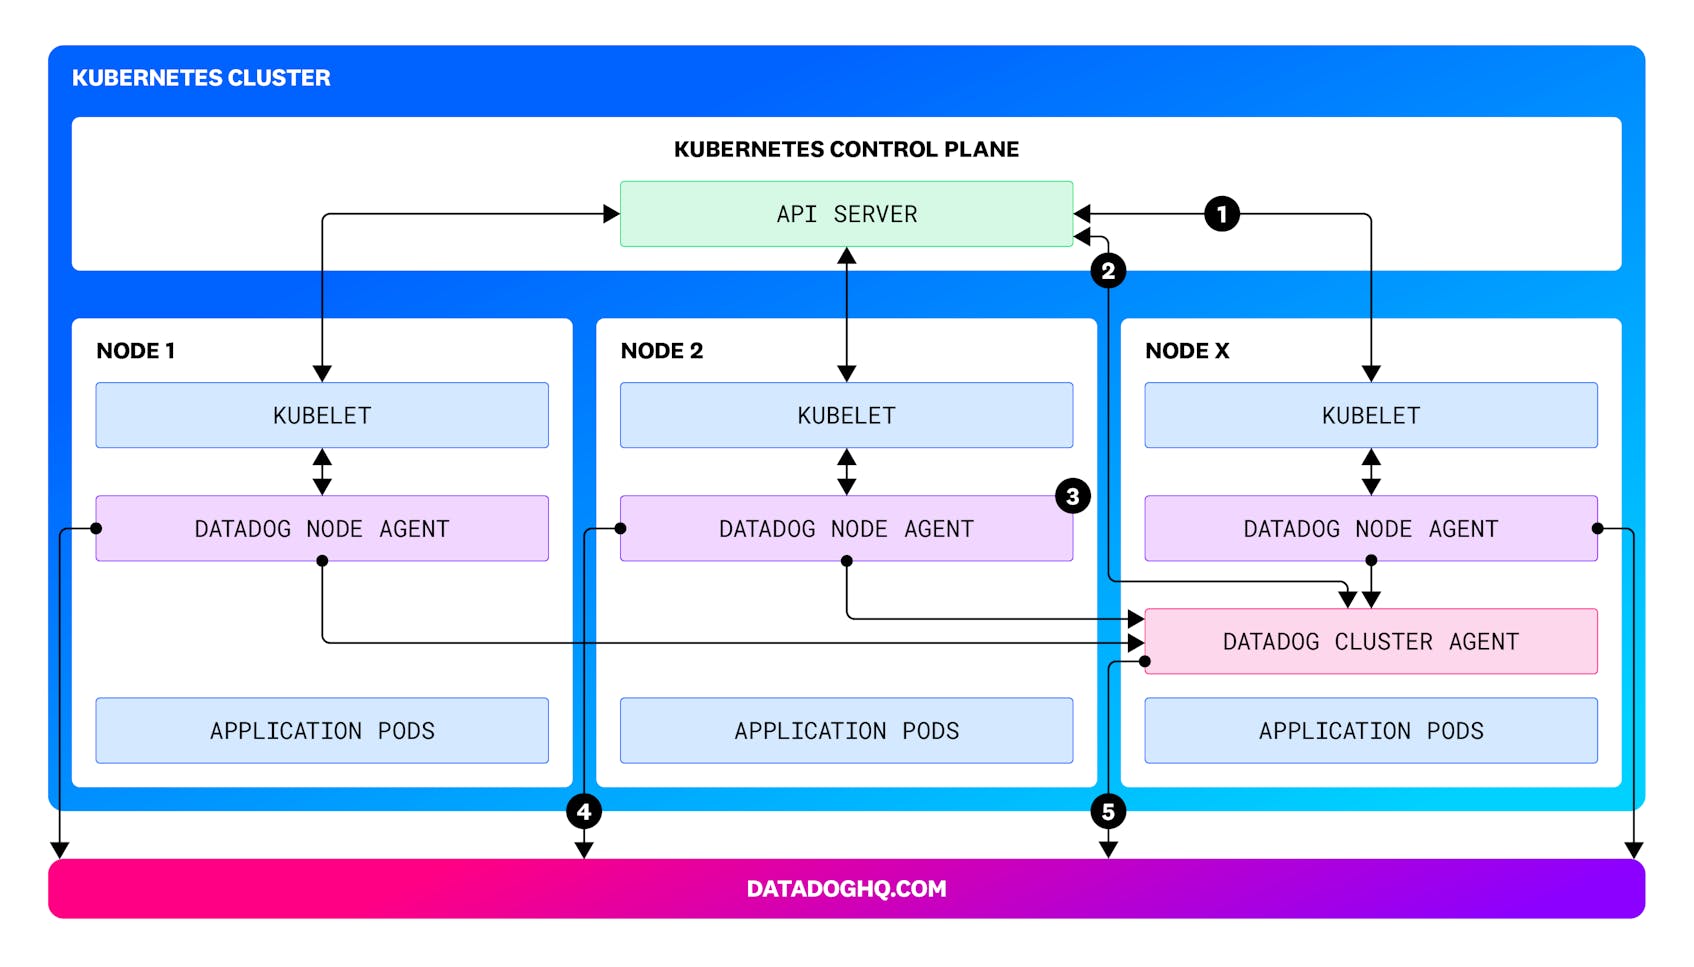
Let’s start by diving into the overall architecture of the Datadog Cluster Agent and how it interacts with the Datadog node agents and other kubernetes components such as the Kubelet and API Server.
This chart illustrates the overall architecture and flow of the Datadog Cluster Agent and its interactions with the node and Kubernetes components.
- 1. The Kubelet manages the desired state of pods/containers on a node.
- 2. The Datadog Cluster Agent collects metrics from the Kubernetes API and caches metadata.
- 3. The Datadog node agent collects node metrics (e.g. system, kubelet) and enriches data using cached metadata from the DCA.
- 4. The Datadog node agent sends fully enriched metrics along with APM traces and logs to the Datadog SaaS platform over HTTPS.
- 5. The Datadog Cluster Agent sends cluster-level metrics (KSM, orchestrator) and metadata to the Datadog SaaS platform over HTTPS.
The Datadog Cluster Agent collects Kubernetes metadata (e.g. deployments, services) from the API server every 30 seconds and caches it. It then serves this metadata to node-based agents, allowing them to enrich local metrics with cluster-level context. This approach reduces load on the API server and improves scalability by avoiding direct queries from each node agent. Additionally, the Cluster Agent’s metamap endpoint and the `datadog-cluser-agent metamap` subcommand allows inspecting the cached metadata and troubleshooting tagging issues. Usage of the metamap subcommand is demonstrated here:
$ kubectl exec -it pod/datadog-cluster-agent-9c4b5648f-hfgd6 -- datadog-cluster-agent metamap
...
2 Features detected from environment: kubernetes,orchestratorexplorer
===============
Metadata Mapper
===============

Node detected: minikube

  - Namespace: default
      - Pod: datadog-agent-ks9m8
        Services: [datadog-agent]
      - Pod: datadog-cluster-agent-9c4b5648f-hfgd6
        Services: [datadog-admission-controller datadog-cluster-agent]

  - Namespace: kube-system
      - Pod: coredns-7db6d8ff4d-99j9z
        Services: [kube-dns]
The Datadog Cluster Agent’s caching functionality has become a “must-have” feature as organizations continue to scale clusters, binpack more heavily, and manage multi-tenant clusters.
Cluster Checks and Monitoring External Services
Beyond the resources and services operating on the Kubernetes cluster, the Datadog Cluster Agent enables monitoring of external services that are critical to your Kubernetes ecosystem. This includes load balancers, databases, cloud provider services (e.g., AWS S3, RDS), network devices, or third-party services. The Datadog Cluster Agent can run the configured cluster checks against the external service endpoints to collect metrics and health status, providing visibility into dependencies outside the cluster that applications rely on. This approach also ensures high availability, as the Cluster Agent can schedule these checks from any node within the cluster.
Cluster checks can be configured with configuration files on the cluster agent or via Kubernetes service annotations. The configuration files can be set via the operator or helm chart but access to these configurations may be limited to a centralized team. In these instances, using the service annotations as shown below will allow tenants of a cluster to configure cluster checks.
apiVersion: v1
kind: Service
metadata:
    name: httpbin
    labels:
        run: httpbin
        tags.datadoghq.com/env: "prod"
        tags.datadoghq.com/service: "httpbin"
        tags.datadoghq.com/version: "1.0.0"
    annotations:
      ad.datadoghq.com/service.checks: |
        {
          "http_check": {
            "init_config": {},
            "instances": [
              {
                "url":"https://%%host%%/get",
                "name":"httpbin_get",
                "timeout":1
              }
            ]
          }
        }
spec:
    ports:
        - port: 443
          protocol: TCP
    selector:
        run: httpbinapiVersion: v1
After creating this service on the Kubernetes cluster, you can validate that the configuration has been applied.
$ kubectl exec -it pod/datadog-cluster-agent-9c4b5648f-hfgd6 -- datadog-cluster-agent clusterchecks
...
=== 1 agents reporting ===

Name       Running checks
minikube   1

===== Checks on minikube =====

=== http_check check ===
Configuration provider: kubernetes-services
Configuration source: kube_services:kube_service://default/httpbin
Config for instance ID: http_check:Httpbin get:e74cca3186248bd9
empty_default_hostname: true
name: httpbin_get
tags:
- env:prod
- kube_namespace:default
- kube_service:httpbin
- service:httpbin
- version:1.0.0
timeout: 1
url: https://10.110.5.133
~
Init Config:
{}
===

===== 0 Pod-backed Endpoints-Checks scheduled =====
Kubernetes State Metrics
Kubernetes state metrics are a set of metrics that provide insights into the state of various Kubernetes cluster-level objects and components within a Kubernetes cluster.
Kubernetes state metrics are also an ideal fit for execution via the Datadog Cluster Agent. The KSM check provides cluster-level visibility, therefore, running the check on the Cluster Agent aligns with its purpose of monitoring the overall cluster state.
Use Cases
Alerting and Troubleshooting: Use Kubernetes state metrics to set up alerts for critical conditions like pod failures, node outages, or deployment issues. These metrics aid in troubleshooting and root cause analysis.
Capacity Planning: Analyze historical trends in resource usage, pod counts, and cluster state to plan for future capacity requirements and scaling needs.
Examples include:
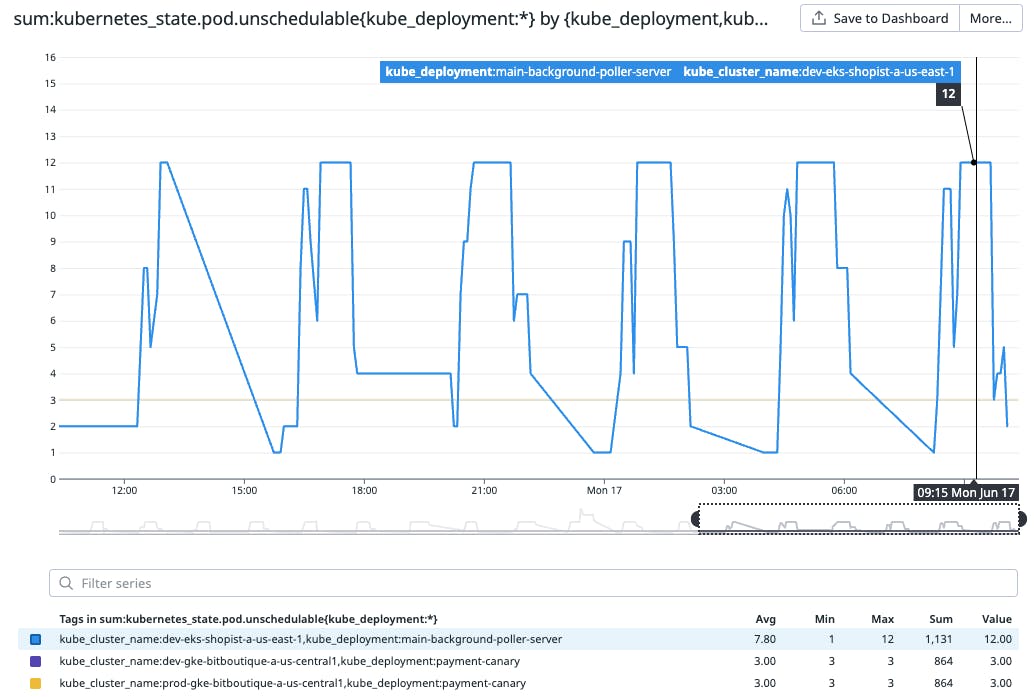
- Pods: monitoring unscheduleable Pods using
kubernetes_state.podunschedulablebykube_deployment(pictured above) - StatefulSet: identifying suboptimal StatefulSets by comparing
kubernetes_state.statefulset.replicas_currentvskubernetes_state.statefulset.replicas_desired - Horizontal Pod Autoscalers: alerting on current replicas approaching maximum replicas using
kubernetes_state.hpa.current_replicasandkubernetes_state.hpa.max_replicas
In this first part of our series on the Datadog Cluster Agent, we’ve explored three key features that make it an essential component in your Kubernetes monitoring strategy: metadata caching, monitoring external services, and collecting cluster-scoped data like Kubernetes state metrics. By leveraging these capabilities, you can gain a deeper understanding of your Kubernetes clusters and improve your observability and troubleshooting capabilities.
Stay tuned for part 2 of this series, where we’ll dive into the scalability aspects of the Datadog Cluster Agent, including workload autoscaling and scaling the Kubernetes State Metrics (KSM) core check!
Authors
Kennon Kwok - Senior Product Solutions Architect

