Mastering Distributed tracing: data volume challenges, and Datadog’s approach to efficient sampling
3月 18, 2025
A distributed world
If you are running a customer-facing business, chances are that your application is made up of multiple services in a distributed system, where each request might flow through multiple pods, databases, distributed messaging systems, and third party APIs.
If this is the case, you are familiar with some of the challenges of distributed systems and how pinpointing the cause of an issue is not trivial. As the number of services and moving parts increases, so does the complexity—and ultimately, this affects your ability to quickly pinpoint issues. That is why being able to trace end-to-end requests is vital in a distributed system. This technique is also known as distributed tracing.
Distributed tracing allows you to trace the full journey of a user request to easily pinpoint where it might fail, slow down, or encounter any problems. It provides a clear picture of how services interact with each other, unveiling both upstream and downstream dependencies. Distributed tracing is now offered by many different tools in the market: more traditional Application Performance Monitoring (APM) vendors as well as new players in the observability (o11y) space.
But even with these tools, distributed tracing comes with some challenges. In fact, due to its nature, trace data tends to be repetitive. Compared to other observability telemetries, traces typically represent a larger volume of data than logs.
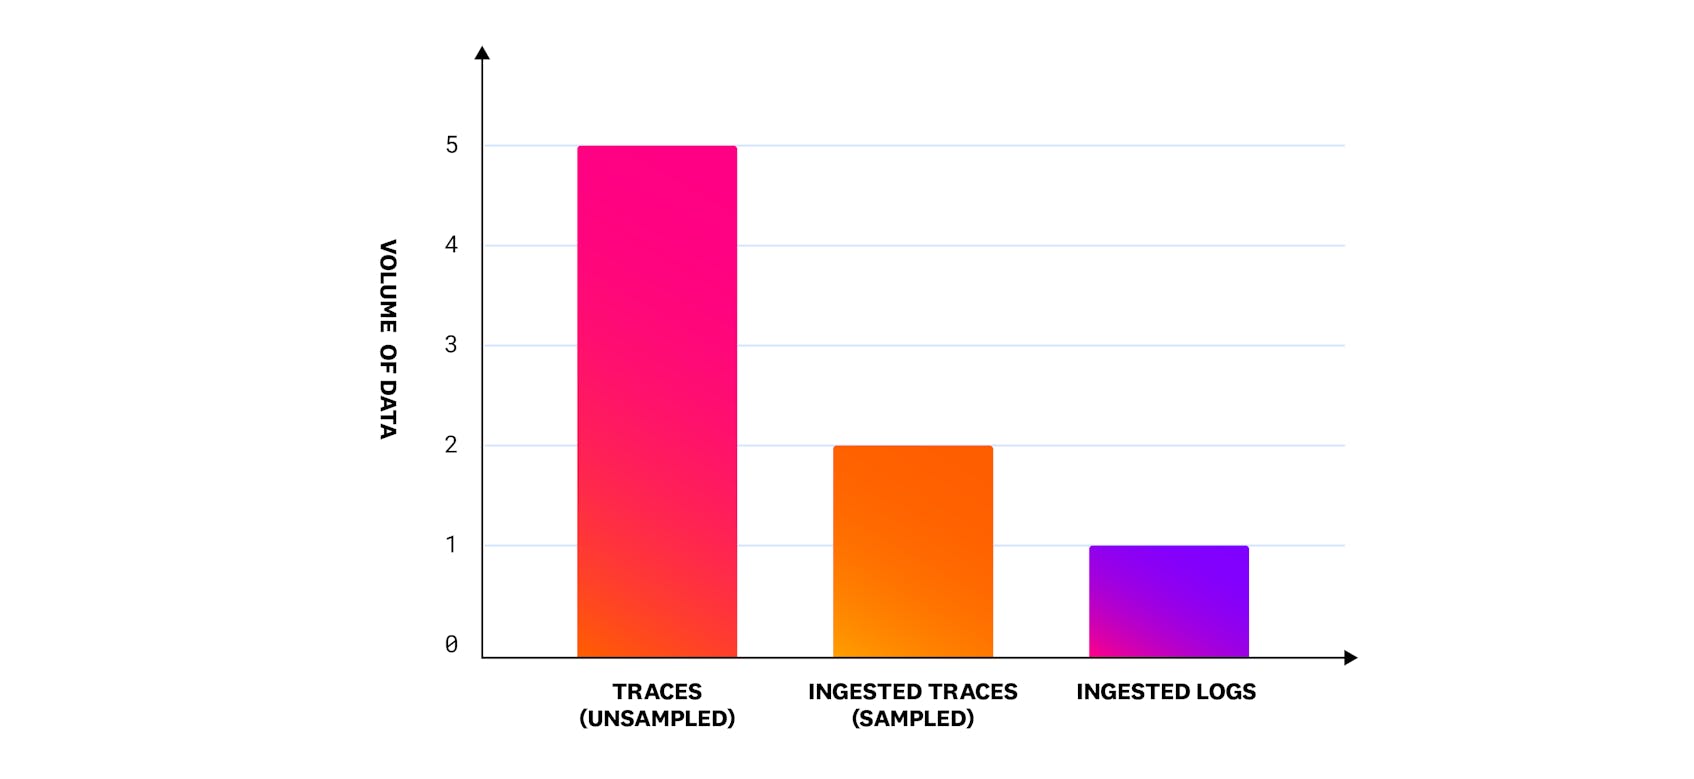
We conducted a survey analyzing unsampled trace volume, sampled trace volume, and log volume across Datadog’s customer base. Our analysis shows that the unsampled trace volume generated by applications is approximately five times greater than the volume of logs ingested. Additionally, the volume of sampled traces ingested is twice as large as the volume of logs ingested, highlighting the relative scale of trace data compared to logs across the Datadog customer base.
This disparity in data volumes underscores the critical role of ingestion and indexing in managing observability data. Ingestion involves the process of collecting and bringing data into a system, while indexing refers to organizing and storing that data to make it easily searchable and usable. Still, ingestion is only one part of the problem. In addition to ingesting traces, you need to store or basically index them in order to effectively query them. And the more you trace, the more you ingest, the more you index, the more noise you introduce at query time—all of this, without even considering the costs associated to ingest and index that massive amount of data. That is why the vast amount of trace data emitted by observable apps remains one of the main challenges to achieving widespread distributed tracing adoption.
Sampling, a well-established technique, provides a reliable solution to managing excessive data volumes in distributed systems. By selectively capturing a representative subset of data rather than ingesting everything, sampling helps reduce the volume of data without compromising the ability to derive meaningful insights.
In this series of articles, we’ll explore different sampling methods, analyze their pros and cons, and consider what an ideal strategy for distributed tracing should look like. Before we dive deeper into sampling methods, let’s first try to understand the main use cases for distributed tracing.
Why companies use distributed tracing
Companies are increasingly relying on distributed tracing for:
- Investigating latency and errors: distributed tracing surfaces problematic user requests, making it easier to identify the root causes of latency spikes or error rate increases.
- Analyzing service dependencies: in complex distributed systems with hundreds or thousands of microservices, traces help companies understand how services interact and depend on each other.
- Performing dimension-specific analytics: traces allow companies to analyze specific dimensions (e.g., user IDs, request types, geographic locations) tagged on spans (attributes added via manual or automatic instrumentation) for more in-depth insights.
Ultimately, what companies aim to achieve through distributed tracing includes:
- Capturing representative request samples: traces offer visibility into a broad sample of requests across services, providing insight into overall system performance.
- Comprehensive error and latency visibility: traces enable companies to closely monitor requests with high error rates or latency issues, facilitating quicker problem resolution.
- Tracking business-critical requests: by tagging specific spans, such as those tied to a particular type of customer (e.g., silver, gold, platinum, etc.) companies can monitor requests that have direct business value (e.g., login, checkout, submit claim, top up, etc.), helping them focus on what matters most.
Ingestion is only part of the equation
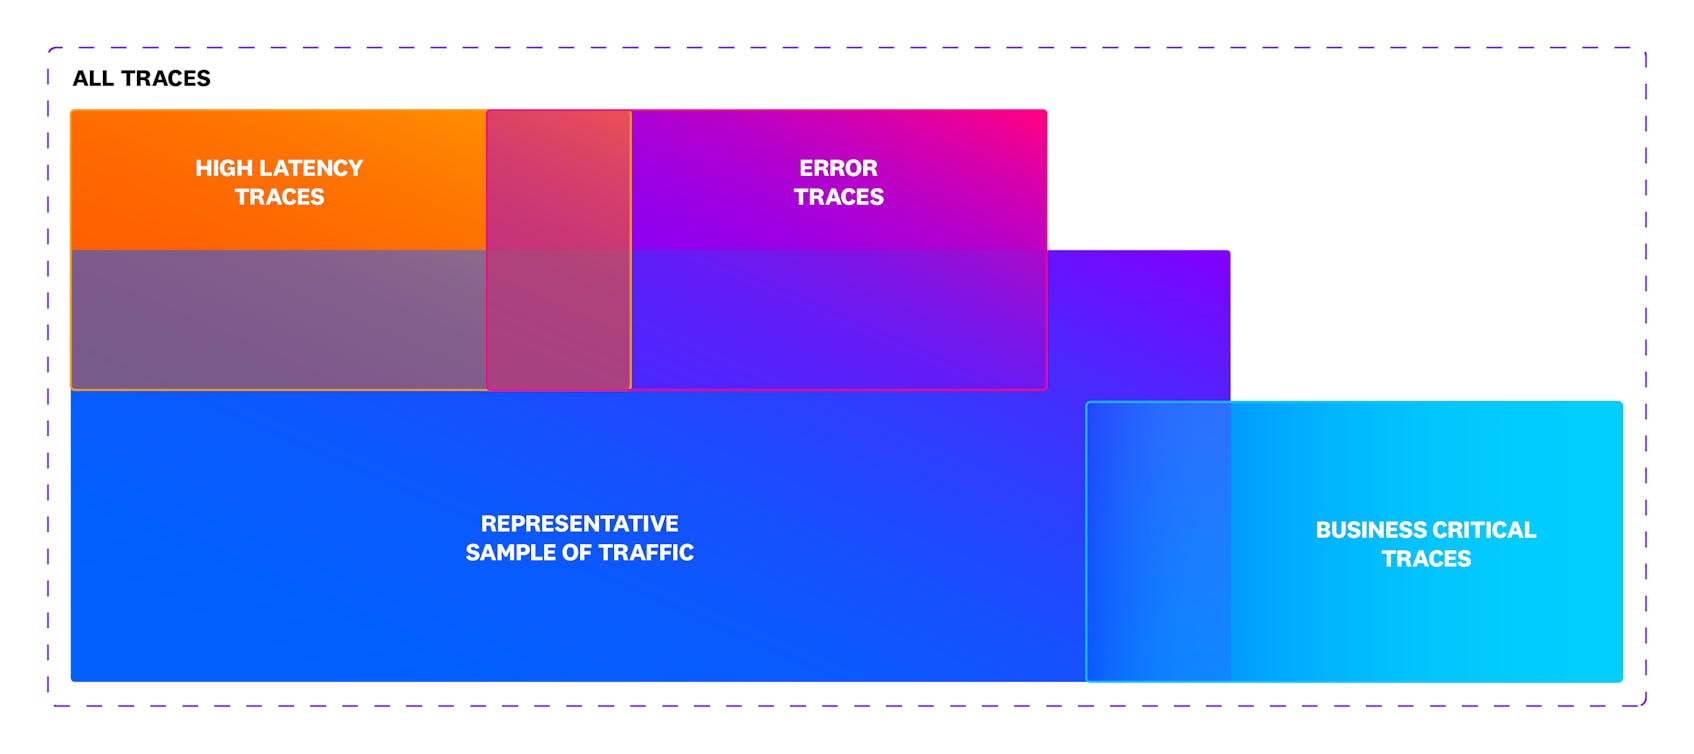
As we saw early on, not all traces generated by your applications need to be ingested and retained. Most traces are repetitive, and retaining every single one is unnecessary. Instead, to reduce noise and keep costs under control, we should capture a representative sample of successful requests. This provides you with an overview of your application’s performance without overwhelming you with excessive, costly data.
Conversely, the most valuable traces are those that highlight potential issues in your infrastructure or application. It is then vital to ensure that traces containing errors or unusual latency are always retained. These traces are critical for identifying and addressing performance bottlenecks and system errors before they impact your end users.
Last but not least, for endpoints that are crucial to your business operations, it is essential to retain 100 percent of the traffic. This allows you to thoroughly investigate and troubleshoot any customer-related issues, ensuring that you maintain the highest level of service reliability for your most important services.
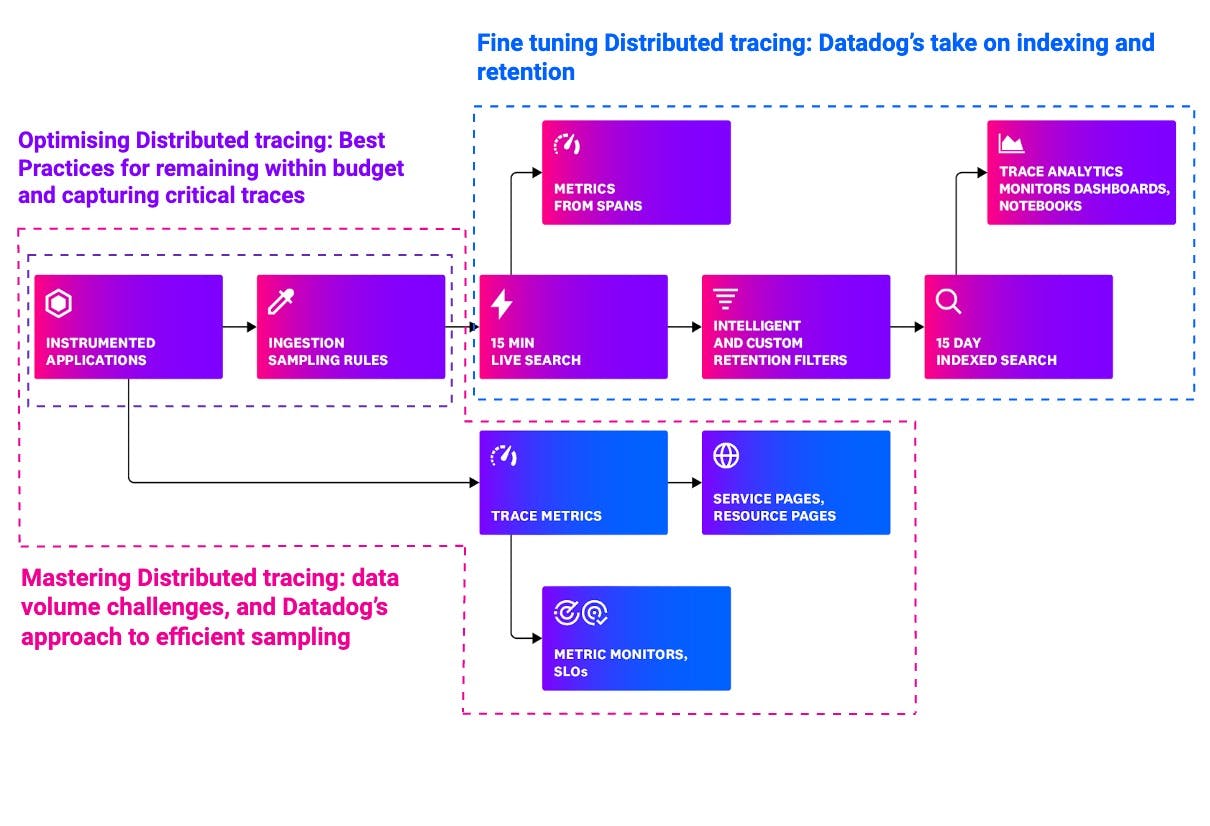
As you can see in the picture below, Datadog provides tools to manage both the ingested volume and the way you retain your trace data. We will explore these two capabilities more in the following paragraphs.
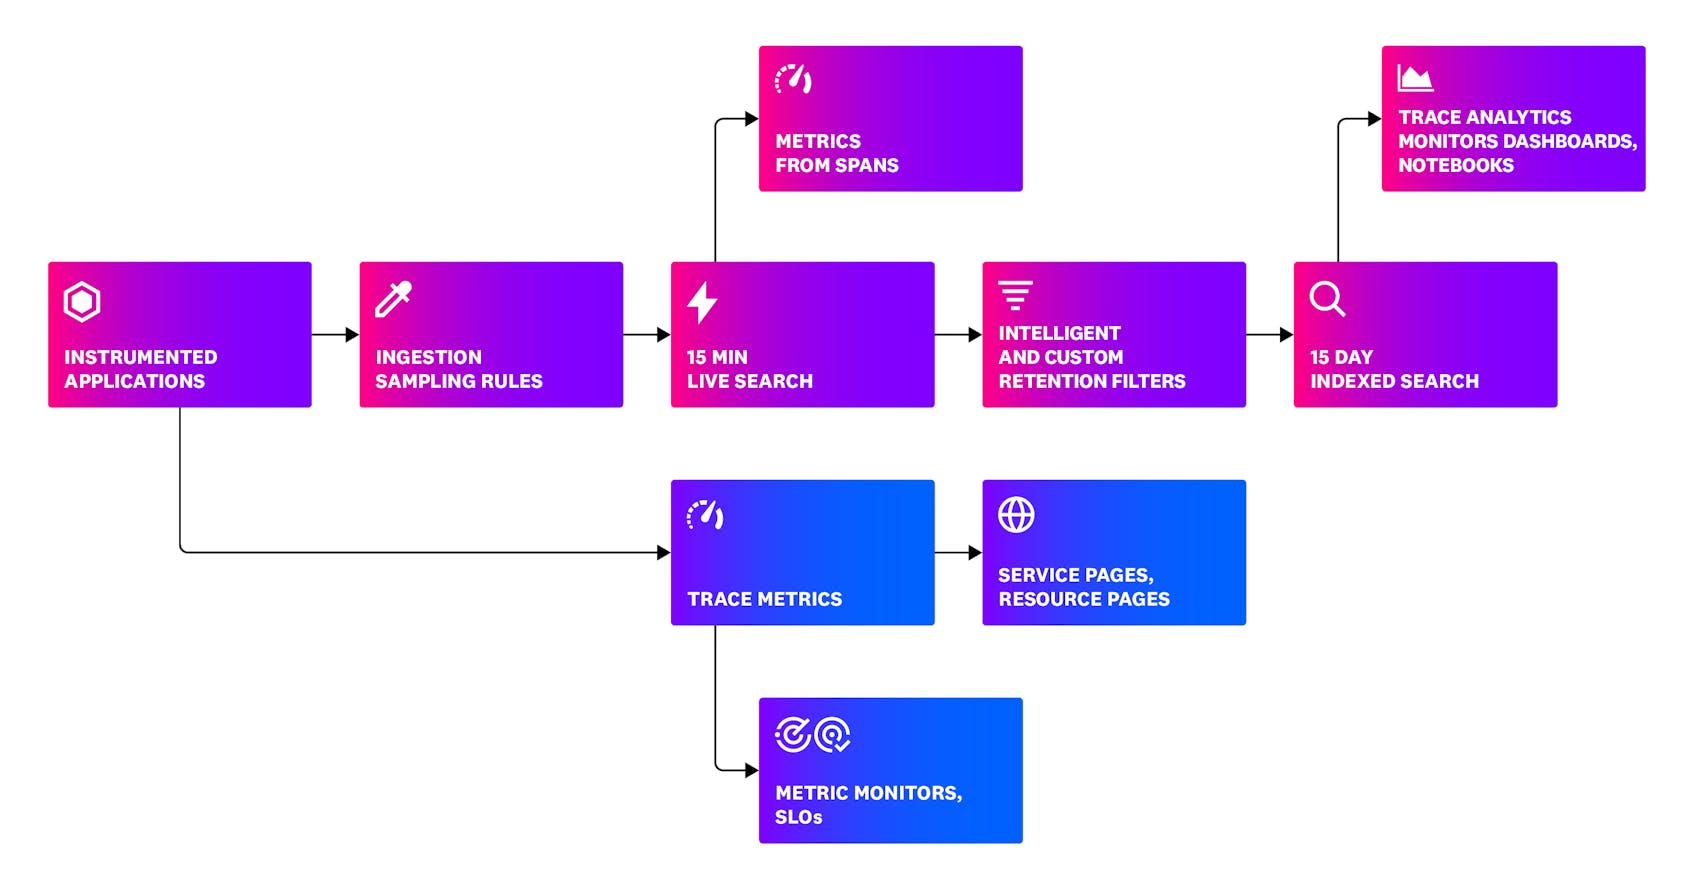
Datadog allows you to query all spans ingested in the last 15 minutes (this is known as Live Search, which is a rolling window). If you want to query more, you can index any interesting spans. This could be achieved with custom tag-based retention filters, where your spans are retained for 15 days (by default).
Datadog comes with an out-of-the-box Intelligent Retention Filter. This default filter retains a diverse set of traces for you. The Intelligent Retention Filter stays active for all your services, and it makes sure to keep a representative selection of your traces (for 15 days), saving you time and effort as you do not need to create custom tag-based retention filters. This filter takes advantage of two underlying mechanisms: diversity sampling and one percent flat sampling. We will look into indexing later in this series. For now, let us dive deeper into ingestion sampling.
Oh! One last thing!
You might have noticed in the picture above that trace metrics are calculated straight from your instrumented applications. These metrics capture rate (the number of requests per second), errors (the number of errors per second), duration (the amount of time requests take to execute)—also known as RED metrics. RED metrics are based on the RED method, which in turn is a subset of the famous Four Golden Signals definition from the Google Site Reliability Engineering (SRE) handbook.
Head- and tail-based sampling
At the time of writing, there are two main methods for sampling in distributed tracing: head-based and tail-based sampling.
Head-based sampling
In head-based sampling, the decision to sample is made at the beginning of the trace (also known as the root span). This decision is then propagated downstream through the trace context (e.g., HTTP request headers), which includes critical information like trace and span IDs.
Let us see some benefits and some challenges of head-based sampling strategy:
- Efficiency: head-based sampling can capture a representative sample of traffic right from the beginning of a request since key details such as environment, service, and resource are usually known upfront.
- Challenges with errors and latency: while this approach is efficient, it presents difficulties in capturing high-latency or error traces. Since latency and errors might manifest after the trace context has already been propagated, they might not be captured as easily.
- Business-critical traces: regardless of the fact that you use head- or tail-based sampling, business-critical traces might depend on specific user interactions or transactions that are not readily identifiable from the initial request metadata. To capture these, you would need to define specific rules or use custom instrumentation, such as custom span tags, for particular services or requests.
Tail-based sampling
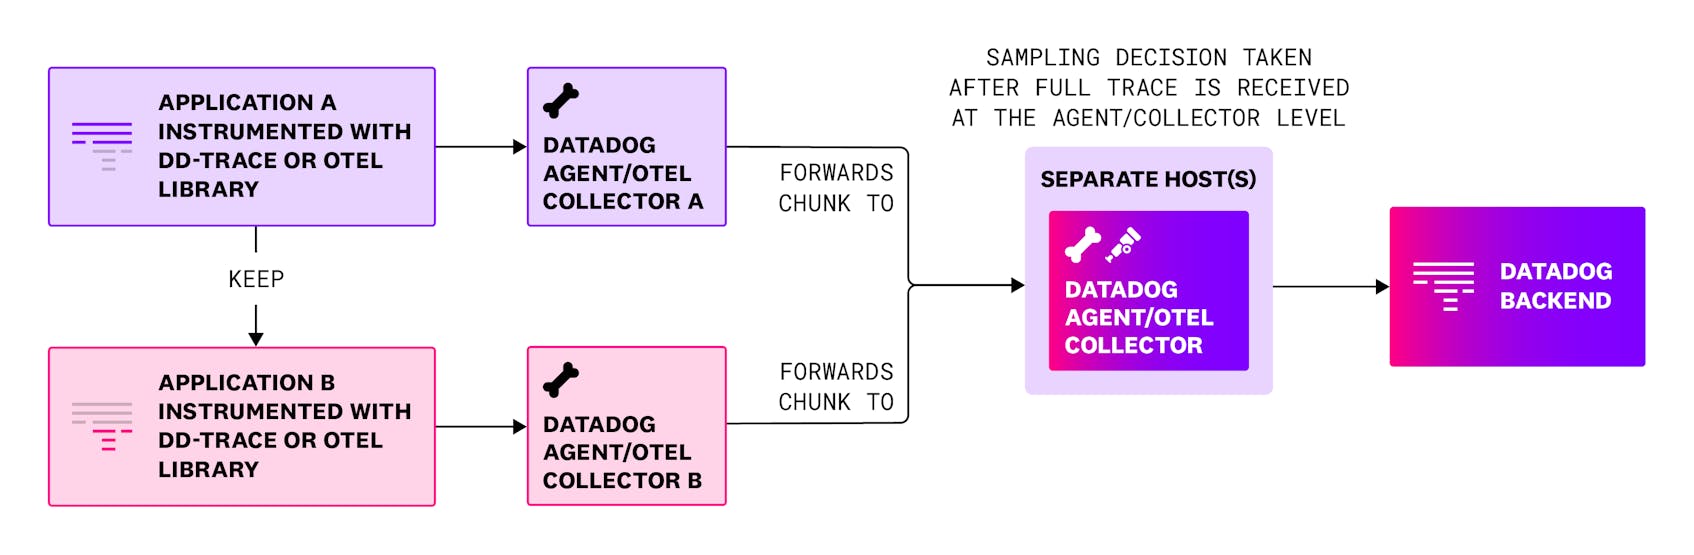
Tail-based sampling, on the other hand, involves making the sampling decision at the end of the trace. This requires all spans associated with a trace to be temporarily stored in the same location, which can be complex to manage—especially in distributed systems. The trace data must be buffered for a set period until it’s assumed the trace is complete. In addition, implementing tail-based sampling typically requires additional infrastructure, as all the trace data needs to be consolidated in one place to make an informed sampling decision.
Let us see some benefits and some challenges of tail-based sampling strategy:
- Capture errors and high latency traces: tail-based sampling ensures that critical traces, such as those containing errors or experiencing high latency, are captured. By evaluating the entire trace after the full trace is received, this method prioritizes insights into anomalies and performance issues, providing valuable data for debugging and optimization.
- Requires additional infrastructure: tail-based sampling relies on additional infrastructure to temporarily store and process all spans before deciding which traces to sample. This introduces added complexity, additional resource requirements, increased operational burden, and infrastructure costs.
- Incomplete traces: While tail-based sampling improves data relevance and reduces noise, understanding its potential for producing incomplete traces is essential when designing sampling strategies for complex distributed environments.
At Datadog: head-based sampling for trace completeness
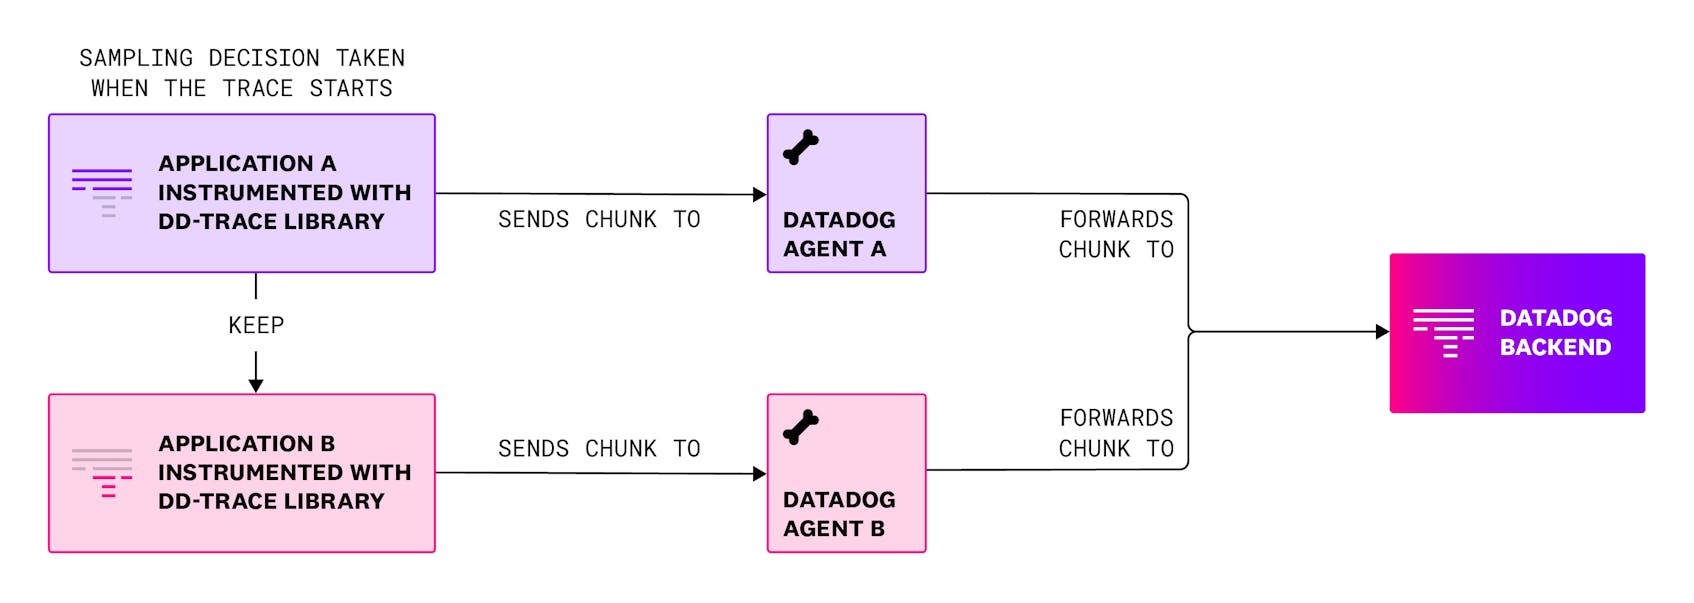
When it comes to sampling in distributed tracing, one key principle Datadog adheres to is completeness. Head-based sampling ensures that all spans from a single request must follow the same sampling decision, which is important for customers to get complete end-to-end traces. With head-based sampling, the decision to keep or drop a trace is made at the beginning and then conveyed to all parts of the trace itself. This guarantees to keep or drop the trace as a whole.
If you use automatic instrumentation, Datadog’s tracing library takes care of propagating the context. The tracing library supports multiple formats of context propagation, such as Datadog format, W3C context, and Baggage. When in use the Datadog format will take precedence over the other two.
Below are some of the reasons why we have chosen head-based sampling:
Cost efficiency: egress cost
Head-based sampling reduces overall costs, particularly egress costs, by making the sampling decision at the beginning of a request. Since only a subset of traces is collected and transmitted, the amount of data leaving the system is minimized, which directly lowers network and storage expenses.
Trace completeness
Head-based sampling ensures that once a trace is selected, all its spans are collected and retained. This guarantees a complete view of the trace, enabling comprehensive analysis of a request’s journey through the system without partial or fragmented data.
Ease of deployment
Head-based sampling is simple to implement and requires minimal infrastructure. It operates with a single Datadog Agent deployed, making it easy to integrate into existing systems without the need for additional storage or post-processing infrastructure. This simplicity allows for faster adoption and lower operational overhead.
Alerting on true application traffic with Datadog trace metrics
We briefly introduced trace metrics, which provide high-level insights into application performance—such as request rates, error counts, and latency—enabling teams to quickly detect anomalies and performance issues.
Unlike trace data that may be sampled, trace metrics are calculated based on 100 percent of the application’s traffic, ensuring accuracy and completeness. This comprehensive visibility allows teams to create reliable dashboards, monitors, and service level objectives (SLOs) to track system health and proactively address issues.
This ensures you can spot potential errors or alert your team about potential slowdowns your application is facing. Trace metrics are the main source of truth when it comes to creating dashboards, monitors, and SLOs.
Default head-based sampling for cost efficiency and trace completeness
Did we say that trace data is repetitive? That is why at Datadog we apply sampling by default, as a head-based sampling approach balances performance and ease of use. But at the same time, if you want to further configure sampling, we provide options.
By default, the Datadog Agent continuously sends sampling rates to the Datadog tracing library to apply sampling decisions at the root of the traces. The Agent adjusts the sampling rates to stay within a target of 10 traces per second (by default that is then distributed to all the services depending on the traffic.
Each span ingested is marked with a unique ingestion reason that clearly states which ingestion mechanism has been applied.
By default, if nothing has been configured, the ingestion reason isauto (ingestion_reason: auto).
@param max_traces_per_second - integer - optional - default: 10
DD_APM_MAX_TPS
Maximizing system resilience through error trace analysis
Error traces serve as crucial indicators of potential system failures, providing valuable insights into areas that require attention. By keeping a higher proportion of transactions with errors in your monitoring systems, you ensure continuous access to relevant individual requests that can aid in diagnosing issues. This practice is essential for identifying root causes, improving system reliability, and enhancing the overall user experience.
Let us explore some of the use cases for error tracking:
- Root cause analysis and improving user experience: error traces allow engineers to pinpoint the exact source of a failure within the system. For example, a trace might reveal a bottleneck in a database query or an issue with an API integration, which ultimately might affect the end user experience. By examining error spans within a trace, teams can quickly identify and address the underlying problem.
- Improving incident response: during system outages or incidents, having detailed traces with error spans ensures that on-call teams have immediate access to actionable data. This accelerates the time to resolution by providing clear evidence of what went wrong and where.
- Regulatory and compliance audits: in industries with strict compliance requirements, error traces provide a record of incidents that may need to be reported. This ensures transparency and accountability, demonstrating that the organization is monitoring and addressing failures.
- Shifting left with testing and debugging: error traces captured in staging or test environments help developers refine code before deployment. Simulating error scenarios with actual data allows for more robust debugging and ensures system readiness for production.
Error traces not caught by the head-based sampling receive special treatments in Datadog.
In fact, an additional sampling mechanism built into the Datadog Agent makes sure that a sampling of your critical error traces is ingested. Bear in mind that the resulting sampled traces will likely be incomplete. By default, the Datadog Agent will sample 10 errors per second on top of the head-based sampling. This will catch all combinations of environment, service, operation name, resource, http.status and error.type. The ingestion reason is error (ingestion_reason: error).
@param errors_per_second - integer - optional - default: 10
DD_APM_ERROR_TPS
Monitoring ingested volumes
The Ingestion Control page is a powerful tool for managing and optimizing your data usage across your services. Here’s a breakdown of its benefits and how to utilize it effectively:
- Cost optimization: helps you monitor and control the volume of data being ingested to avoid unnecessary costs. It allows fine-grained control over your services and resources to ensure only the most relevant data is ingested.
- Enhanced visibility: provides a clear overview of data allotments and consumption, ensuring you can make data-driven decisions about scaling or adjusting your services. It also allows you to see the ingestion reasons applied to all your ingested spans.
- Improved performance: reduces noise by filtering out unnecessary data at the source, improving dashboard and alerting relevance. Allows you to maintain an optimal data-to-signal ratio for actionable insights.
- Customizable data management: enables tailored ingestion controls for individual services and resources, ensuring specific needs are met without affecting overall system behavior.
Visualizing the allotment and overall ingested volume
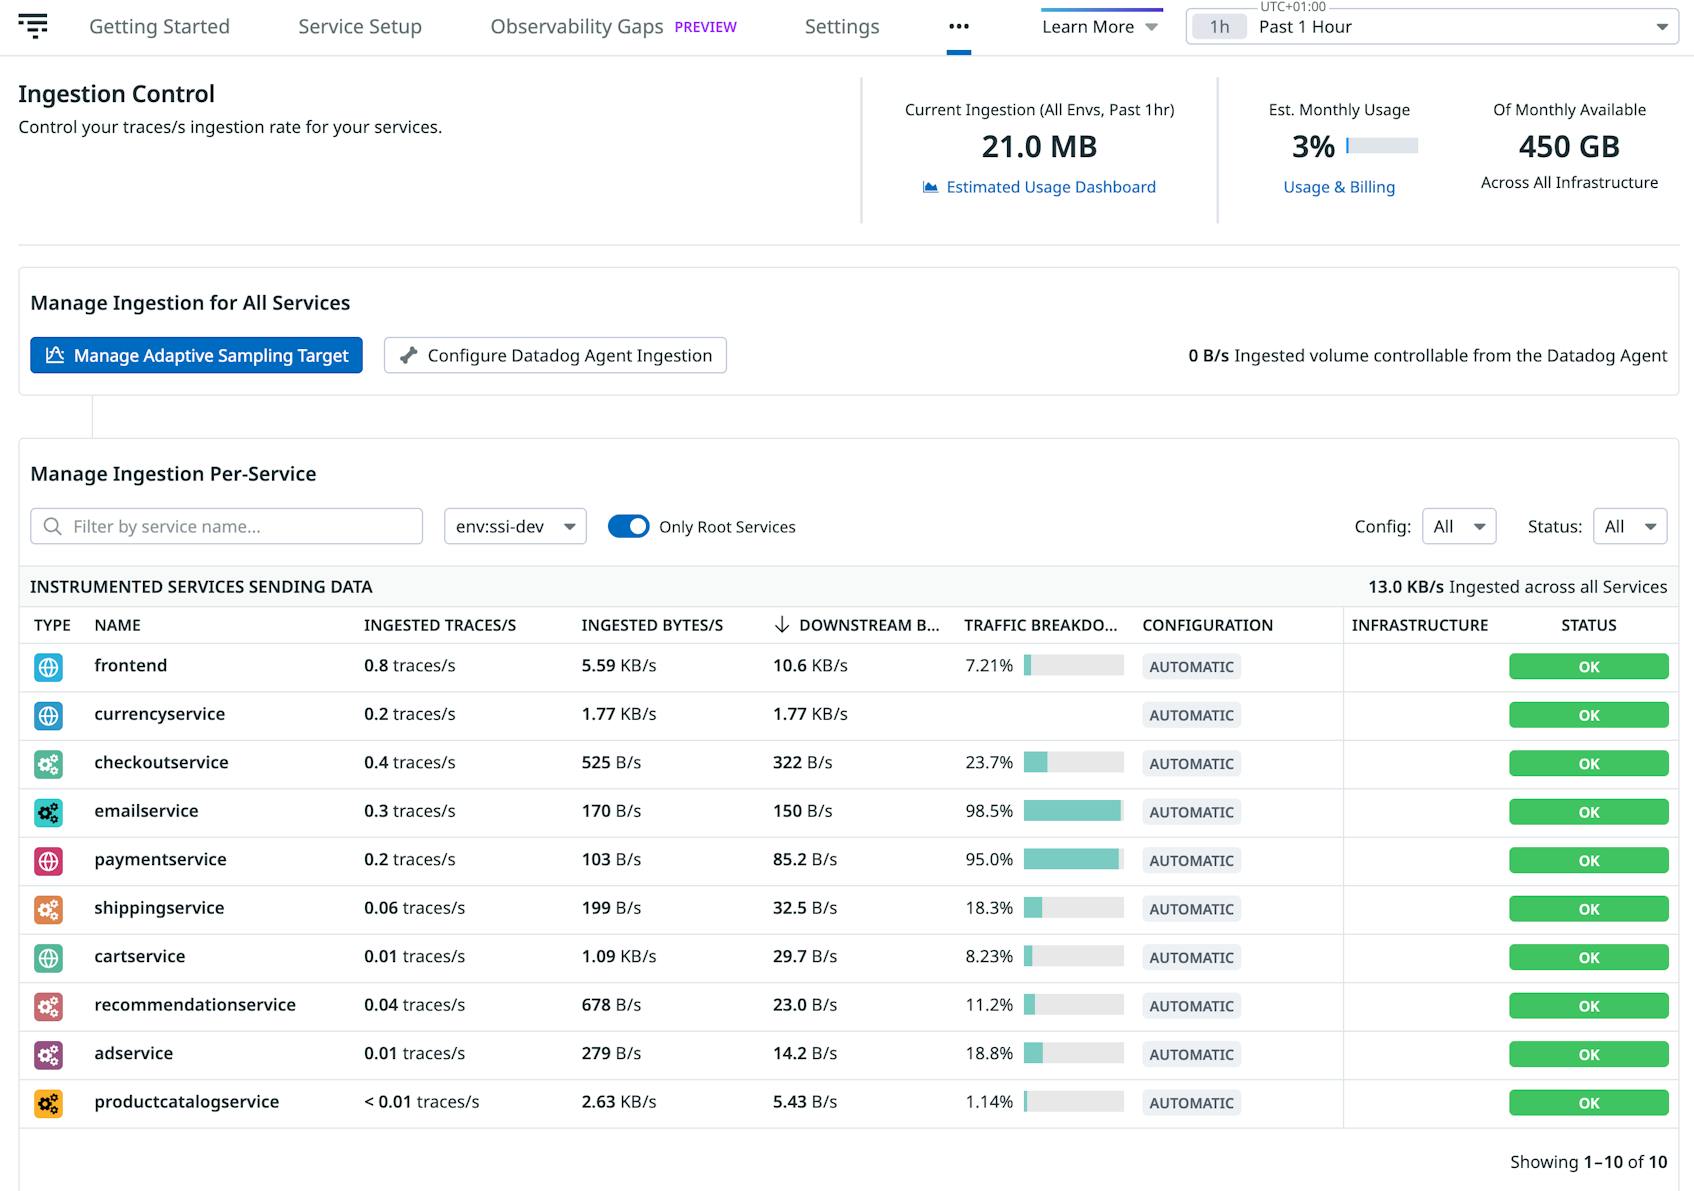
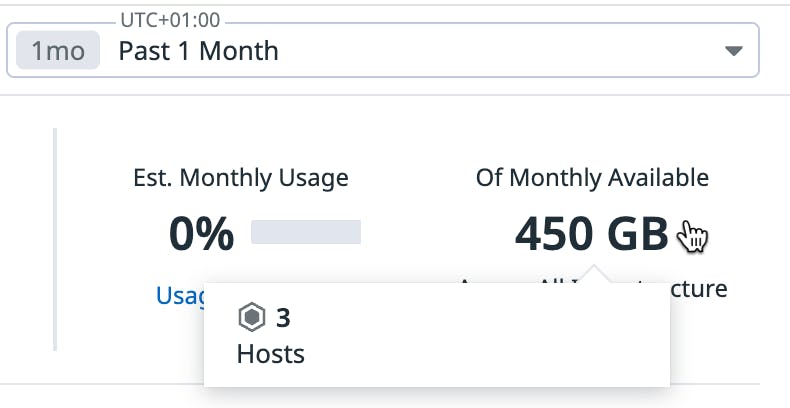
In the top right corner, the Ingestion Control page allows you to visualize your monthly ingestion allotment and the percentage of usage. You can hover over your monthly available allotment to see the number of your APM hosts.
On the Ingestion Control page you can also scope by environment and filter by only root services. In the middle of the page, the table lists all the different services within your application, where you can click on a service to view its detailed configuration and ingestion metrics.
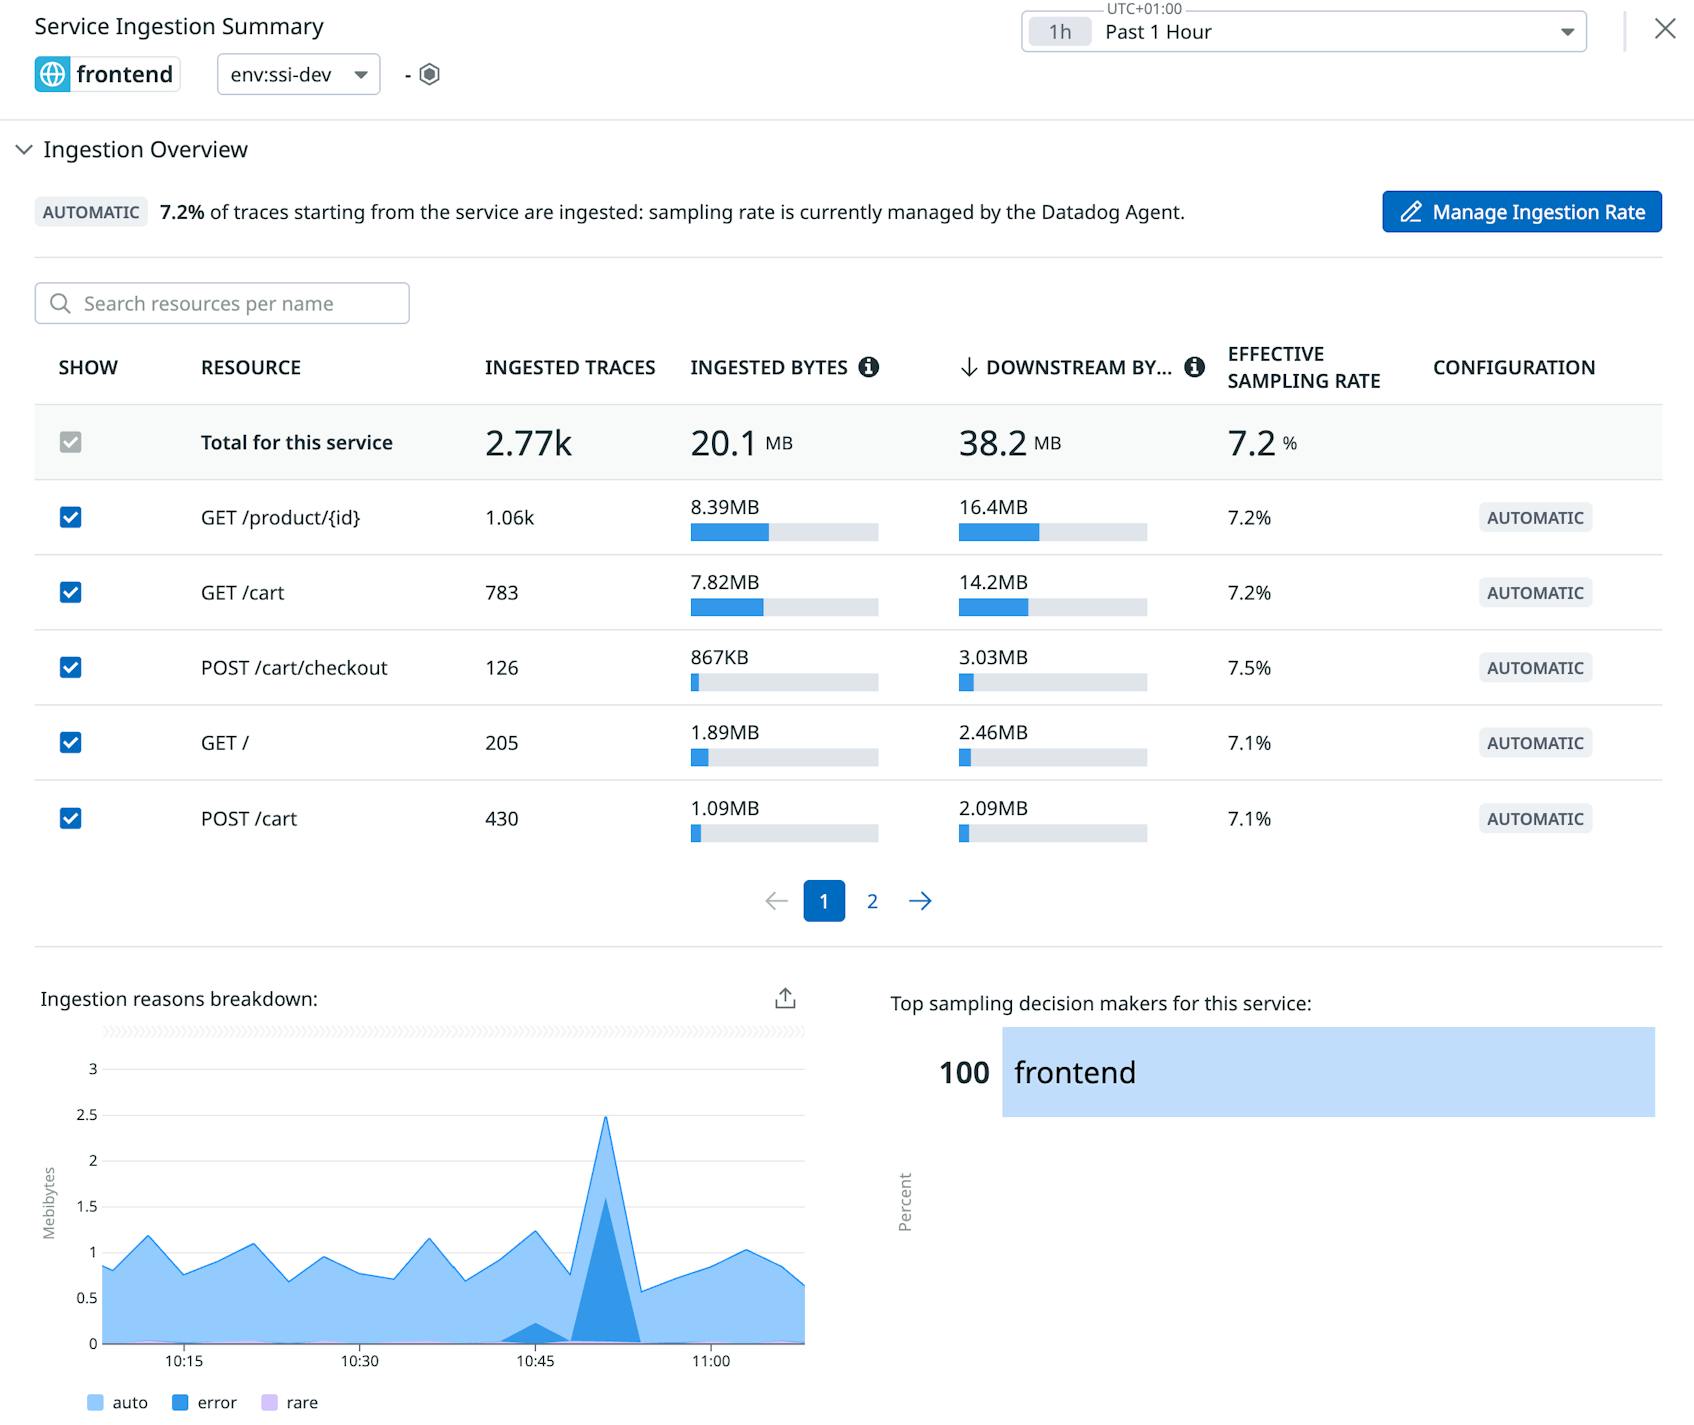
Here you can drill into a frontend service to understand how its different resources contribute to the overall ingestion volume and what are the top sampling decision makers.
The Ingestion Control Page is powered by usage metrics, which provide insights into your services’ data ingestion patterns, enabling you to make informed decisions about sampling rates and resource allocation. The page utilizes key usage metrics such as
datadog.estimated_usage.apm.ingested_spans (which estimates the number of spans ingested by Datadog’s APM) as well as datadog.estimated_usage.apm.ingested_bytes (which estimates the volume of data in bytes ingested). Both metrics are tagged by sampling_service, environment(env), and ingestion_reason. You can easily create custom dashboards to visualize these metrics over time, enabling you to monitor trends, identify anomalies, and understand the impact of configuration changes on ingestion volumes. Last but not least, you can also create a monitor to alert if datadog.estimated_usage.apm.ingested_bytes exceeds a certain threshold, indicating a potential surge in data ingestion that could impact costs or system performance.
Taming your ingestion volume
As anticipated, if defaults are not a good fit, you can easily change the sampling configuration at runtime without re-deploying applications.
If you are on Datadog Agent version 7.42.0 or higher, the default head-based 10 traces per second and 10 errors per second from the error sampling mechanism are remotely configurable. To do that, you need to enable remote configuration in your Agents. Then, you can control your sampling rates without having to restart the Agents.
If your preference is to apply changes locally, the Datatog tracing library allows you to configure sampling by service and endpoint, which we’ll talk more about in subsequent posts. In this case you need to restart the Agents in order to get changes applied.
To summarise, in Datadog you can configure sampling in two places: at the Datadog Agent level (this is the default behaviour) and at the Datadog tracing library level (this takes precedence over Agent setup).
What to do next
We have only scratched the surface of this topic, driving through some of the capabilities that Datadog offers to help companies successfully migrate to the cloud, facilitate their DevOps journey, and consolidate monitoring solutions.
During this first guide we had a sneak peak at how to master distributed tracing, saw some of the data volume challenges associated, and wrapped up by looking into Datadog’s approach to efficient sampling. Stay tuned for our follow up posts on best practices to efficiently retain only what matters for your business.