Instrument your app using the Datadog Operator and Admission Controller
10月 22, 2024
In today’s digital age, the ease of performing everyday tasks through just a few taps on our smartphones or swipes on a watch underscores the transformative role of applications in enhancing our daily lives.
Hailing a ride, finding a highly-rated bagel shop, looking up the best place to eat sushi, and buying tickets for an exhibition are all seamlessly facilitated by applications on our mobiles. This reliance on our smartphones not only made our travels more productive but also more enjoyable!
But, at the same time, each interaction with a mobile app represents today one or many complex interactions with thousands of microservices and third-party systems! Any slow performance, errors, or glitches in the app might disrupt our travel plans, poison user experience, and perhaps even alter the overall perception of our travels.
Observability isn’t just about making sure an application works; it is also about ensuring that each digital touchpoint enhances the user’s journey and the overall experience, making life more convenient and enjoyable.
In this blog post, we will start by exploring the Datadog Operator and the Admission Controller. We will then see how these could be used to simplify the way you monitor your applications with Datadog Application Performance Monitoring (APM). We will wrap it up by learning how the Datadog Admission Controller could inject tracing libraries into your applications. Let’s get started by exploring the Kubernetes Operator.
What is a Kubernetes Operator
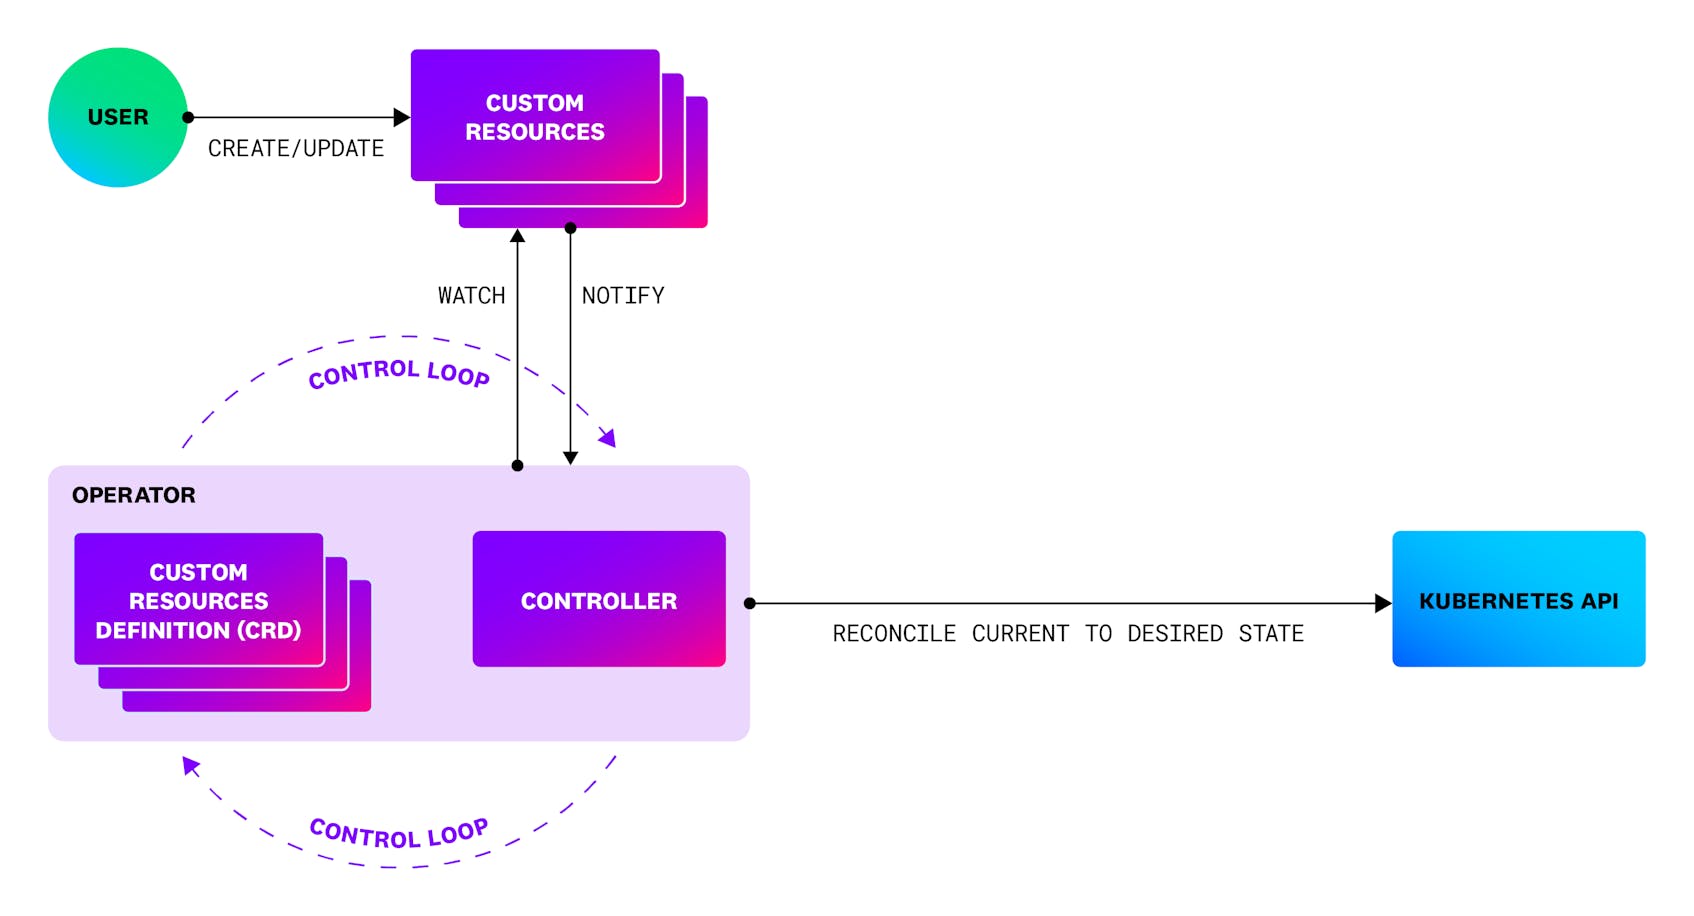
Kubernetes Operators are extensions to Kubernetes that use Custom resources to manage applications and their components. Operators follow the famous Kubernetes principles, also known as the control loop. In Kubernetes, controllers are infinite control loops that watch the actual and desired states of your cluster. When these two states differ, controllers will start making changes aiming to bring the current state of the cluster closer to the desired one. Operators can be used to simplify complex activities such as validating application’s state or reporting application configuration and state.
What is the Datadog Operator
Datadog Operator is a Kubernetes Operator that enables you to deploy and configure the Datadog Agent in a Kubernetes environment. By using the Datadog Operator, you can use a single Custom Resource Definition (CRD) to deploy the node-based Agent, the Datadog Cluster Agent, and Cluster check runners.
The Datadog Operator is primarily used to:
- Validate Datadog Agent configurations
- Keep all Datadog Agents up-to-date with your configuration
- Orchestrate for creating and updating Datadog Agent resources
- Report Datadog Agent configuration status in the Operator’s CRD status
What is an Admission Controller
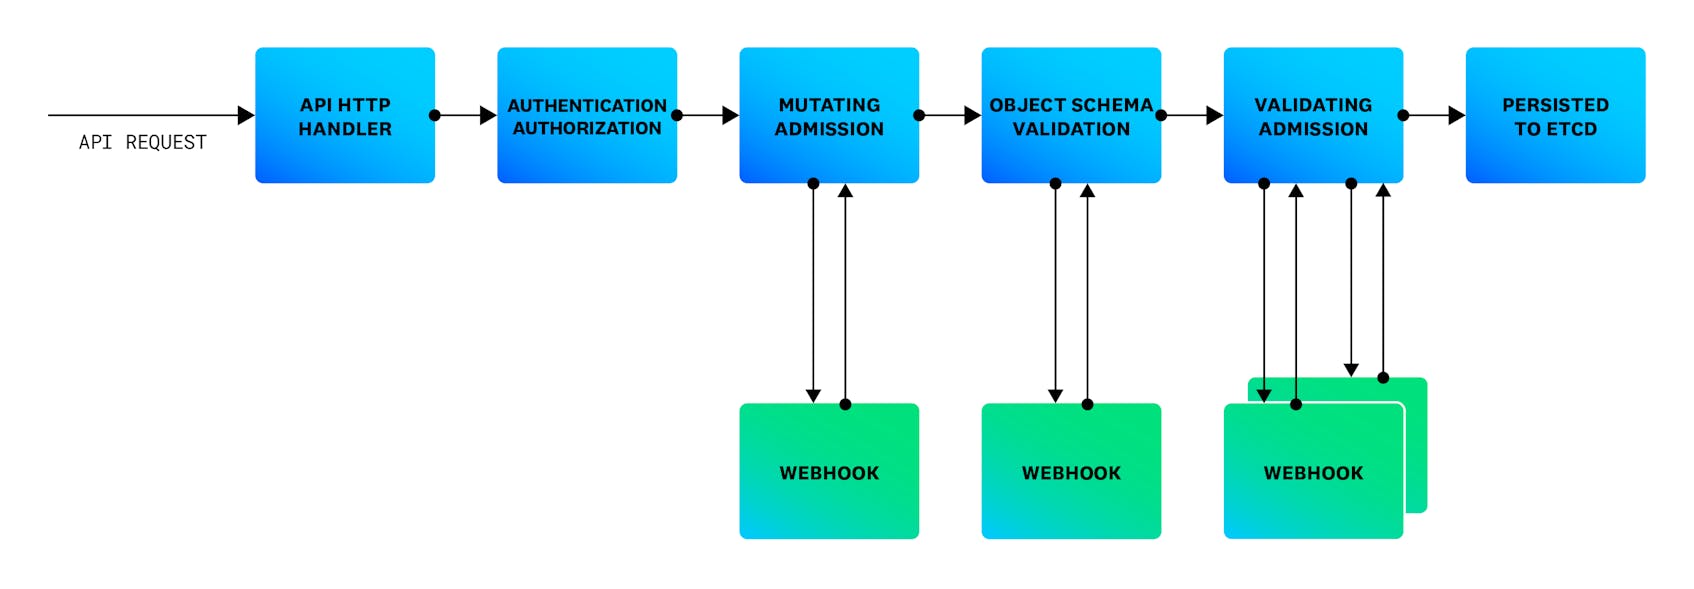
In a nutshell, Kubernetes Admission Controllers are plugins that regulate and enforce how a Kubernetes cluster is used. To expand, in Kubernetes, an Admission Controller acts as gatekeeper that intercepts (authenticated) API requests and may change the request object or deny a request.
In general, Admission Controllers might be used to validate, mutate, or both. Specifically, Mutating Controllers might modify related objects to the requests they admit; while on the other hand, Validating Controllers cannot.
Kubernetes comes with more than thirty Admission Controllers out of the box. The full list can be found here. Among these Admission Controllers it is worth mentioning two of them: ValidatingAdmissionWebhooks and MutatingAdmissionWebhooks. In fact, these two controllers are a bit special as they do not implement any decision logic themselves. Instead, the respective action, and the executed logic, is deferred to a webhook for a service running inside the Kubernetes cluster.
What is the Datadog Admission Controller
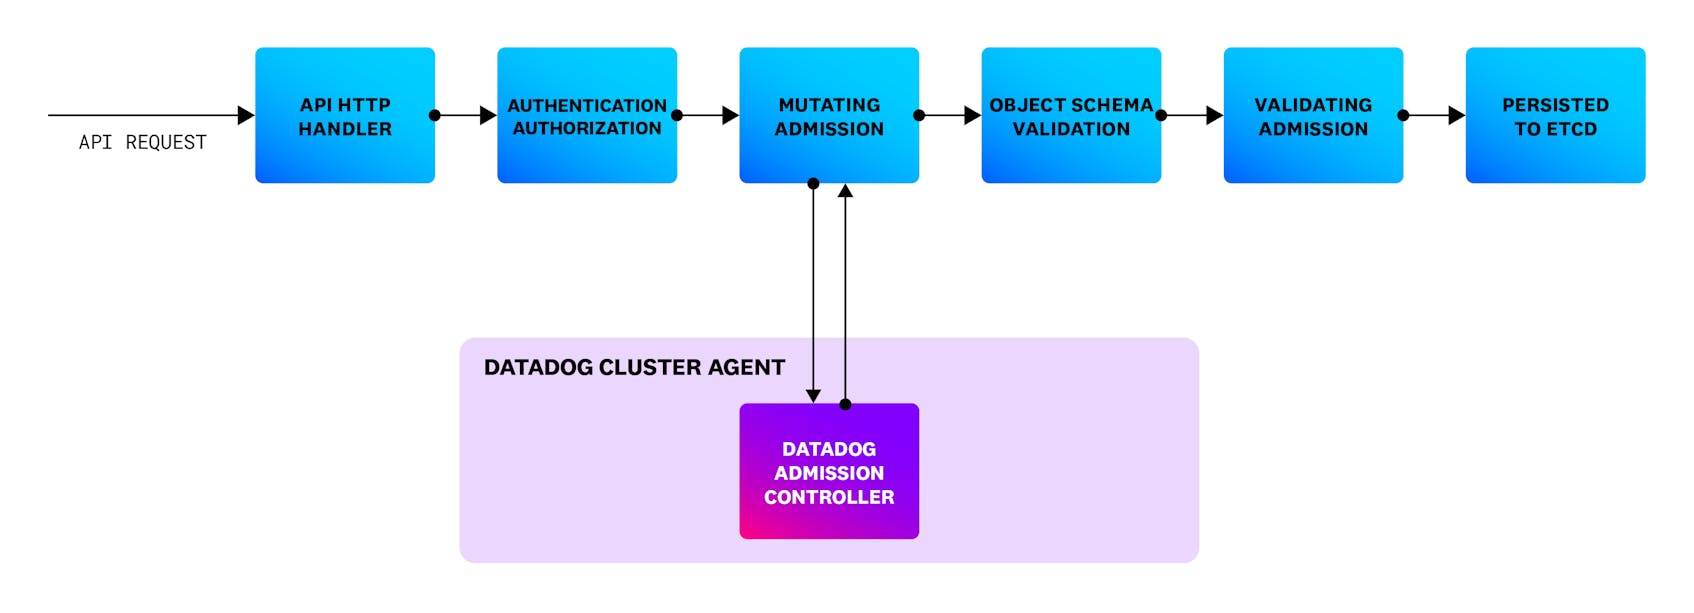
The Datadog Admission Controller is an important piece of the Datadog Cluster Agent. The main benefit of the Datadog Admission Controller is to simplify your life when it comes to configure your application Pods. Datadog’s Admission Controller is a Mutating Admission Controller type because it mutates, or changes, the pod’s configurations.
At high level the Datadog Admission Controller can help you:
- Inject environment variables such as DD_AGENT_HOST, DD_TRACE_AGENT_URL and DD_ENTITY_ID to configure DogStatsD and APM tracer libraries into your application containers.
- Inject Datadog Unified Service Tags such as env (DD_ENV), service (DD_SERVICE) and version (DD_VERSION) from application labels into the container environment variables.
Instrument your app with Datadog Admission Controller
Our engineering team has been working hard on the Datadog Admission Controller to make our lives easier. In fact, these are now the steps required to get your application instrumented, especially in K8s environments:
- 1. Install the Datadog Operator (one time)
- 2. Install the Datadog Agent (one time)
- 3. Deploy your application
It is no longer required to create a new image/version of your app just for monitoring purposes, nor is there a need to manually incorporate tracing libraries, as the Admission Controller will handle the injection process. Additionally, you do not have to insert Datadog variables or deploy a new image/version of your app.
The notable benefits that the Datadog Admission Controller brings is that it automates the process, ensuring consistent and error-free deployment across all services, eliminating the manual effort and potential for inconsistencies.
How does all of this work in practice
If you would like to jump into practical hands-on these are the requirements.
Requirements
- Docker Desktop with a local K8s cluster or any alternative such as Podman, kind, k0s, k3s, MicroK8s, Minikube, etc
- Kubernetes v1.20+
- Helm for deploying the Datadog Operator
- Kubectl CLI for installing the Datadog Agent
- A Datadog account with a valid API key
- Datadog Operator v1.5.0+
- Gradle installed (If building & running locally). (i.e Gradle 8.7)
- Git client
- Your favorite text editor or IDE (Ex Sublime Text, Atom, vscode…)
- An application written in one of the supported languages such as Java, Python, Ruby, Node.js, and .NET Core.
For the purpose of demonstrating how to instrument your application using Datadog Admission Controller we are going to use a simple Java app built with Spring. Here you can find the code.
Let us go through these steps together.
Install the Datadog Operator
Let us start installing the Datadog Operator with Helm:
helm repo add datadog https://helm.datadoghq.com
helm install my-datadog-operator datadog/datadog-operator
This confirms we have deployed the Datadog Operator:
NAME: my-datadog-operator
LAST DEPLOYED: Fri Apr 5 10:27:14 2024
NAMESPACE: default
STATUS: deployed
REVISION: 1
TEST SUITE: None
NOTES:
We are now going to create a Kubernetes secret with your API and application keys:
Let us make sure to replace <DATADOG_API_KEY> and <DATADOG_APP_KEY> with your Datadog API and application keys.
kubectl create secret generic datadog-secret - from-literal api-key=<DATADOG_API_KEY> - from-literal app-key=<DATADOG_APP_KEY>
Let us now create a datadog-agent.yaml file with the specs of our Datadog Agent deployment configuration. The configuration I have used here enables APM, metrics and logs. You can check all configuration options in the Operator configuration spec.
apiVersion: datadoghq.com/v2alpha1
kind: DatadogAgent
metadata:
  name: datadog
spec:
  global:
    clusterName: docker-desktop
    kubelet:
      tlsVerify: false
    tags:
      - env:dev
    credentials:
      apiSecret:
        secretName: datadog-secret
        keyName: api-key
      appSecret:
        secretName: datadog-secret
        keyName: app-key
  features:
    apm:
      instrumentation:
        enabled: true
        enabledNamespaces:
          - apps
        libVersions:
          java: v1.32.0
    logCollection:
      enabled: true
      containerCollectAll: true
    remoteConfiguration:
      enabled: true
As you can see, with just a few lines we were able to enable APM instrumentation, limit the scope to specific namespace(s) and specify the tracing library version at the cluster level. When apm.instrumentation.libVersions is set, only the specified libraries and versions are injected. You can also specify the library version at the service level, using the appropriate annotation for your language within your pod spec. You can find more information here.
Install the Datadog Agent
It is now time to deploy the Datadog Agent:
kubectl apply -f k8s/datadog/datadog-agent.yaml
You should see the following result:
datadogagent.datadoghq.com/datadog created
Deploy a sample application
It is now time to deploy the sample application on our K8s cluster. The deployment file we will use is named `depl.yaml`
We will create a separate namespace to host our application.
kubectl create ns apps
kubectl apply -f k8s/depl.yaml -n apps
That’s it, we have now our application running in K8s within two pods. We can check the pods are running with the following command:
kubectl get pods -n apps
You should see something similar to:
NAME                        READY   STATUS    RESTARTS   AGE
backend-6b4d65b76b-79bjb    1/1     Running   0          2m
frontend-8555c79d7d-8fhcn   1/1     Running   0          2m
The Datadog Operator and the Admission controller will now instrument our app with the required tracing library as defined in our datadog-agent.yaml.
To check if this is happening we can inspect our pod. You should use your pod name in the command below:
kubectl describe pod frontend-8555c79d7d-8fhcn -n apps
You can see an init-container has been added to our pod. This container includes the Datadog Java tracing libraries to a volume mount.
datadog-lib-java-init:
    Container ID:  docker://c7d47e929000b6019218487ff8cc754e453b185ef1debe220909c404bd7bb0b0
    Image:         gcr.io/datadoghq/dd-lib-java-init:v1.32.0

Mounts:
      /datadog-lib from datadog-auto-instrumentation (rw)
      /var/run/datadog from datadog (ro)
      /var/run/secrets/kubernetes.io/serviceaccount from kube-api-access-djb5t (ro)
Also JAVA_TOOL_OPTIONS has been modified to include javaagent and last but not least, Datadog specific environment variables have been added to the container:
Environment:
  DD_TRACE_RATE_LIMIT:              100
  DD_TRACE_SAMPLE_RATE:             1.00
  DD_RUNTIME_METRICS_ENABLED:       true
  DD_TRACE_HEALTH_METRICS_ENABLED:  true
  DD_LOGS_INJECTION:                true
  DD_TRACE_ENABLED:                 true
  DD_SERVICE:                       frontend
  DD_INSTRUMENTATION_INSTALL_TYPE:  k8s_single_step
  DD_INSTRUMENTATION_INSTALL_ID:    6d6c70b9-5669-450f-a6e0-9fbda2efce4a
  DD_INSTRUMENTATION_INSTALL_TIME:  1712746671
  DD_ENTITY_ID:                      (v1:metadata.uid)
  DD_DOGSTATSD_URL:                 unix:///var/run/datadog/dsd.socket
  DD_TRACE_AGENT_URL:               unix:///var/run/datadog/apm.socket
  URL:                              http://backend:8088
  JAVA_TOOL_OPTIONS:                 -javaagent:/datadog-lib/dd-java-agent.jar -XX:OnError=/datadog-lib/continuousprofiler/tmp/dd_crash_uploader.sh -XX:ErrorFile=/datadog-lib/continuousprofiler/tmp/hs_err_pid_%p.log
View APM traces in Datadog
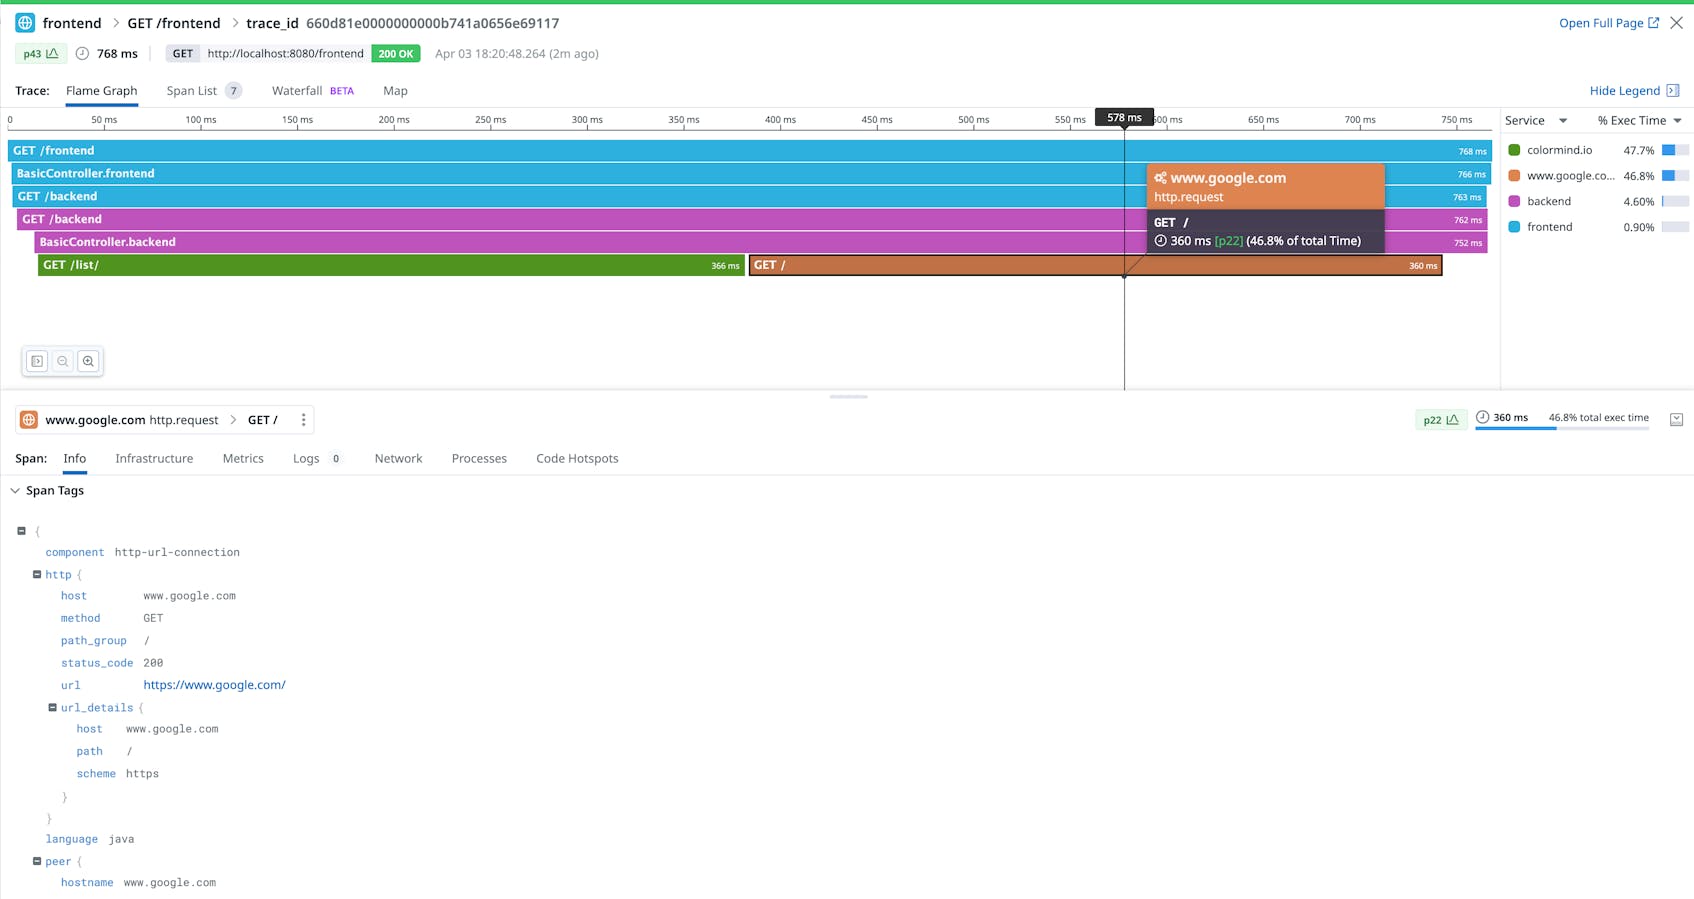
You can test the app by running the following command:
curl localhost:8080/frontend
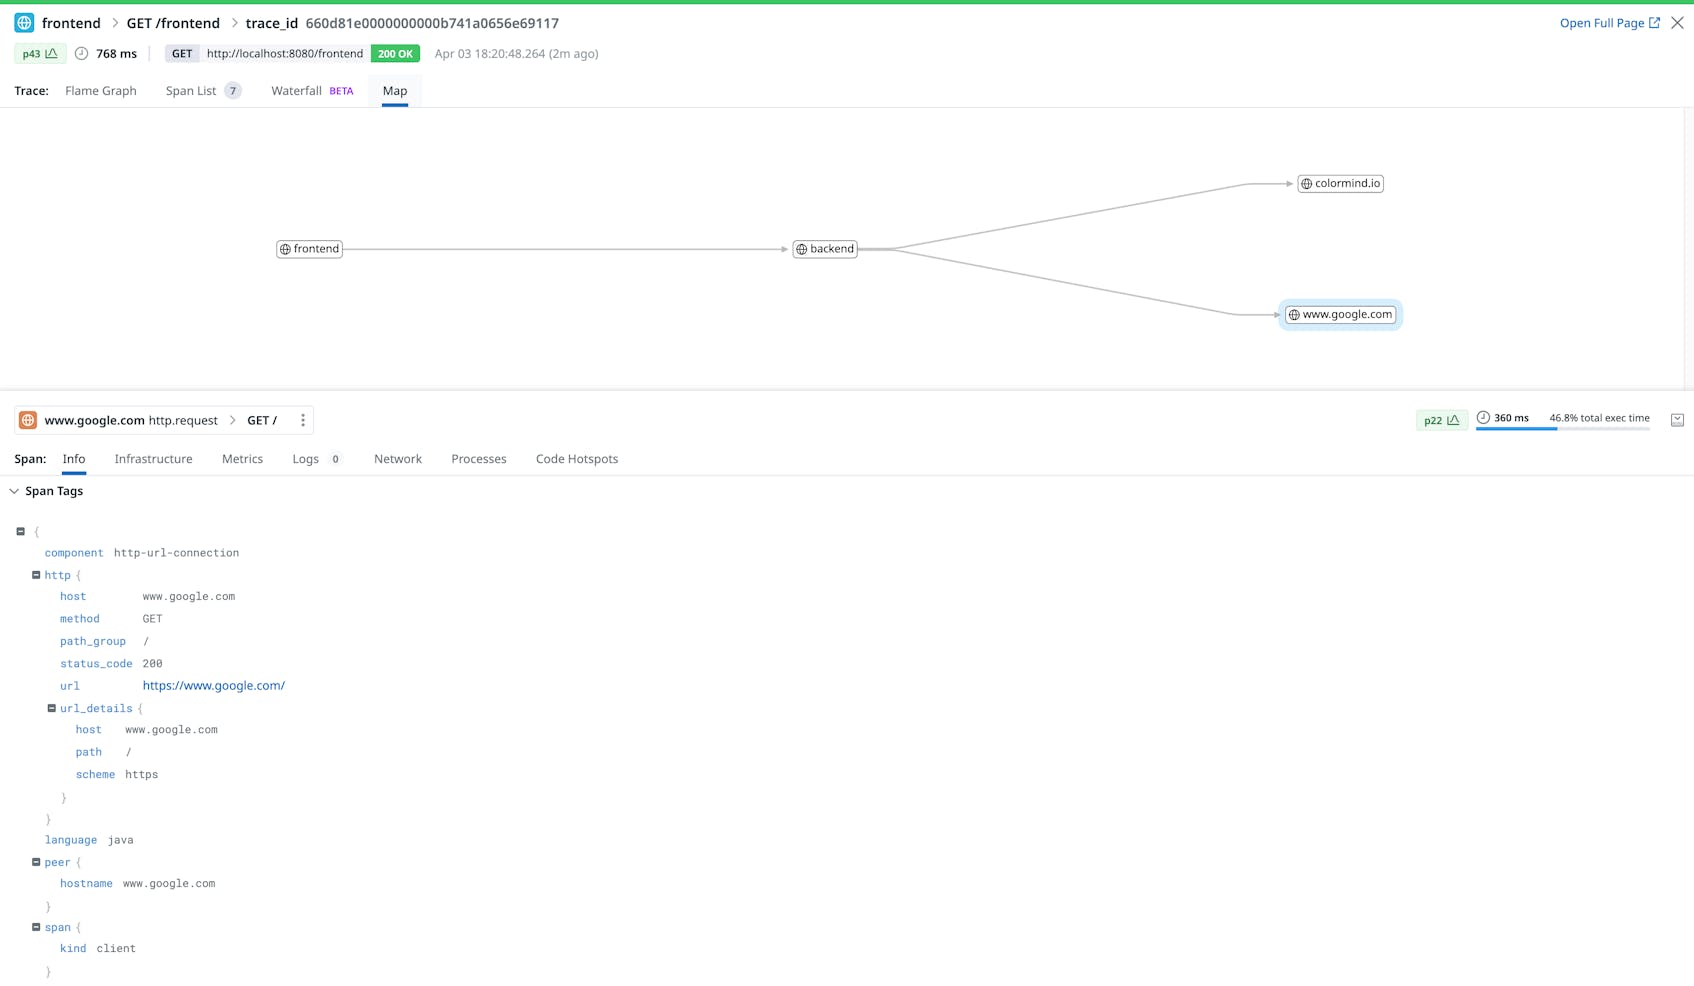
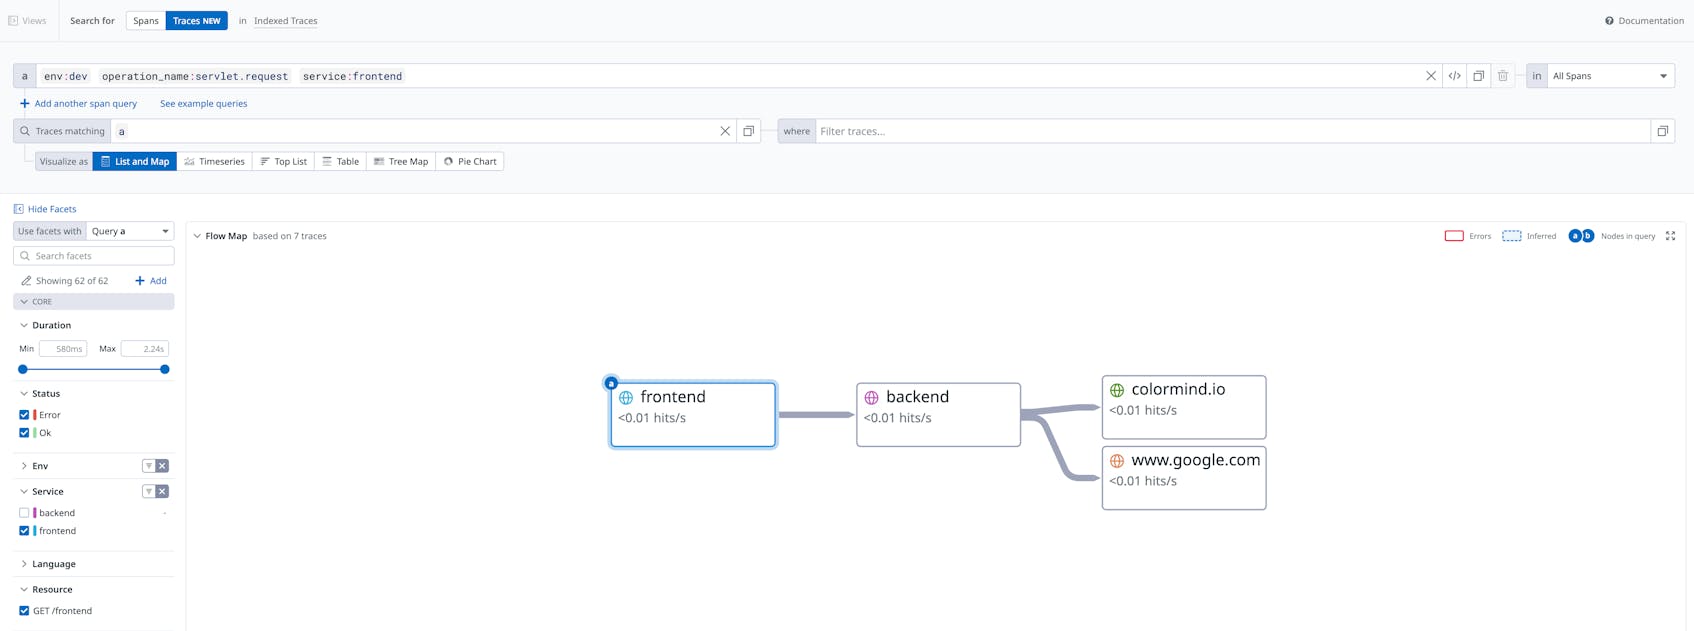
Then we can switch to the Datadog UI to explore Traces and see the associated Service Map as well.
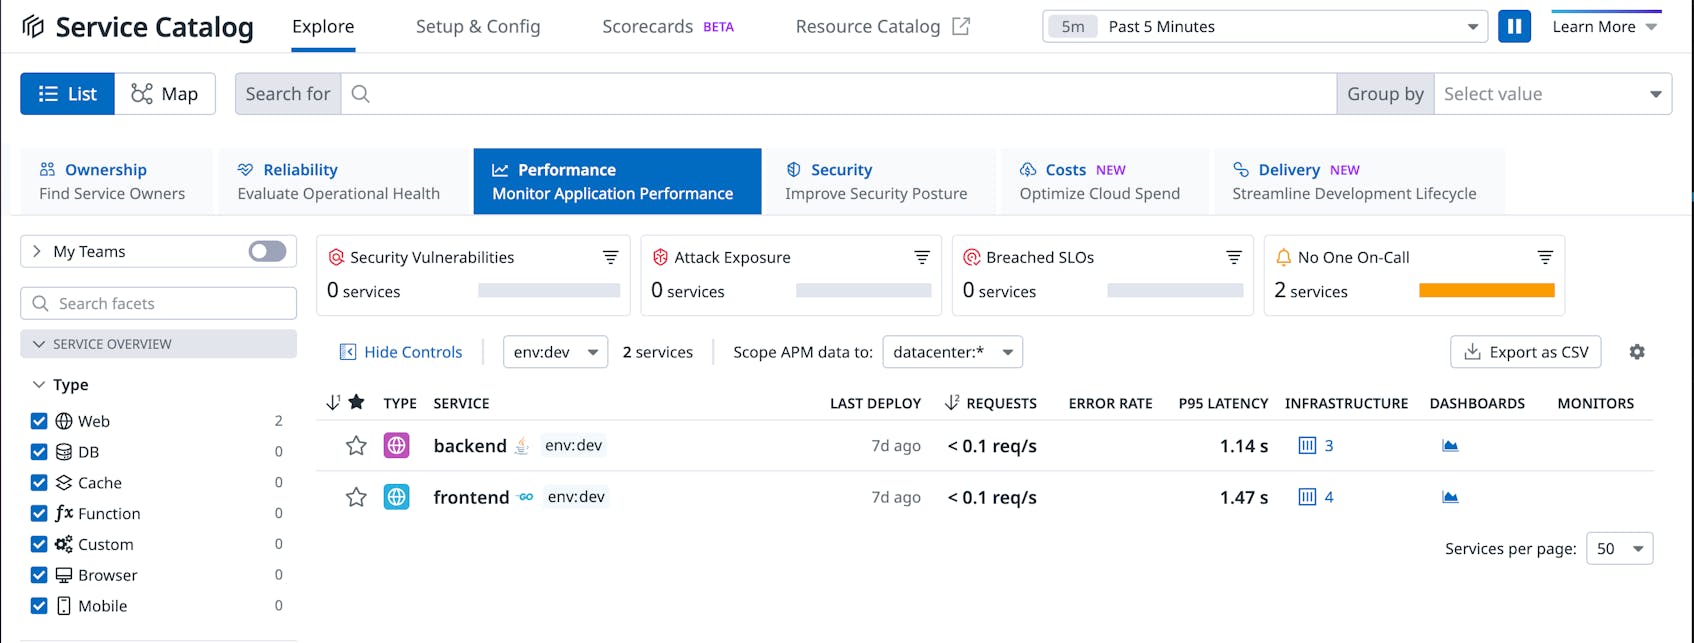
Also, we can see the two services reporting data under the Service Catalog page.
Clean up the environment
You can clean up your environment with the following commands:
Undeploy your app:
kubectl delete -f k8s/depl.yaml -n apps
kubectl delete namespace apps
You can delete the datadog agent with the following command:
kubectl delete -f k8s/datadog/datadog-agent.yaml
You can delete the datadog operator with the following command:
helm uninstall my-datadog-operator
Library injection via the Admission Controller makes it easier to instrument your services, enabling you to view APM traces in just minutes without changing or rebuilding your application. You can learn more about Datadog Library injection in our public documentation.
What to do next
We have just scratched the surface of Datadog APM driving through some of the capabilities that Datadog offers to help companies successfully migrate to Cloud, facilitate their DevOps journey as well as consolidate their monitoring solutions. During this first blog we demonstrated how to quickly get started with Datadog APM. Please, stay tuned for our follow up posts.
