Kubernetes Dashboards | Datadog

Create Real-Time Kubernetes Dashboards with Datadog

Build custom, interactive dashboards to get maximum visibility into your Kubernetes environment in minutes.

Why Datadog?

850+ Vendor-Backed Integrations

Datadog offers wide coverage across any technology, with support provided by Datadog


Out-Of-The-Box Dashboards

Nearly instant time to value for both set up and investigation


Enterprise Scale & Reliability

Whatever your scale or use cases, take advantage of our SaaS platform that’s always prepared to handle more


Autodiscovery

Datadog automatically discovers containers and services running on them as they are created and destroyed


850+ Turn-Key Integrations, Including

Product Benefits

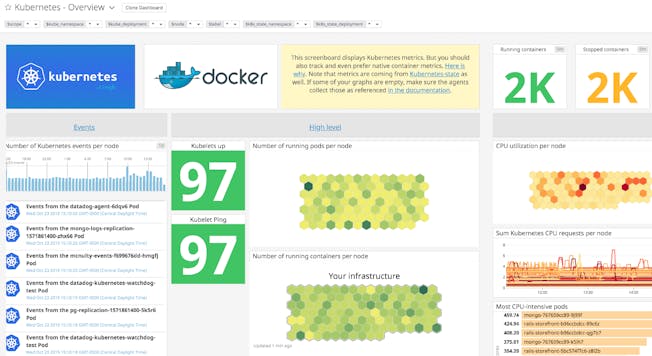
Get More Visibility into Your Environment with Datadog's Kubernetes Dashboard

  • Elevate your Kubernetes monitoring by visualizing data alongside metrics from 850+ other supported technologies in unified dashboards
  • Track the health and performance of your containerized applications, regardless of the underlying platform
  • Quickly pivot from problems spotted in your Kubernetes dashboards to a specific container image, pod name, or region without losing context
dg/k8s-dash-2-new-cropped.jpg


Easily Customize Visualizations to Fit Your Team's Needs

  • Track critical KPIs, SLOs, and SLAs using dashboard widgets; correlate SLO performance with specific metric spikes or dips
  • Analyze alerts for your SLIs within dashboards for faster troubleshooting and to prevent downtime
  • Choose from a multitude of different visualization types, including geomap graphs, heatmaps, stacked graphs, toplists, and more

Attain Immediate, Actionable Insights

  • Visualize anomalous behavior throughout your system in one click with Metric Correlations
  • Test hypothesis in seconds by overlaying events onto time-synchronized graphs
  • Automatically surface issues within your infrastructure and applications; diagnose root causes faster with machine-learning features such as Watchdog, forecasting, and Metric Correlations

Track Changes in Your Containerized Infrastructure

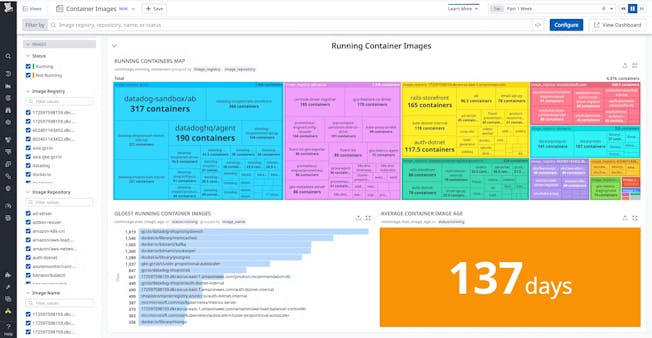
  • Gain key insights into every container image used in your environment—and about your entire container image ecosystem
  • Understand large-scale trends in security posture and resource utilization with image-specific metric dashboards
  • Reduce costs by spotting cloud registries that you may be paying for but not actively using, as well as images that are taking up unnecessary disk space in your hosts
dg/container-image-trends-image-2.png

Monitor Your Kubernetes Clusters More Effectively

  • Automatically detect and monitor your containers as quickly as they are created and destroyed
  • Easily analyze the health of all your containers distributed across any cloud environment in a single pane of glass with the cluster agent
  • Avoid resource contention and deficiency by drilling into individual containers running hot with 1 click
  • Collect, monitor, and visualize high-granularity metrics from all your containers at 15s. granularity for 15 months – including CPU, I/O, and memory

Manage High-Scale K8s Environments with Confidence

  • Enable low impact monitoring of 10,000+ nodes with the cluster agent
  • Optimize horizontal auto-scaling by connecting Datadog to your HPA and collecting request rate, latency, and available network bandwidth
  • Gain visibility into container orchestration and easily manage Kubernetes pods over or under-allocating available resources via the real-time live container view and auto-generated container map
  • Improve operational costs and reduce excess capacity based on high-granularity historical data

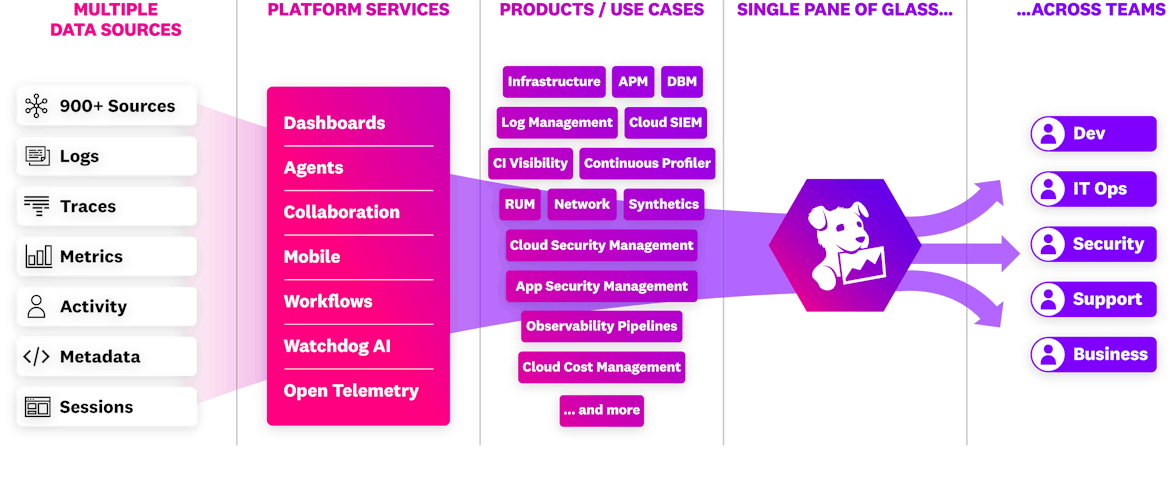
The Essential Monitoring and Security Platform for the Cloud Age

Datadog brings together end-to-end traces, metrics, and logs to make your applications, infrastructure, and third-party services entirely observable.

Platform Diagram

Loved & Trusted by Thousands

Washington Post logo 21st Century Fox Home Entertainment logo Peloton logo Samsung logo Comcast logo Nginx logo