Try Datadog APM, Get a Free T-Shirt | Datadog

Monitor Your Entire Microservices Architecture

Monitor all aspects of your microservices architecture and improve performance with full-stack monitoring from Datadog. Start your trial today, create a dashboard, and we’ll send you a free Datadog t-shirt!

Due to unforeseen shipping charges to the recipient we are no longer able to send t-shirts to India. Full rules and eligible countries here.

tshirt/190509_generic-tshirt_hero_shirt

Why Datadog?

End-to-End Distributed Tracing

Set up in minutes, and instantly visualize your traces with full control over ingestion, retention, and costs


Code Hotspots And Thread Level Insights

Optimize the most resource consuming lines of production code with our low-overhead Continuous Profiler


Automatic Deployment Tracking

Requests, errors, and latency metrics for every code deploy including out-of-the-box code version comparisons


Superior Granularity & Retention

0-second OOTB high resolution, 1-second availability for critical metrics, 15-month retention, and no roll-up, ever


800+ Turn-Key Integrations, Including

Product Benefits

Simplify Complexity with End-to-End Visibility

  • Monitor all aspects of your microservices architecture from the user interaction to back-end storage - in a single platform
  • Easily identify bottlenecks, errors, heavy traffic issues, slow-running queries, and more with end-to-end application tracing, latency breakdowns, continuous profiling, and real user monitoring
  • Automatically collect, monitor, and visualize high-granularity data and custom metrics in real time, including availability, response times, reliability, error rates, and throughput

Resolve Application Performance Issues Faster

  • Identify critical issues quickly with real-time service maps, AI-powered synthetic monitors, and alerts on latency, exceptions, code-level errors, and more
  • View logs and traces in context with automatic trace_id injection
  • Test hypotheses in seconds by overlaying application events onto time-synchronized metric graphs
  • Eliminate inefficiencies caused by context switching with a consolidated platform for monitoring, paging, and resolving incidents

Easily Optimize Code-Level Performance

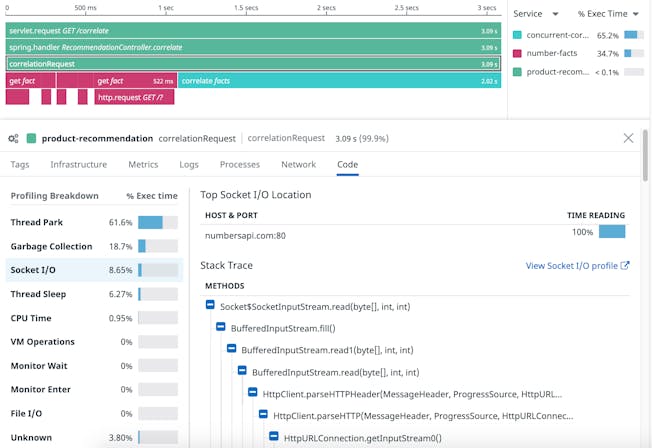
  • Detect the most resource-consuming code lines, methods, and classes in your applications in seconds with a lightweight, next-generation profiler that’s easy-to-use and always-on
  • Determine the root cause of code issues with a breakdown of time spent by method on CPU, garbage collection, lock contention, and I/O; improve CPU utilization, memory allocation, and user latency
  • Surface runtime activity and performance problems such as deadlocked threads, inefficient garbage collection, and memory leaks
apm/gif-3-code-level-visibility.png

Monitor Your Containerized Environment More Effectively

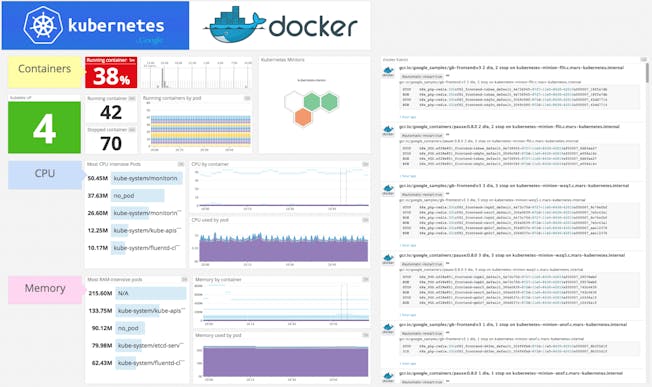
  • Automatically collect, monitor, and visualize high-granularity metrics from all your containers at 15s. granularity for 15 months
  • Analyze the health of all your containers by pod, namespace, and node distributed across any cloud environment
  • Gain visibility into container orchestration and easily manage Kubernetes pods over or under-allocating available resources via the real-time live container view and auto-generated container map
  • Optimize horizontal auto-scaling by connecting Datadog to your HPA and collecting request rate, latency, and available network bandwidth
kuberneteslp.png

Start Monitoring Proactively and Ensure Optimal Performance

  • Proactively prevent outages and errors by alerting on metric forecasts or specific data point thresholds
  • Set up alerts for anomalies and outliers that account for daily, weekly, and seasonal fluctuations
  • Automatically detect unanticipated outliers, anomalies, and errors with Watchdog
  • Track all key service-level indicator metrics in real time, including availability, response times, reliability, error rates, and throughput

The Essential Monitoring and Security Platform for the Cloud Age

Datadog brings together end-to-end traces, metrics, and logs to make your applications, infrastructure, and third-party services entirely observable.

Platform Diagram

Loved & Trusted by Thousands

Washington Post logo 21st Century Fox Home Entertainment logo Peloton logo Samsung logo Comcast logo Nginx logo