Real-Time Interactive Dashboards | Datadog

Real-time Interactive Dashboards

Correlate metrics, traces, logs, and more for collaborative analysis.

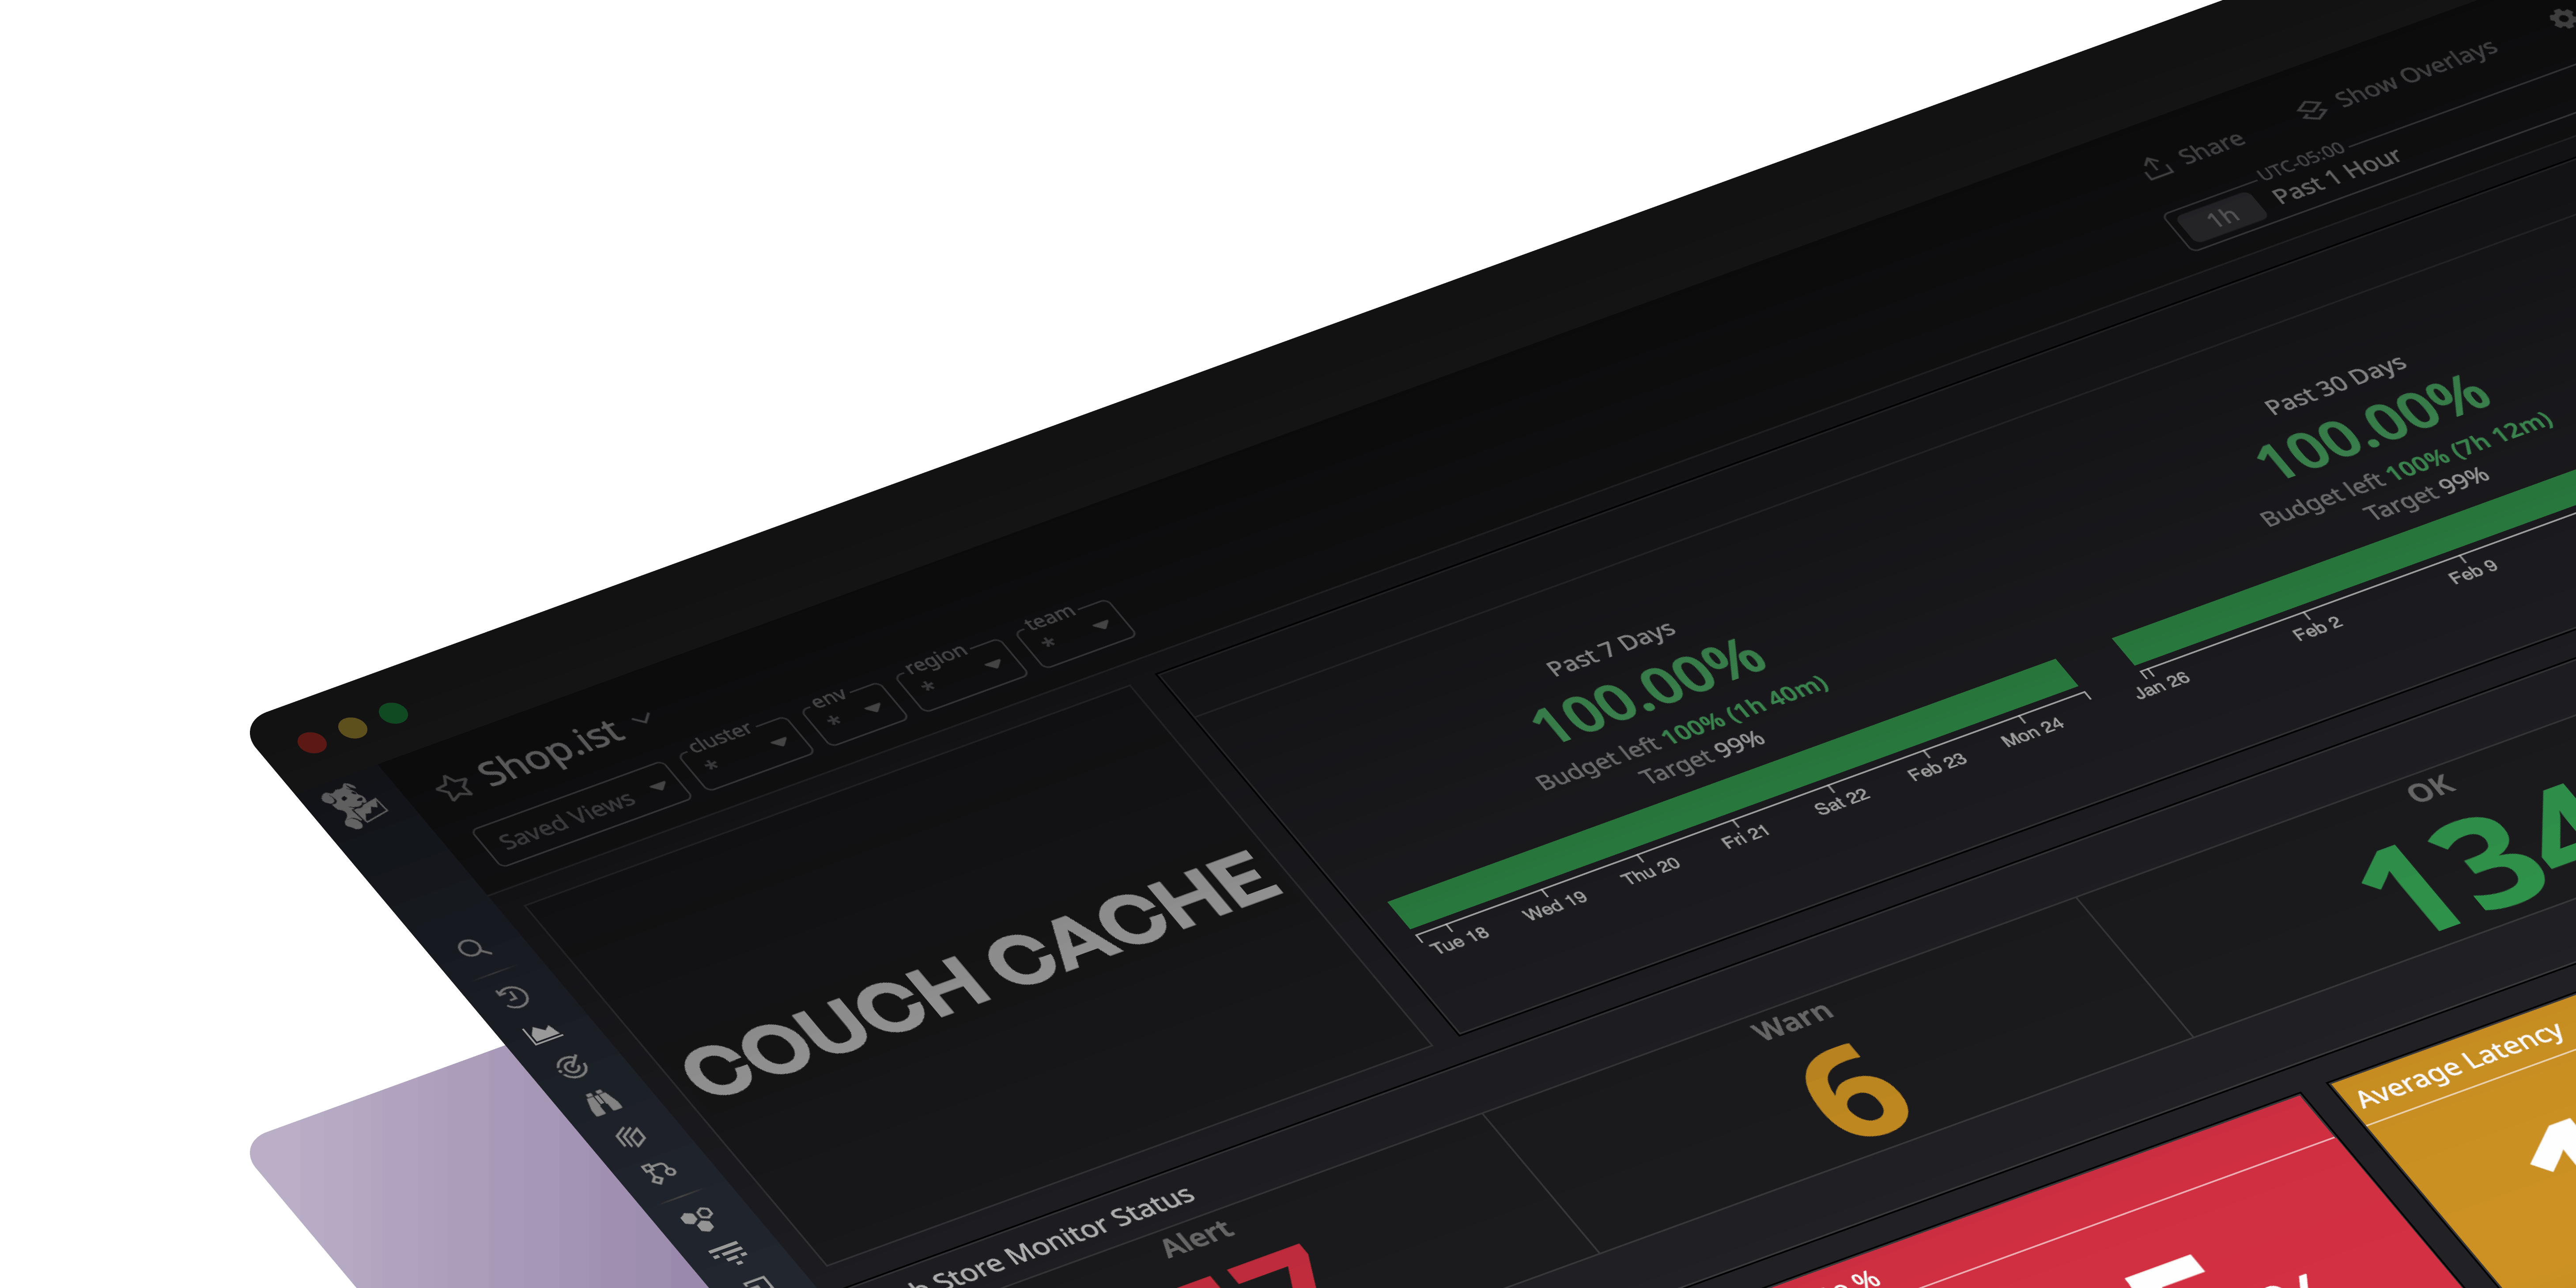
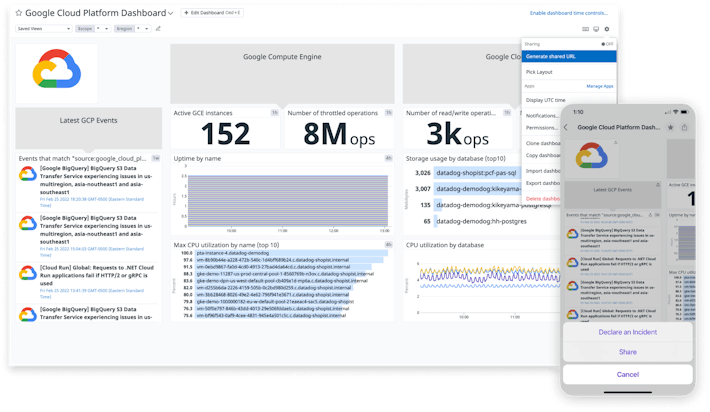
Datadog’s out-of-the-box dashboards allow you to analyze data from across your entire system in a single pane of glass. Template and auto-generated dashboards enable your team to immediately benefit from dynamic views with no query language or coding required. You can also customize your dashboards with a vast library of visualization tools and drag-and-drop widgets to best meet your team’s needs.


Synthesize all of your data with the click of a button

  • See performance overviews and business metrics side-by-side for alignment and easy correlation
  • Pivot in one click to relevant data in other parts of the platform without losing context
  • Explore your infrastructure, logs, UX, security, and network performance together for complete visibility

Create new dashboards in seconds

  • Get started quickly with out-of-the-box and template dashboards, drag-and-drop widgets, and keyboard editing shortcuts
  • Autogenerate custom dashboards via the API for quick time to creation
  • Build new views with no query language or coding required

Customize views and visualizations that are relevant to your team

  • Highlight current values of critical KPIs, SLOs, and SLAs with alerts directly in your dashboards
  • Automatically graph any data with Datadog’s geomap graphs, heatmaps, stacked graphs, toplists, and more
  • Select from an extensive library of formulas and functions to best represent your data

Bring in collaborators and share dashboards with stakeholders

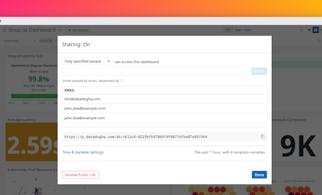
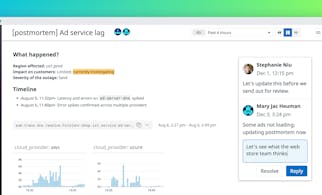
  • Use Datadog’s built-in collaboration features to share dashboards with anyone in your organization during outages or ongoing investigations
  • Generate authenticated public dashboards to provide real-time views to external teams
  • Apply sophisticated internal access controls to always share securely
Customize views and visualizations that are relevant to your team

Improve data insight with correlations, custom functions, and transformations

  • Use built-in formulas to analyze metrics, or use the code editor to write your own transformations
  • Seamlessly toggle between edit, overview, and correlation modes for each graph
  • Compare metrics month-to-month or over custom periods of time

Customer Testimonials

eBook: Monitoring Modern Infrastructure

Explore key steps for a successful cloud-scale monitoring strategy

Resources

How_to_Build_A_Unified_Dashboard

in the wild

How to Build A Unified Dashboard
How_to_Create_a_Graph_Using_Tags_and_Time_Aggregation

in the wild

How to Create a Graph Using Tags and Time Aggregation
/blog/dashboard-sharing/authenticated_public_dashboards_201209_v2a

BLOG

Share Datadog dashboards securely with anyone outside of your organization
/blog/collaborative-notebooks-datadog/notebooks-hero

BLOG

Tell data-driven stories with Collaborative Notebooks