Need: Alerting for Current Issues and Historical Problem Analysis
Due to the rapid scaling required for their application’s infrastructure, CircleCI was becoming increasingly frustrated with their existing monitoring solutions’ ability to judge the health and performance of their servers, databases, and other IT components. When David Lowe began as a backend developer at CircleCI, the team was using several monitoring tools that had been patched together. This required the CircleCI team to spend hours every week deciphering and cross-referencing the outputs of each tool to answer questions like: “How are our queries loading?” “When the queries are slow, are they all slow?” or “Is this specific event random?” These extra steps led Lowe to become concerned about how the team was using its time. Additionally, Lowe was unhappy with how CircleCI’s monitoring solution only stored metrics for two weeks. “We like to have the data long enough so if something weird happens we can see when it started, and that number always seems to be longer than two weeks ago,” stated Lowe. Boosting the length that CircleCI could store historical metrics could only be done by pulling the data out and storing it on a separate platform. This was unappealing since CircleCI was “trying to avoid building a monitoring solution ourselves.”
The final straw occurred when CircleCI missed an outage that should have been caught early by its monitoring system. Lowe knew then that he had “hit the limit with [their] tools” and needed to implement a more effective and sensitive monitoring solution that would scale automatically with CircleCI’s growth.
“ We used to have to go back and dig through logs, but using Datadog, we are able to track live processes to prevent problems.”
David Lowe
Backend Developer, CircleCI
Alerting, Events, and Metrics All in One Place
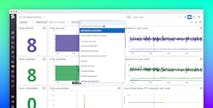
In the first few days of trying Datadog, Lowe confirmed that this solution met all of the requirements that CircleCI needed without having to build the product themselves. “Datadog has alerting, events, and metrics all in one place,” said Lowe. This was a huge plus, since Lowe felt that other solutions were trying to treat monitoring as a multifaceted problem. “Datadog treated it as one problem,” said Lowe, giving him and his team the ability to visualize all the data in a single pane.
Decreasing the Number of Monitoring Solutions Needed
In order to handle rapidly scaling traffic, CircleCI needed to tell at a glance whether their system was performing well or not. According to Lowe, “Datadog gave us the ability to quickly visualize a fairly large EC2 cluster’s behavior. Visualizing the data is important because it summarizes large amounts of data in small images.” According to Lowe, with CircleCI’s previous system, “it was impossible for us to make alerts, hard for us to make new visualizations across old data, and impossible for us to look back at historical data. So when we got Datadog, we were suddenly publishing graphs that gave us new ways of looking at our data. It was eye opening.”
For example, before CircleCI made the switch over to Datadog, they had a known issue in which some of their API calls were slow. “But we didn’t really have a sense of which ones were slow since we had gigabytes and gigabytes of information to process. All we had before were logs, and logs aren’t good for finding patterns.” said Lowe. Since Datadog placed their alerts, metrics, and events all in one place, Lowe now had the capability to place a number of timeseries next to each other so that he could see where the spikes and patterns occurred. Not only did this allow them to fix the API issue, but it also revealed previously hidden problems, which they were then able to fix before customers were impacted.
“ We no longer use Nagios for alerting. We use Datadog’s alarms, and then we push the data into PagerDuty.”
David Lowe
Backend Developer, CircleCI
Going forward, Lowe and his team will evaluate the performance of new code and features by determining what metrics will be measured, and then selecting the right alerts. They will accomplish this by customizing the metrics on the screens in their office that show Datadog, which exist purely to provide constant feedback on CircleCI’s infrastructure. With metrics, alerts, and events all in one Datadog dashboard, Lowe’s team has been able to quickly gain the information they need to enhance CircleCI’s testing platform.
“ With CircleCI’s previous system, it was hard for us to make alerts, hard for us to make new visualizations across old data, and impossible for us to look back at historical data. So when we got Datadog, we were suddenly publishing graphs that gave us new ways of looking at our data. It was eye opening.”
David Lowe
Backend Developer, CircleCI


