Lior Belenki
Last year, we introduced Watchdog to help Datadog APM users detect performance problems in their services by applying machine learning algorithms to automatically surface anomalies. Today, we're excited to announce Watchdog for Infra, which expands the scope of Watchdog to automatically provide ongoing visibility into the health and performance of your infrastructure with no setup required. Watchdog for Infra also supports popular technologies—like Redis, PostgreSQL, and Amazon Web Services (AWS)—and provides guidance on how you can resolve the issues it detects.

Auto-detect infrastructure problems
Modern infrastructure is complex and challenging to monitor. Instances scale up and down to accommodate real-time workloads, and serverless functions power large numbers of interdependent microservices. It can be hard to detect problems in ephemeral infrastructure or even know what monitors to configure to get full coverage. Watchdog for Infra addresses these challenges in two ways: by automatically detecting infrastructure performance anomalies at any scale and by applying domain expertise to explain how they occurred—and what you can do to remedy these problems.

Watchdog for Infra will spot anomalous patterns in the following areas of your infrastructure:
- Host-level memory usage
- Host-level TCP retransmit rate
- PostgreSQL
- Redis
- NGINX
- Amazon Web Services (S3, ELB, CloudFront, DynamoDB)
We're expanding Watchdog to monitor even more technologies; see the documentation for a complete list.
Understand the story
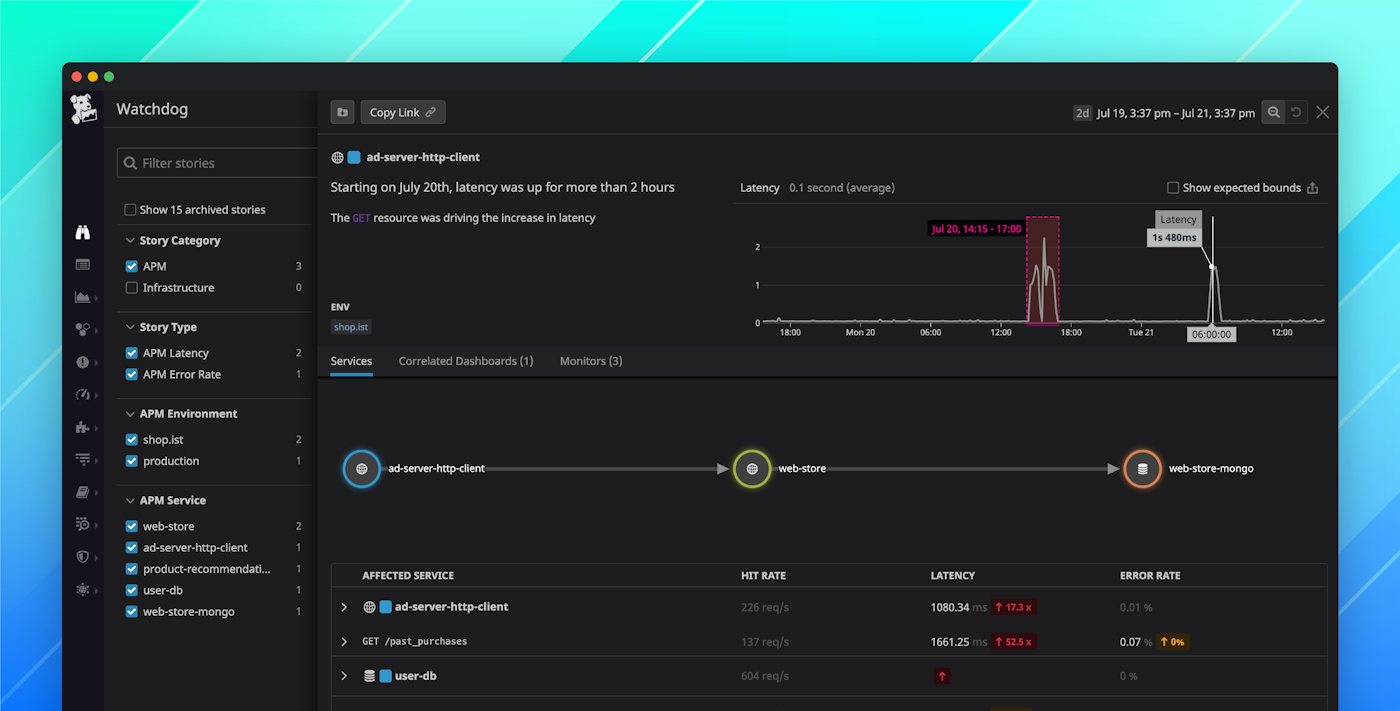
Watchdog continuously evaluates your infrastructure metrics to determine a normal baseline range of values. If metrics fall outside the expected range, Watchdog creates a story that appears on the Watchdog page.
If you've used Watchdog for APM, you're familiar with the basic elements of a Watchdog story: a graph highlighting the timeframe of the anomaly and an easy-to-read description of what happened and in exactly what part of your system. If the story is about one of Datadog's integrations—such as Redis, NGINX, PostgreSQL, or AWS CloudFront—it will also provide guidance for interpreting what it means and recommended next steps. All of this happens without any configuration on your part; you don't need to define monitors or keep eyes on your dashboards at all times.
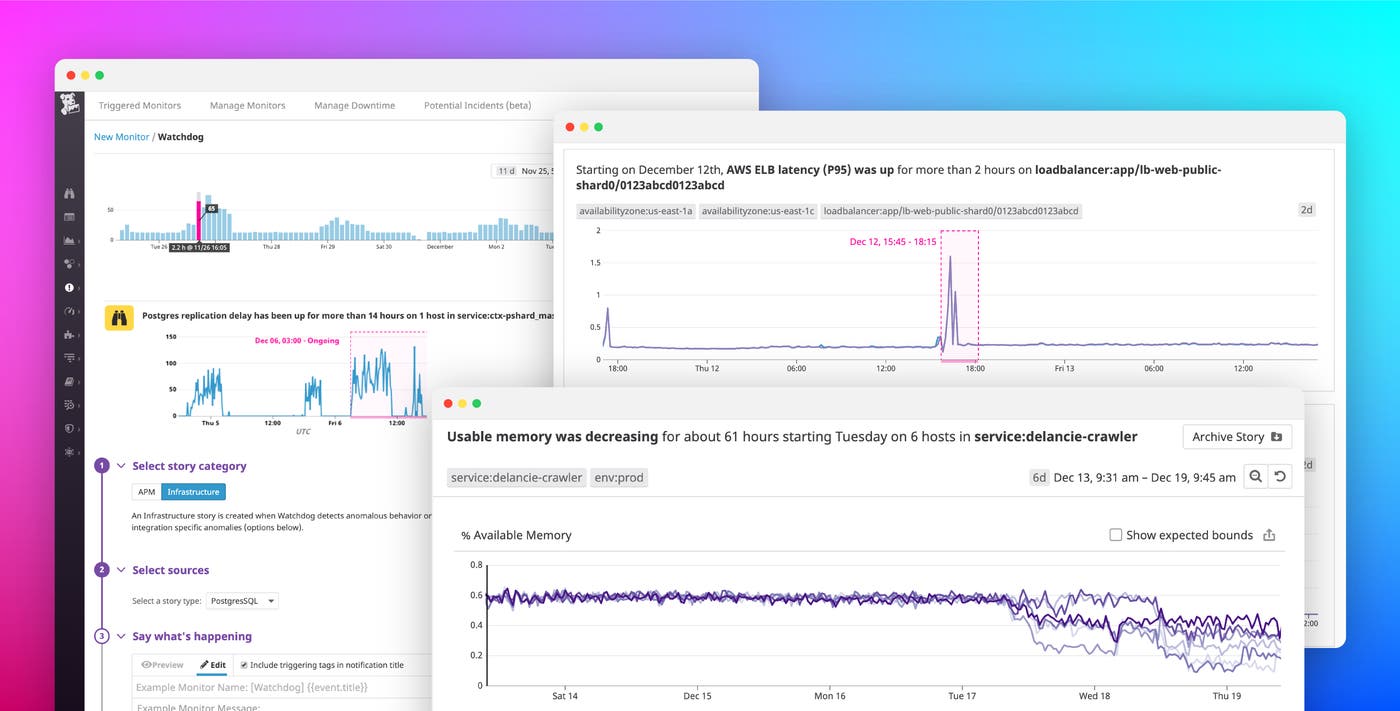
In the example below, the screenshot shows a Watchdog story that reports a sudden, sharp rise in latency on an AWS Elastic Load Balancer (ELB).

The graph in this story shows the latency values of the ELB in three different availability zones. Watchdog detected similar anomalies in this metric from a single load balancer enabled in three availability zones, and automatically grouped these findings together in a single story. After a period of consistently low latency, the metric in all three AZs rises sharply—in the highlighted area of the graph, which indicates the timeframe of the anomaly.
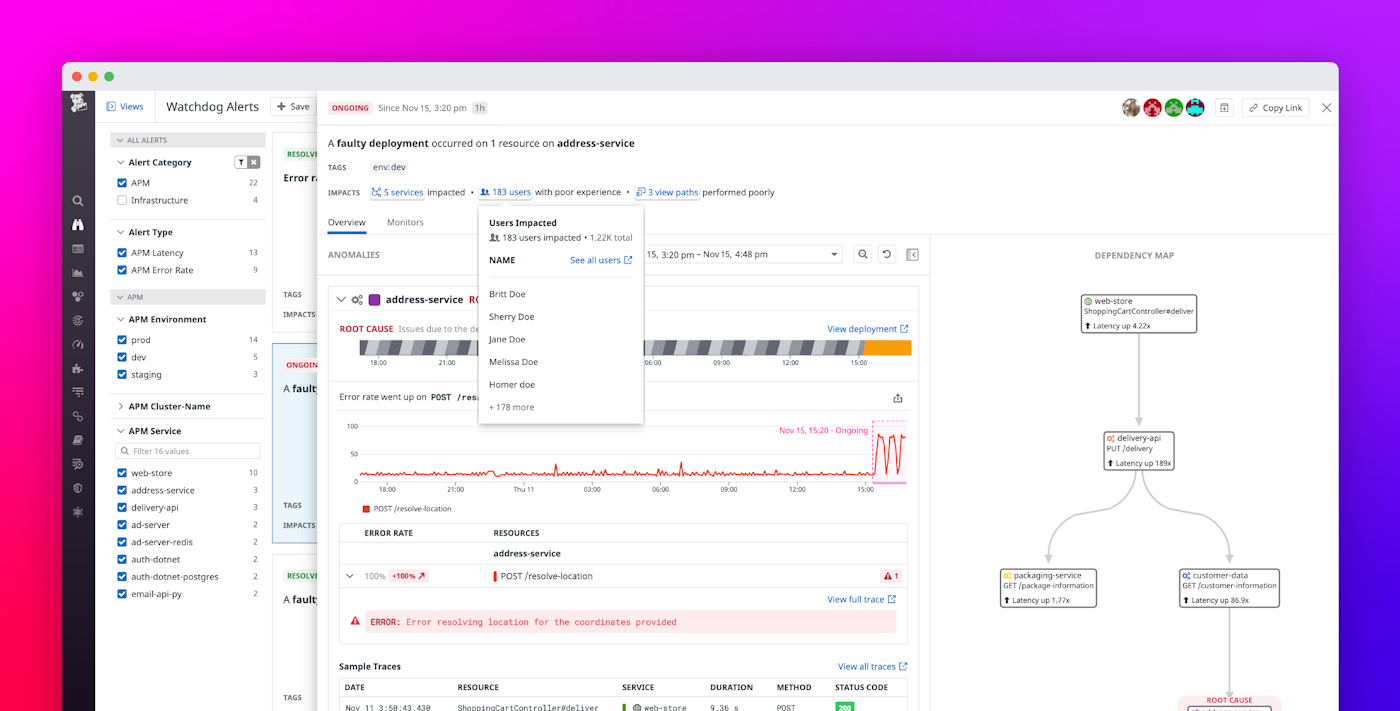
To quickly investigate an issue reported in a Watchdog for Infra story, you can click on the graph and pivot to Metric Correlations to pinpoint possible root causes. Metric Correlations searches across multiple data sources—your infrastructure, integrations, and distributed tracing and APM—for similar abnormalities that occurred at the time of the story.
Create monitors to notify you of detected issues
Watchdog monitors can automatically notify you and your team when performance anomalies are detected in your environment so you can take corrective action right away. To prevent alert fatigue, you can configure Watchdog monitors to trigger only on infrastructure issues that are most important to you.
When you're viewing a Watchdog story, you can create a monitor to notify your team about similar issues that arise in the future. Each Watchdog story will suggest one or more monitors, and you can click the Enable Monitor button to customize and activate the alert.

You can also create a new monitor directly from the Monitors page. Click the New Monitor button, select Watchdog, and click the Infrastructure tab. By default, your monitor will trigger when any Watchdog for Infra story is created. To focus your monitor on a specific technology, choose one from the menu in the Select sources section of the page, as shown in the screenshot below.

Start using Watchdog for Infra today
Watchdog for Infra is now generally available. It doesn't require any configuration, so you can start viewing stories and enabling alerts right away. To learn more, see the Watchdog for Infra documentation and our blog post detailing the latest Watchdog features. And to speed up your existing investigation workflows, you can use Watchdog Insights, which suggests possible issues in data such as traces and logs. If you're not already using Datadog, sign up today for a free 14-day trial.


