Stephen Pinkerton
Whether you are a site reliability engineer, DevOps engineer, or application developer, you need visibility into the health and performance of every service you run or support. But in complex, dynamic environments, it can be difficult to ensure that all services are accounted for. Universal Service Monitoring (USM) automatically detects all of your services—including ones you built, third-party services, and libraries—and monitors their golden signals so your organization’s engineers can track service health, performance, and dependencies without touching a single line of code.
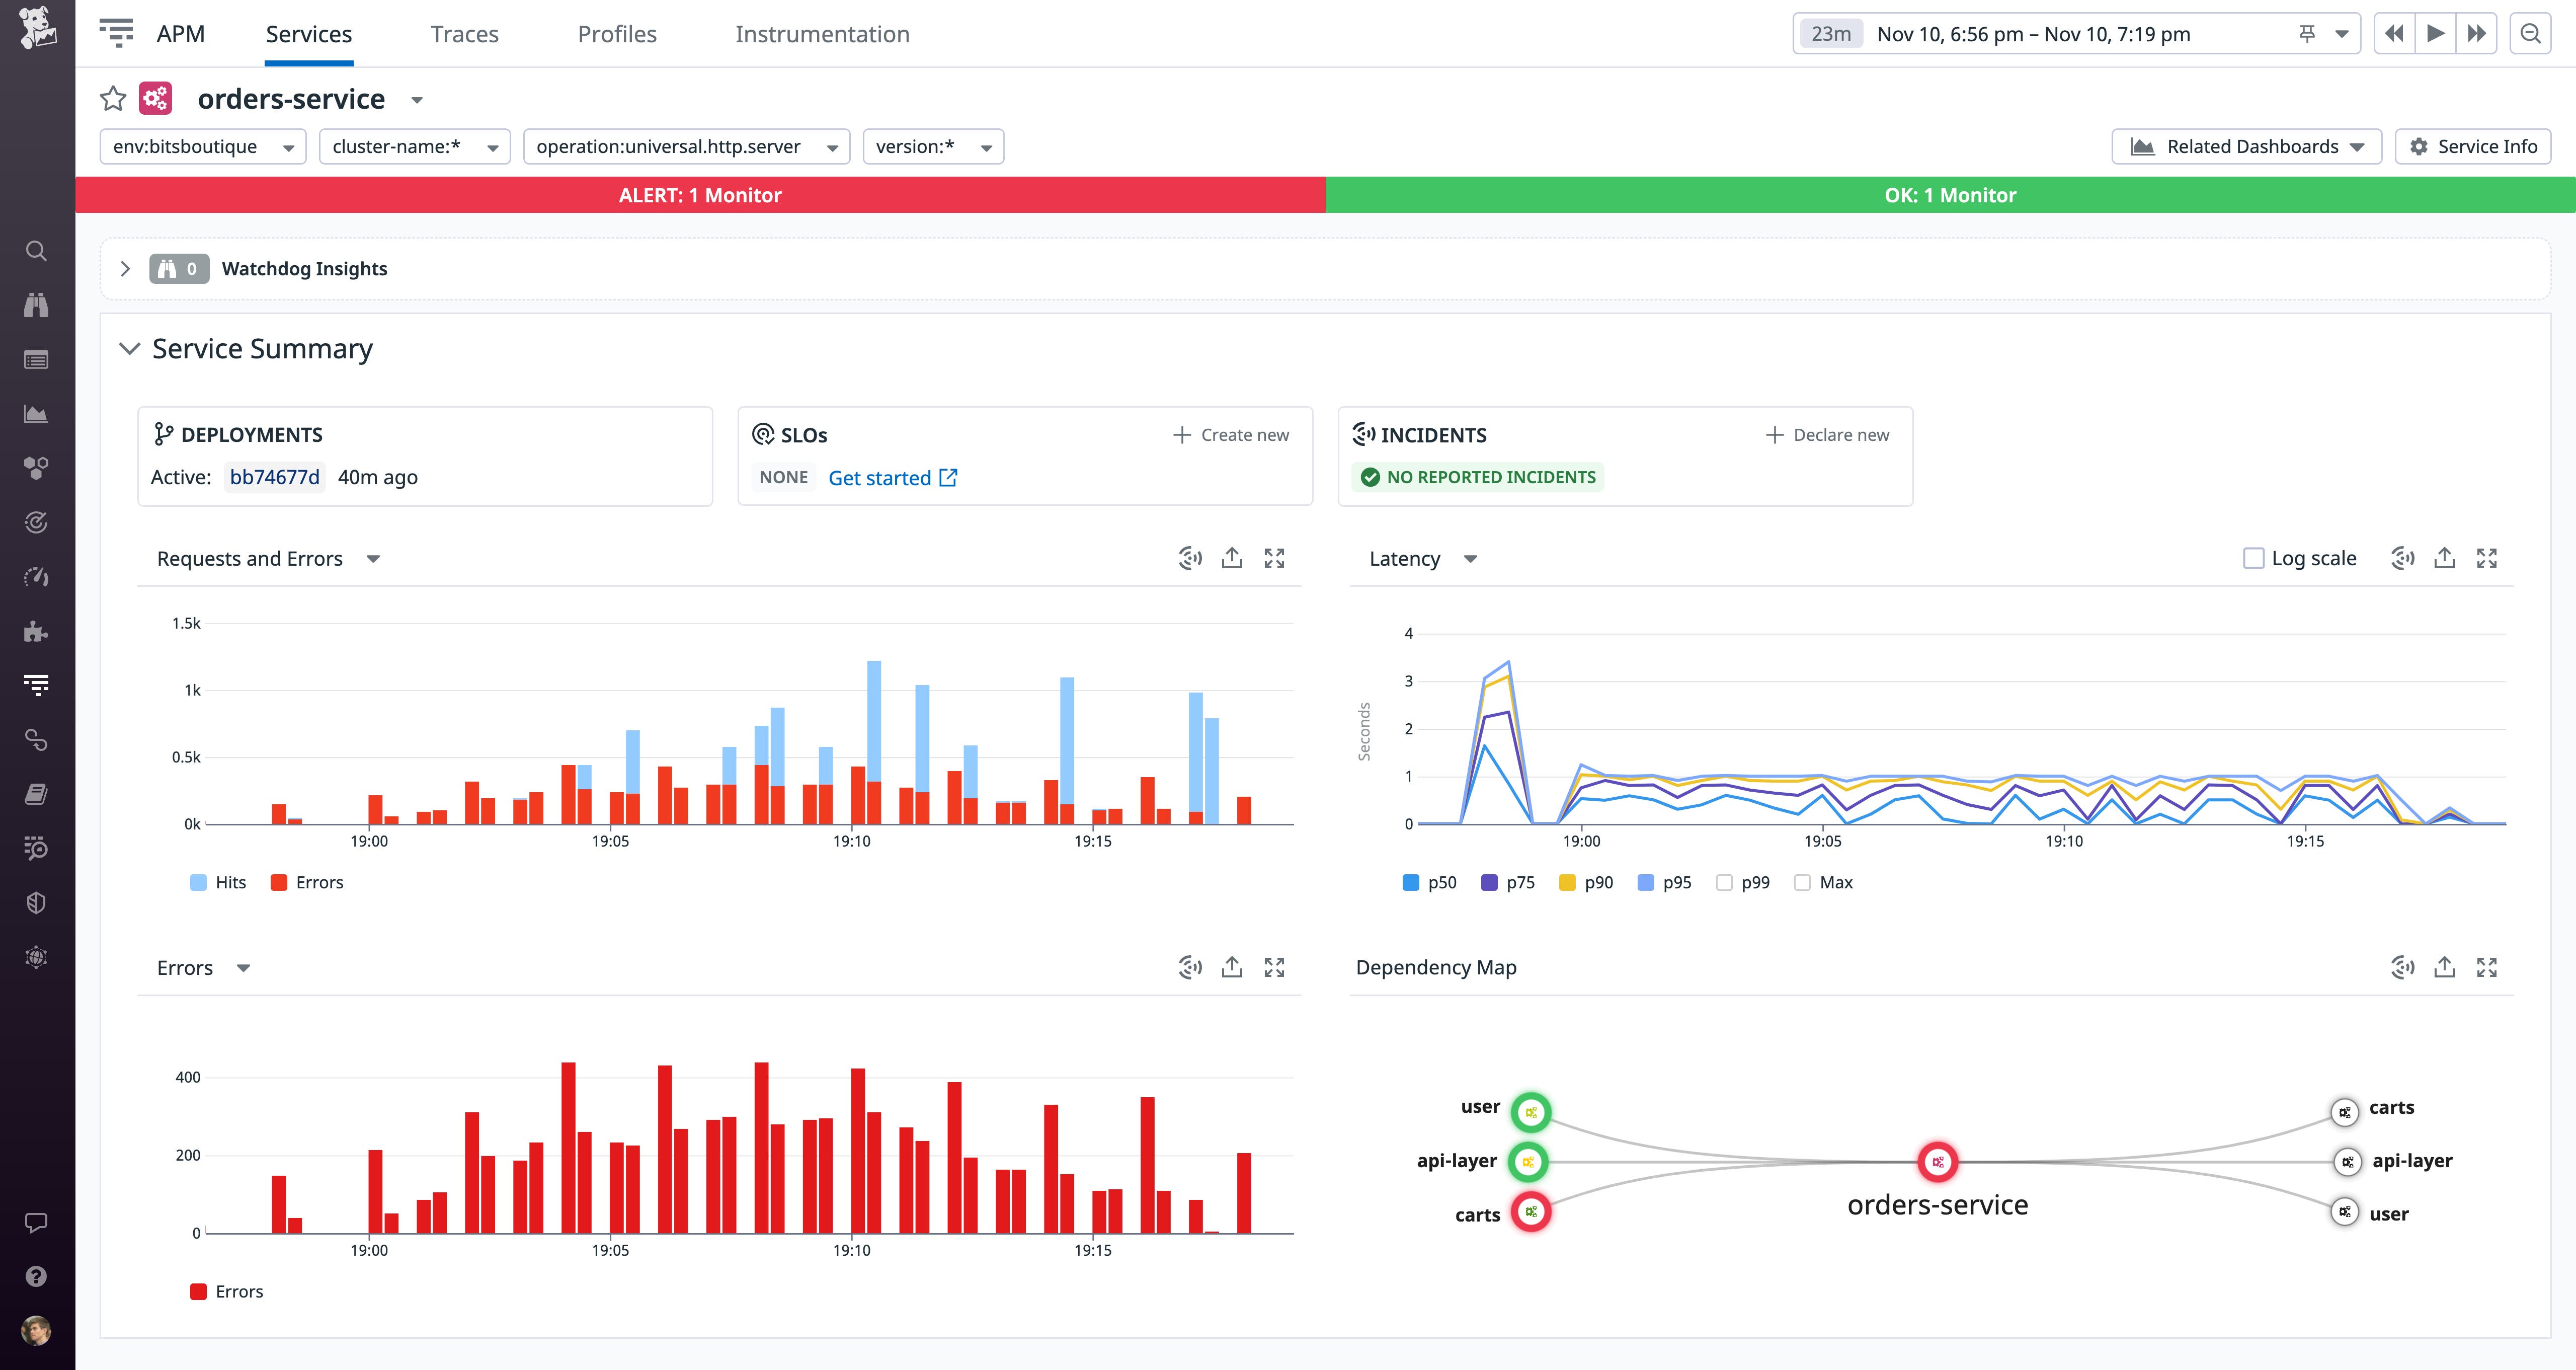
In this post, we’ll show you how USM gives you broad visibility into all services running on your infrastructure. We’ll cover how USM helps you:
- Leverage the Service Map to track dependencies
- Use the Service Catalog to centralize knowledge of your services
- Create alerts and SLOs—even for services that haven’t been instrumented—to reduce mean time to detection (MTTD)
- Use logs, APM, and Database Monitoring to troubleshoot issues and reduce mean time to resolution (MTTR)
When you enable USM, the Datadog Agent begins to automatically parse HTTP(S) traffic from the kernel network stack via eBPF. Within seconds, you’ll gain visibility into the RED metrics (request, error, and duration) from every service in your infrastructure, irrespective of the programming language they use. And as you deploy new services, USM will automatically detect them in real time and begin to monitor them. With the global visibility provided by USM, your SRE teams can quickly respond to issues before they affect your organization, even as your fleet of applications expands.
All your services on the Service Map
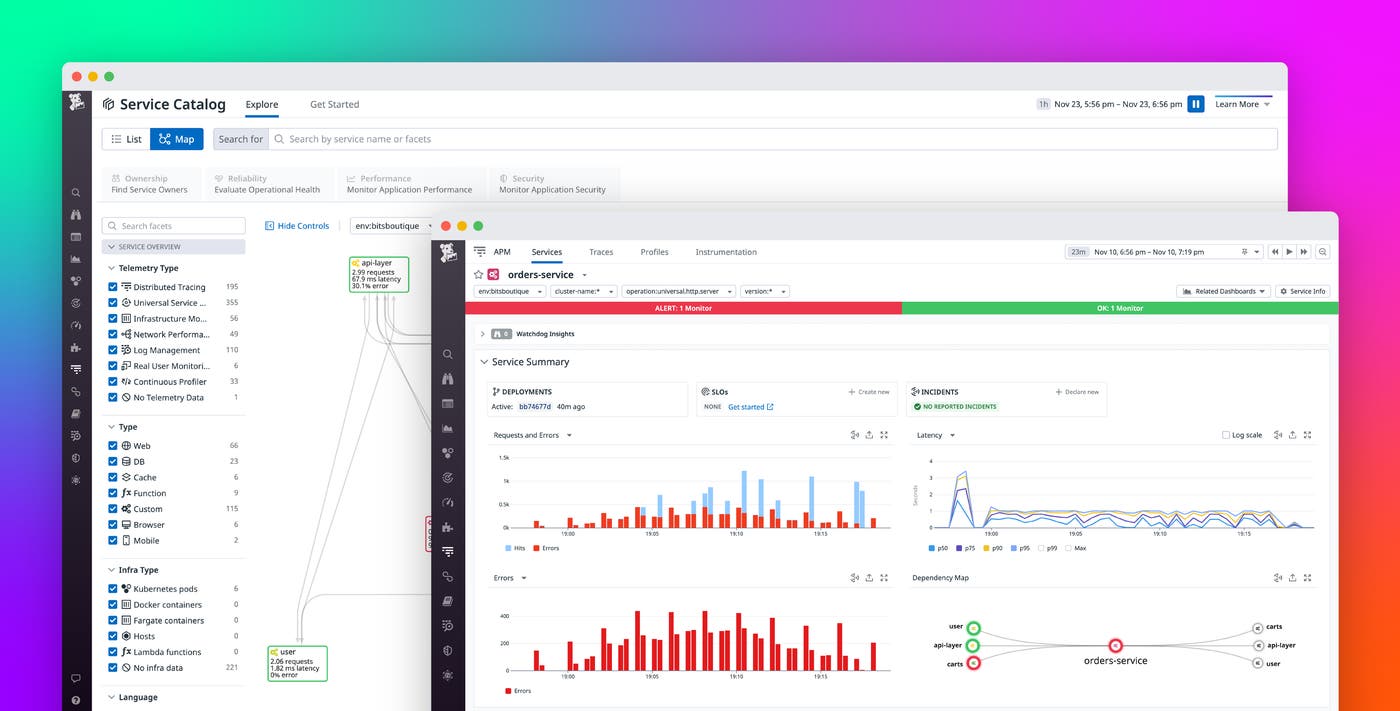
The Service Map is a powerful way to visualize the upstream and downstream dependencies between your services, which is often the key to understanding the cause of an incident. When you enable USM, it automatically detects all your services—regardless of the programming language they use—and adds them to the Service Map, so you can be confident that you have a complete view of your system architecture.
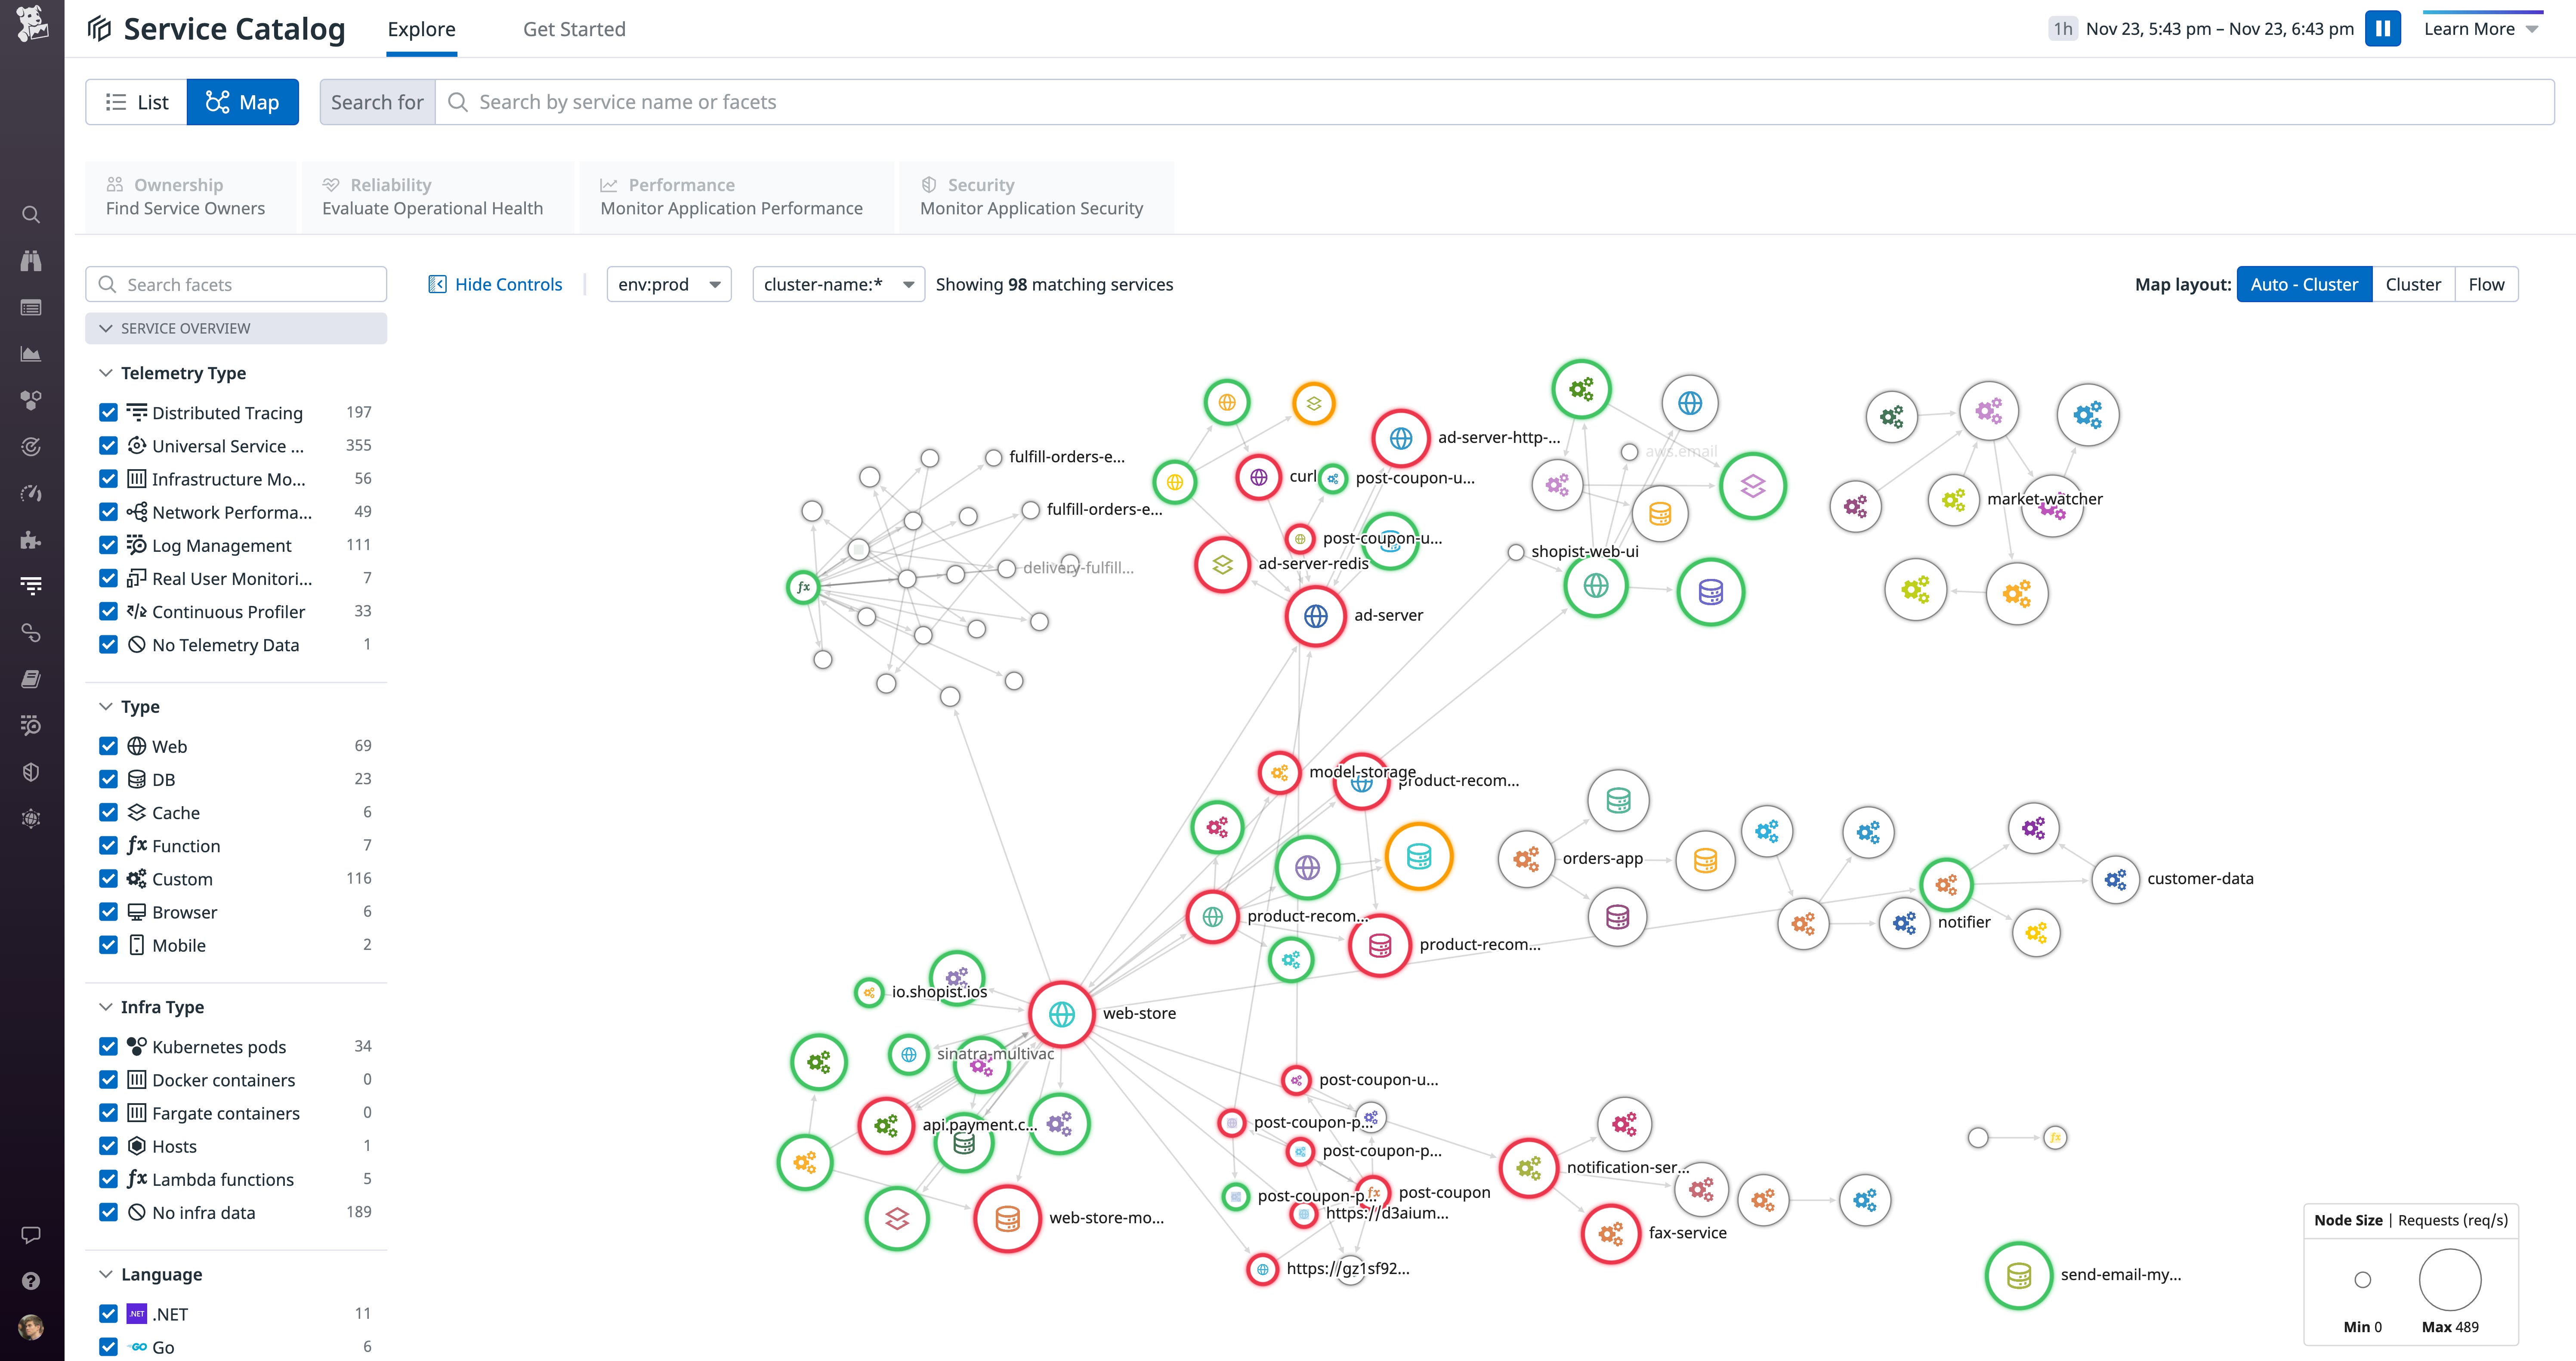
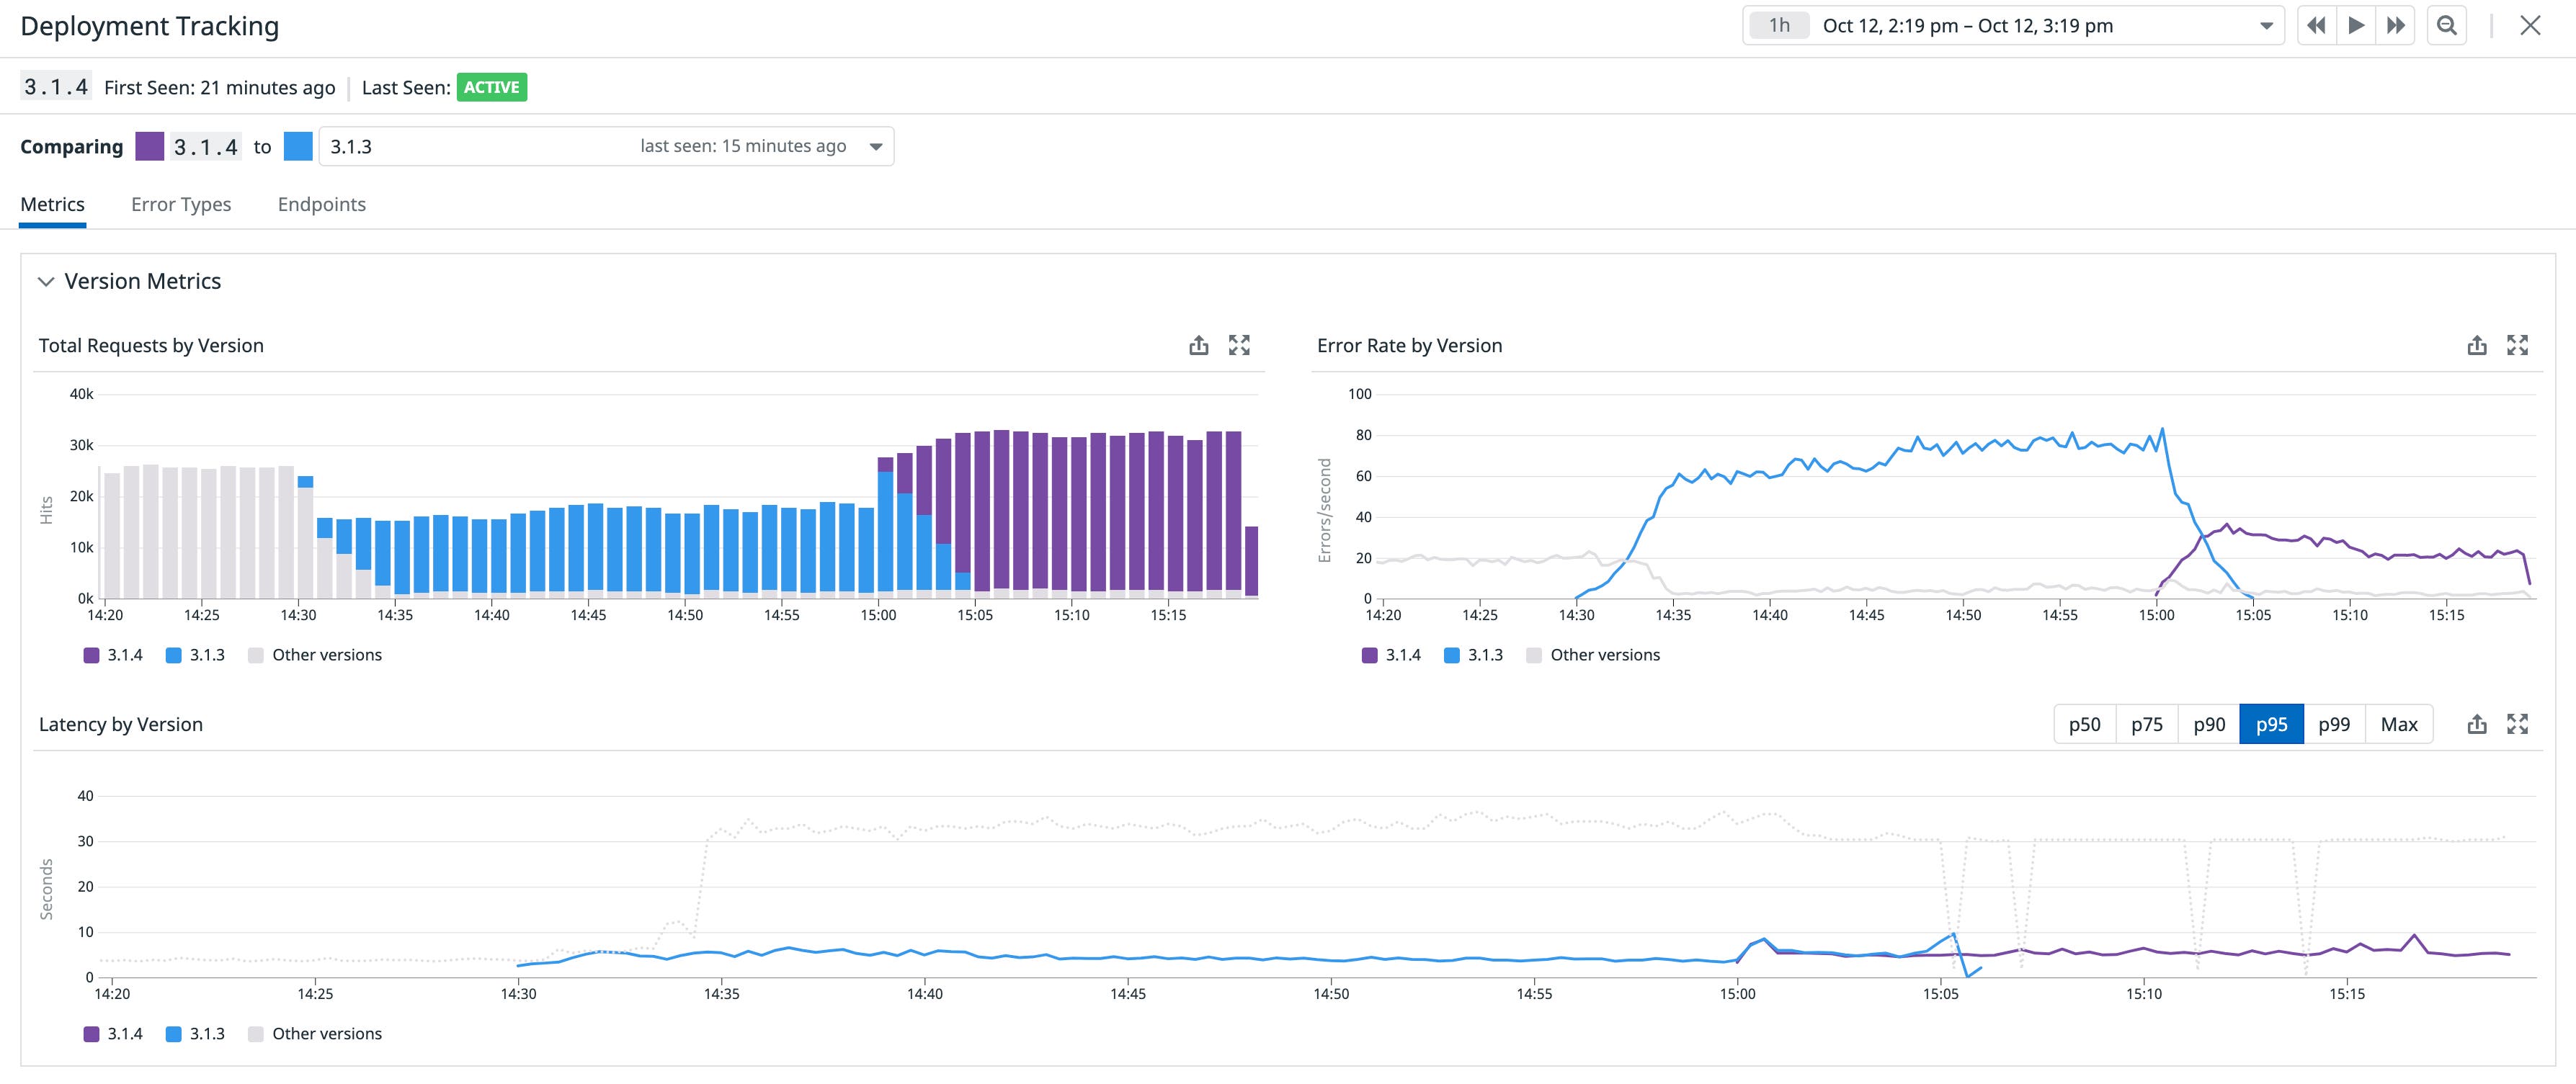
You can click any node on the Service Map to see detailed information about recent deployments and the health of specific endpoints. This can help you determine if you should scale up under-provisioned infrastructure, for example, or work with the team that owns the service to roll back a deployment. USM integrates automatically with Deployment Tracking using the version tag from your CI/CD pipelines, so you can quickly get more context around the performance of different application versions over time.
All your services cataloged automatically
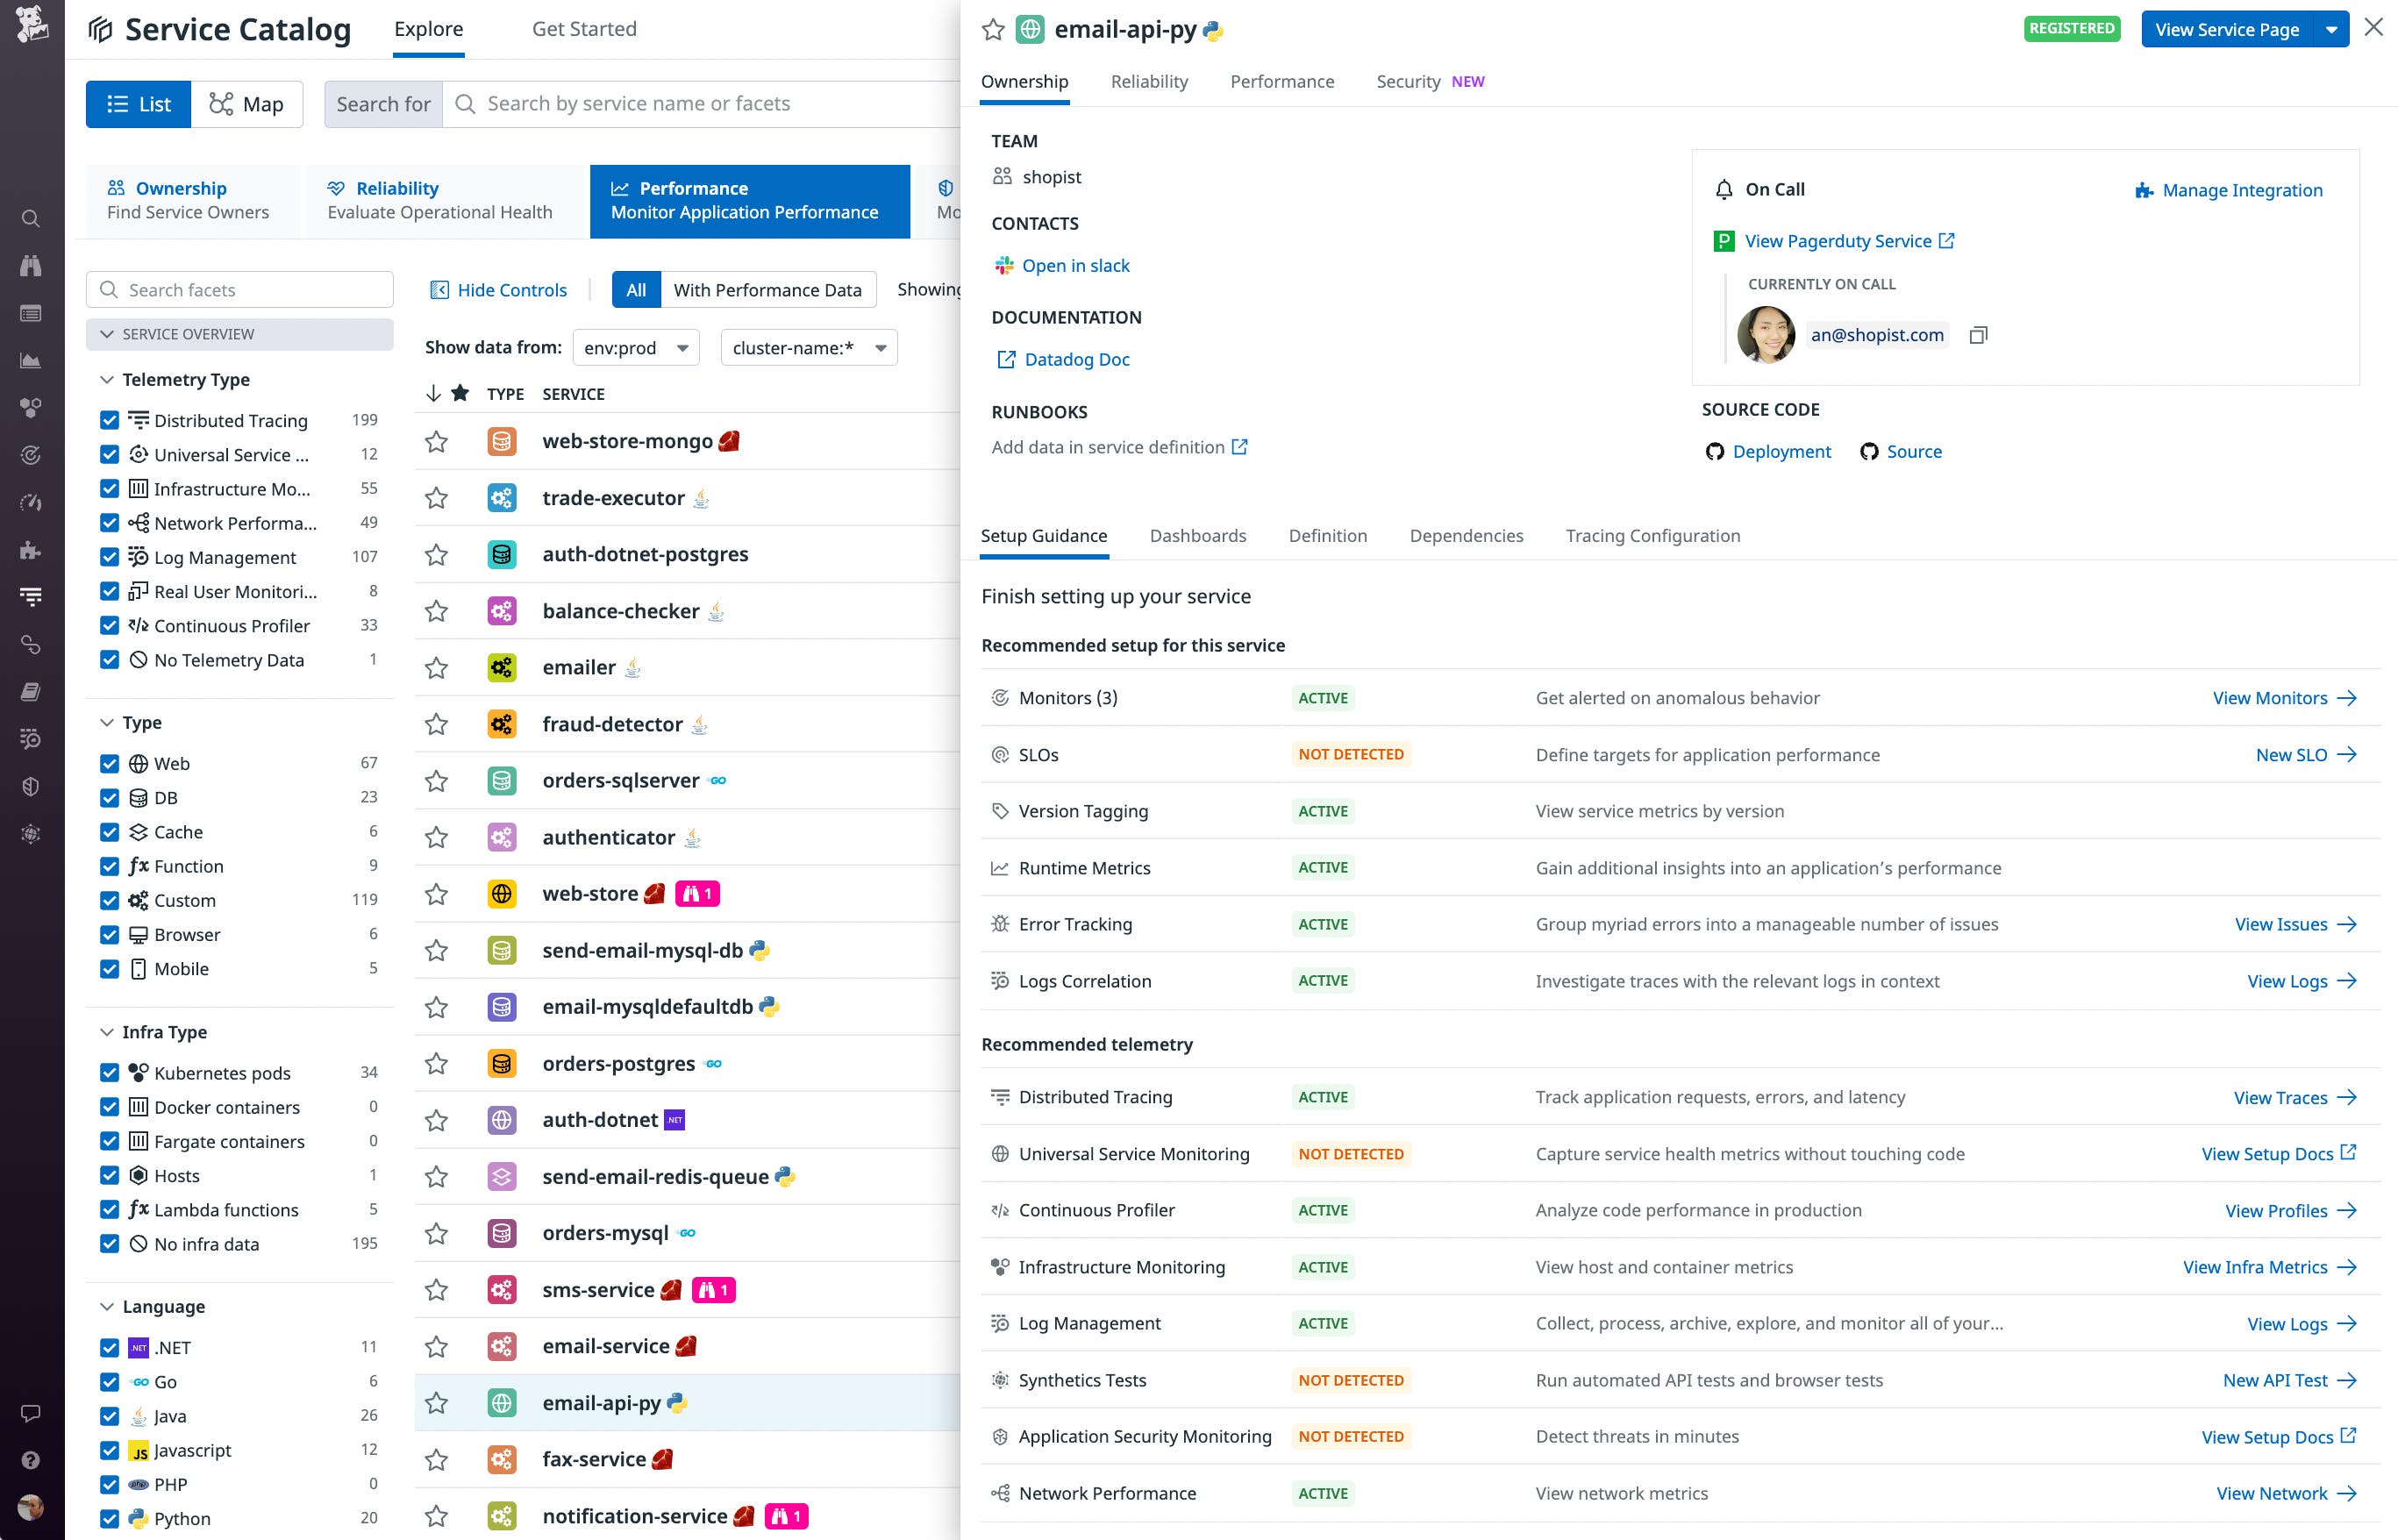
The Datadog Service Catalog allows you to centralize information about your services so you can build shared knowledge across teams and ensure appropriate observability and accountability for your services. USM automatically discovers all your containerized services and adds each one to the Service Catalog. Using an automatically generated service tag—or one you create manually using unified service tags—Datadog correlates each service’s metrics, logs, and traces, so you can quickly pivot from a service’s catalog entry to explore these other types of observability data.
By automatically cataloging new and existing services, USM helps you prevent observability gaps and makes service information available to stakeholders across your organization. You can also enrich each service’s catalog entry with ownership and on-call contact information, as well as links to resources such as documentation, runbooks, and code repositories.
Alerts and SLOs for every service
By providing RED metrics for all of your services, USM lets you create alerts that proactively monitor the health of every service and notify your teams automatically if a service’s performance degrades. For example, you can create a multi-alert using the universal.http.server metric to alert on the error rate across all of your services. The alert will trigger if any of your services exceeds the error rate threshold you specify.
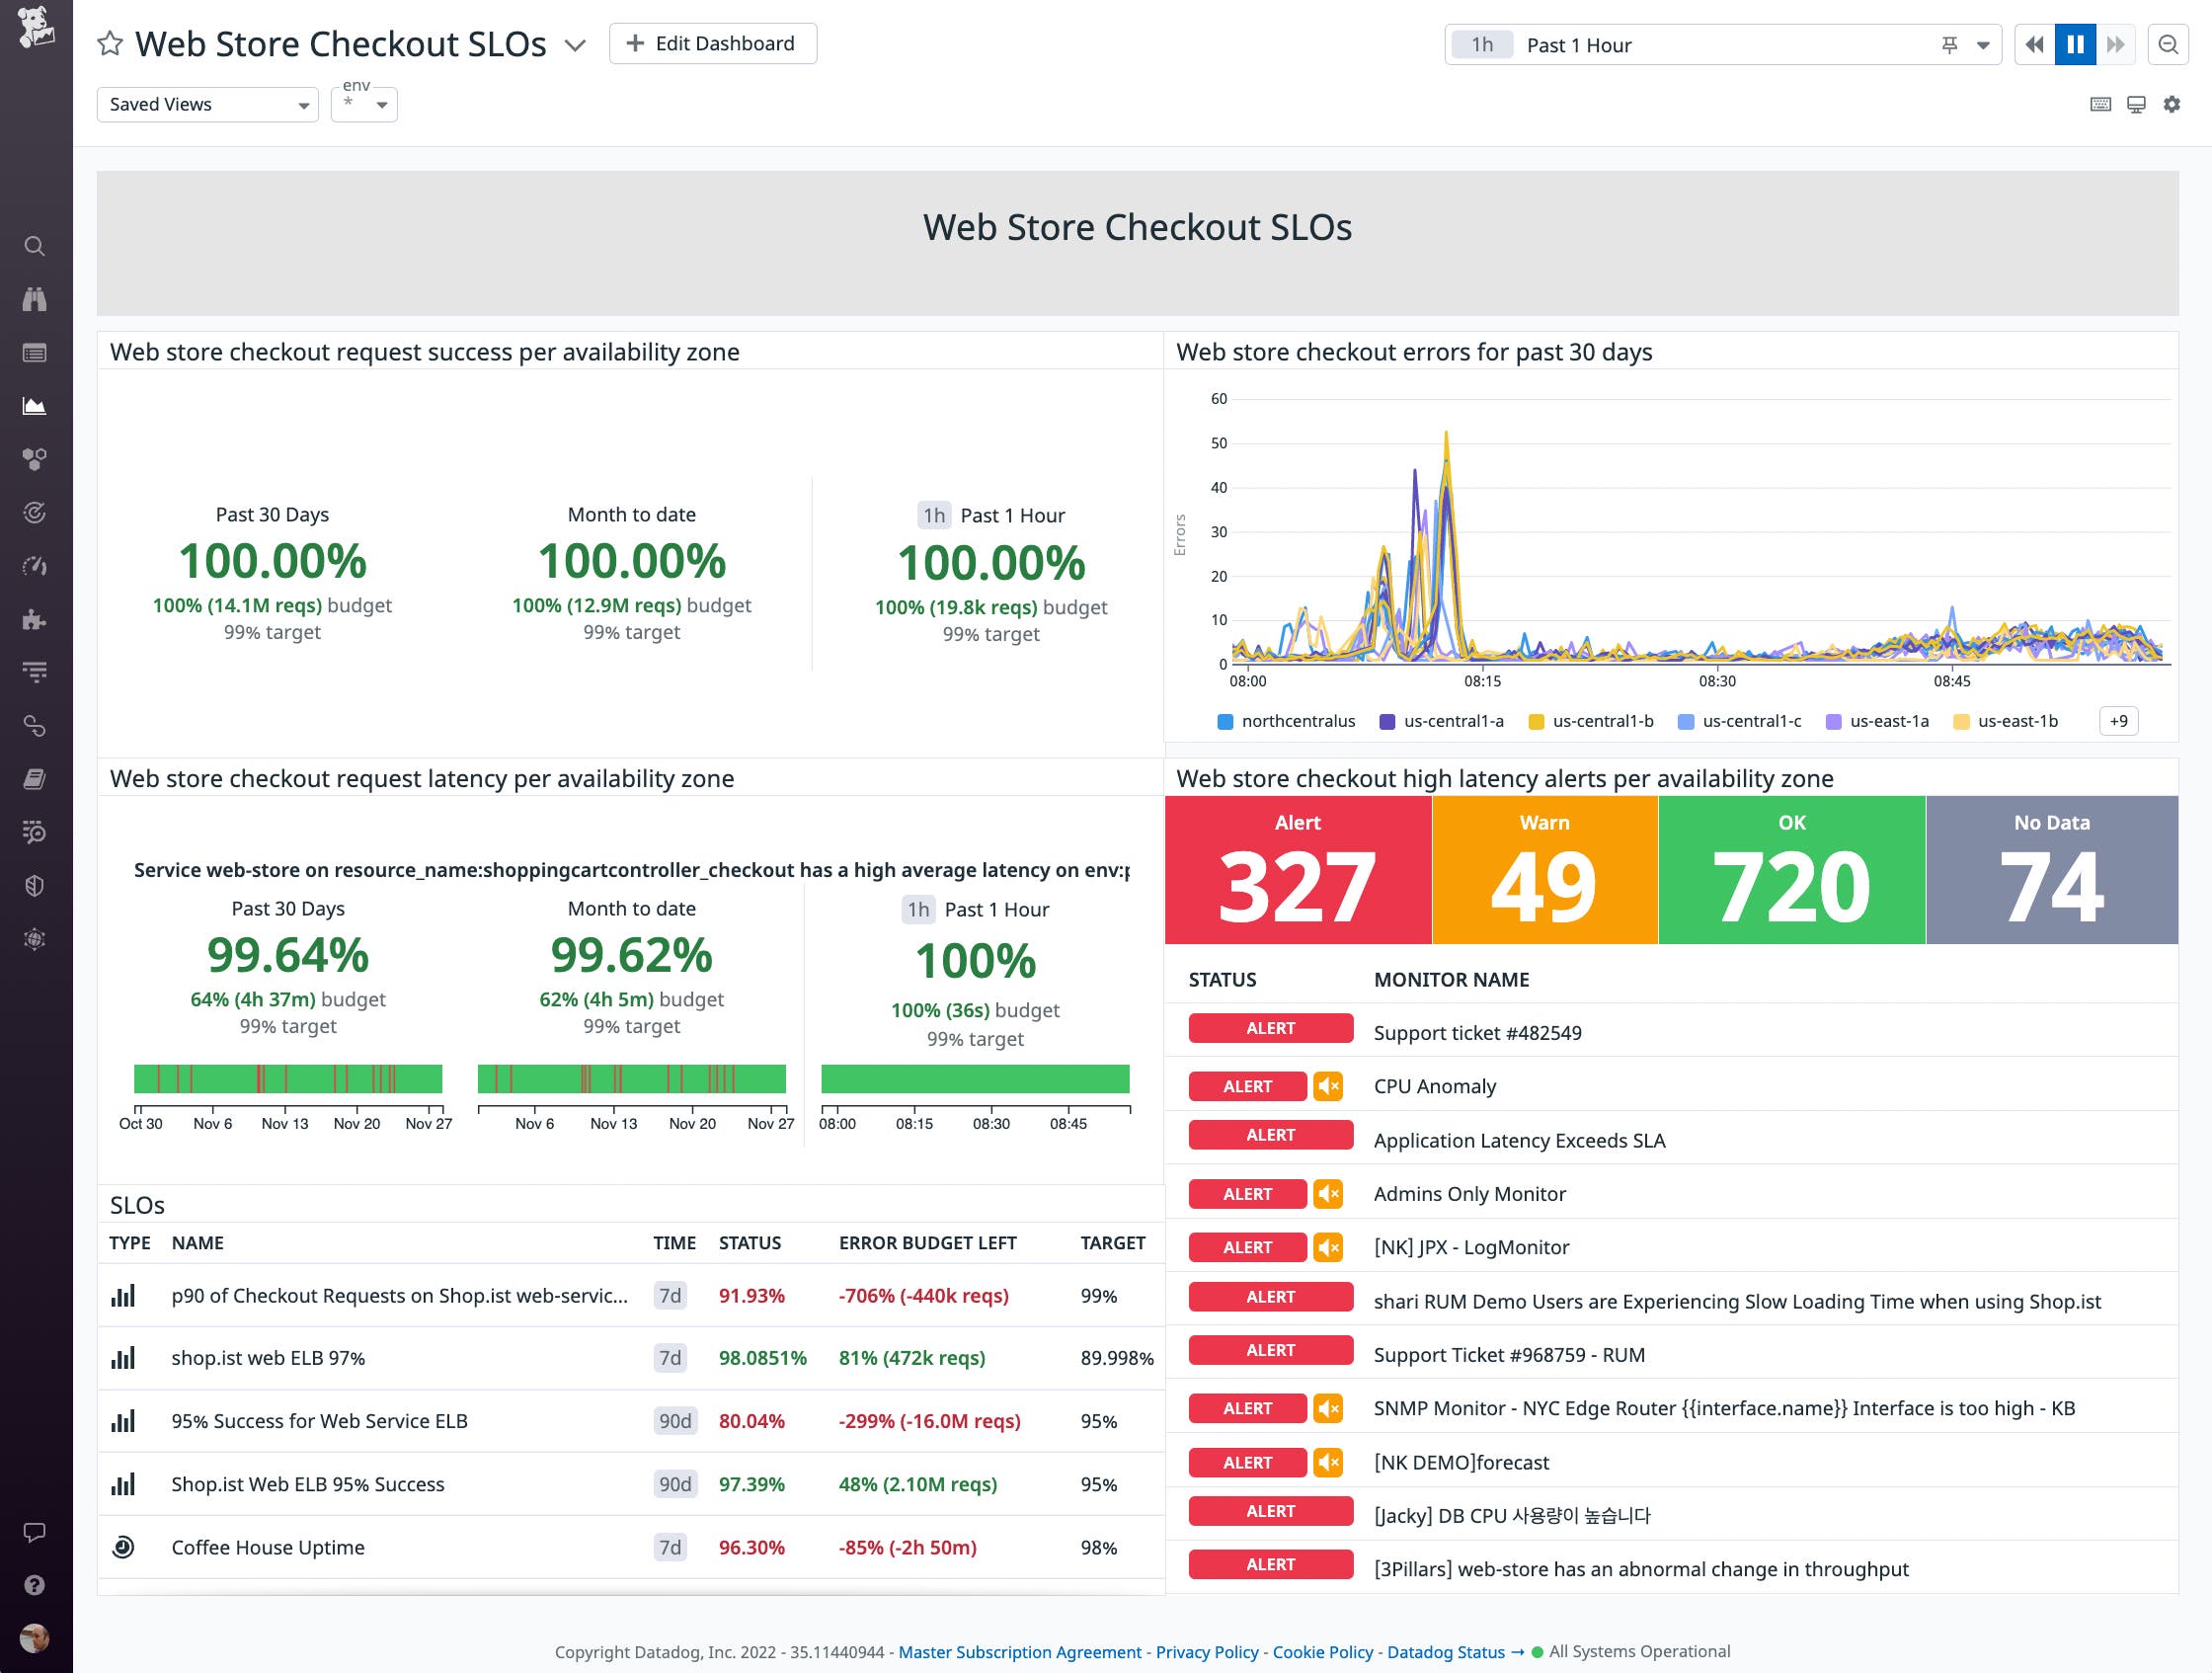
Service level objectives (SLOs) are another valuable tool for leveraging USM metrics to monitor service health. They help you track the reliability of your applications so you can define error budgets and set priorities for developing features and improving health and performance. USM’s request throughput, error, and latency metrics are particularly useful service level indicators (SLIs), since they reflect the way users experience your services. Once you create an SLO in Datadog using a USM metric (e.g., universal.http.server or universal.http.client) grouped by the version or service tag, any new service you deploy will automatically include the new SLO. This means you can easily roll out standardized SLOs across your entire organization, and individual teams can then customize these SLOs for their specific services as needed.
Faster troubleshooting with a unified platform
To investigate application health and performance issues, you often need to get context from logs, infrastructure metrics, and APM data. In addition to your service tag, USM automatically applies any environment and version tags you’ve added to your deployments and CI/CD pipelines. This allows you to quickly gain a meaningful idea of what is happening—for instance, by correlating a service’s degraded performance with a single deployment—then declare an incident and give responders a head start in remediating the issue.
For example, version 3.1.4 of the web-store service has experienced an uptick in HTTP(S) request errors, as detected by USM. You can get more context around these errors by viewing patterns in the deployment’s correlated error logs, as shown below. The error logs indicate that Redis connection issues are driving most of the service’s HTTP(S) request errors.
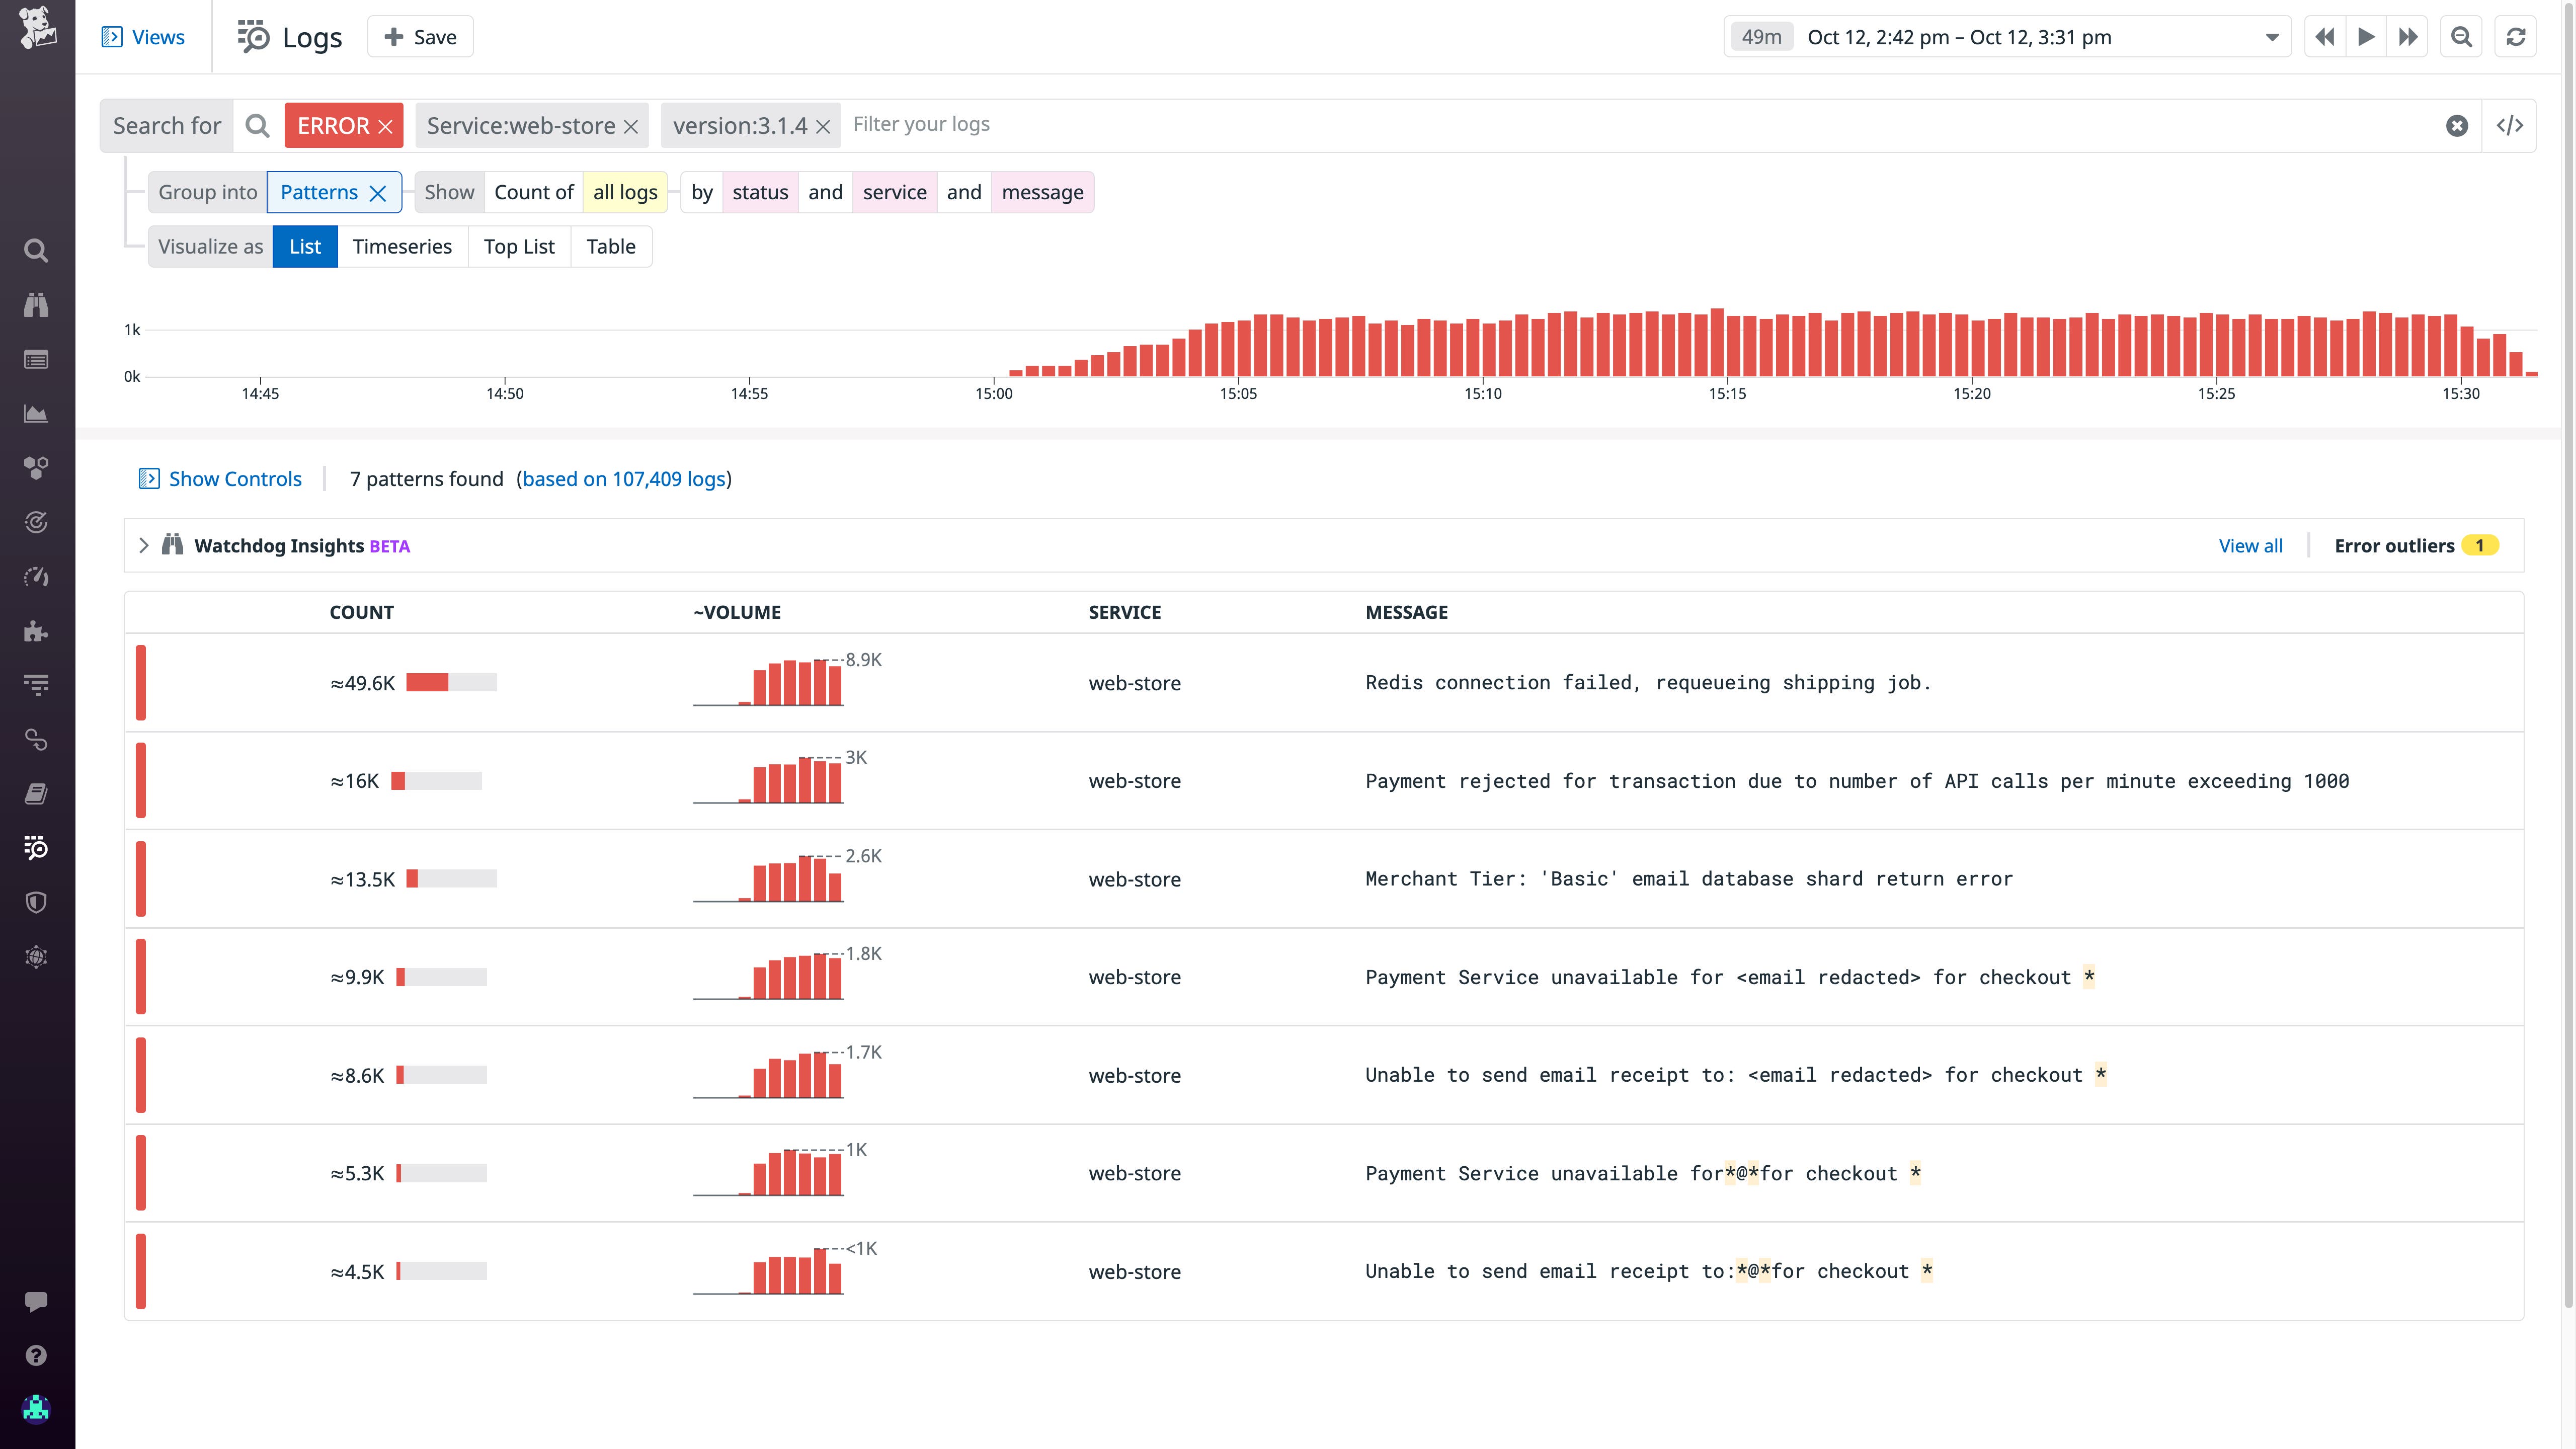
In the example above, USM helped detect the issue, and log patterns helped us find relevant logs to shed light on the cause. This may be enough information to call an incident, but to troubleshoot in depth—and minimize your MTTR—you can rely on Datadog APM, which gives you detailed visibility into individual requests processed by your application. You can instrument your services for distributed tracing and see flame graphs that illustrate the interaction of dependent services and reveal the sources of errors and latency. And you can use Trace Search and Analytics to reveal trends in your applications’ aggregate traffic.
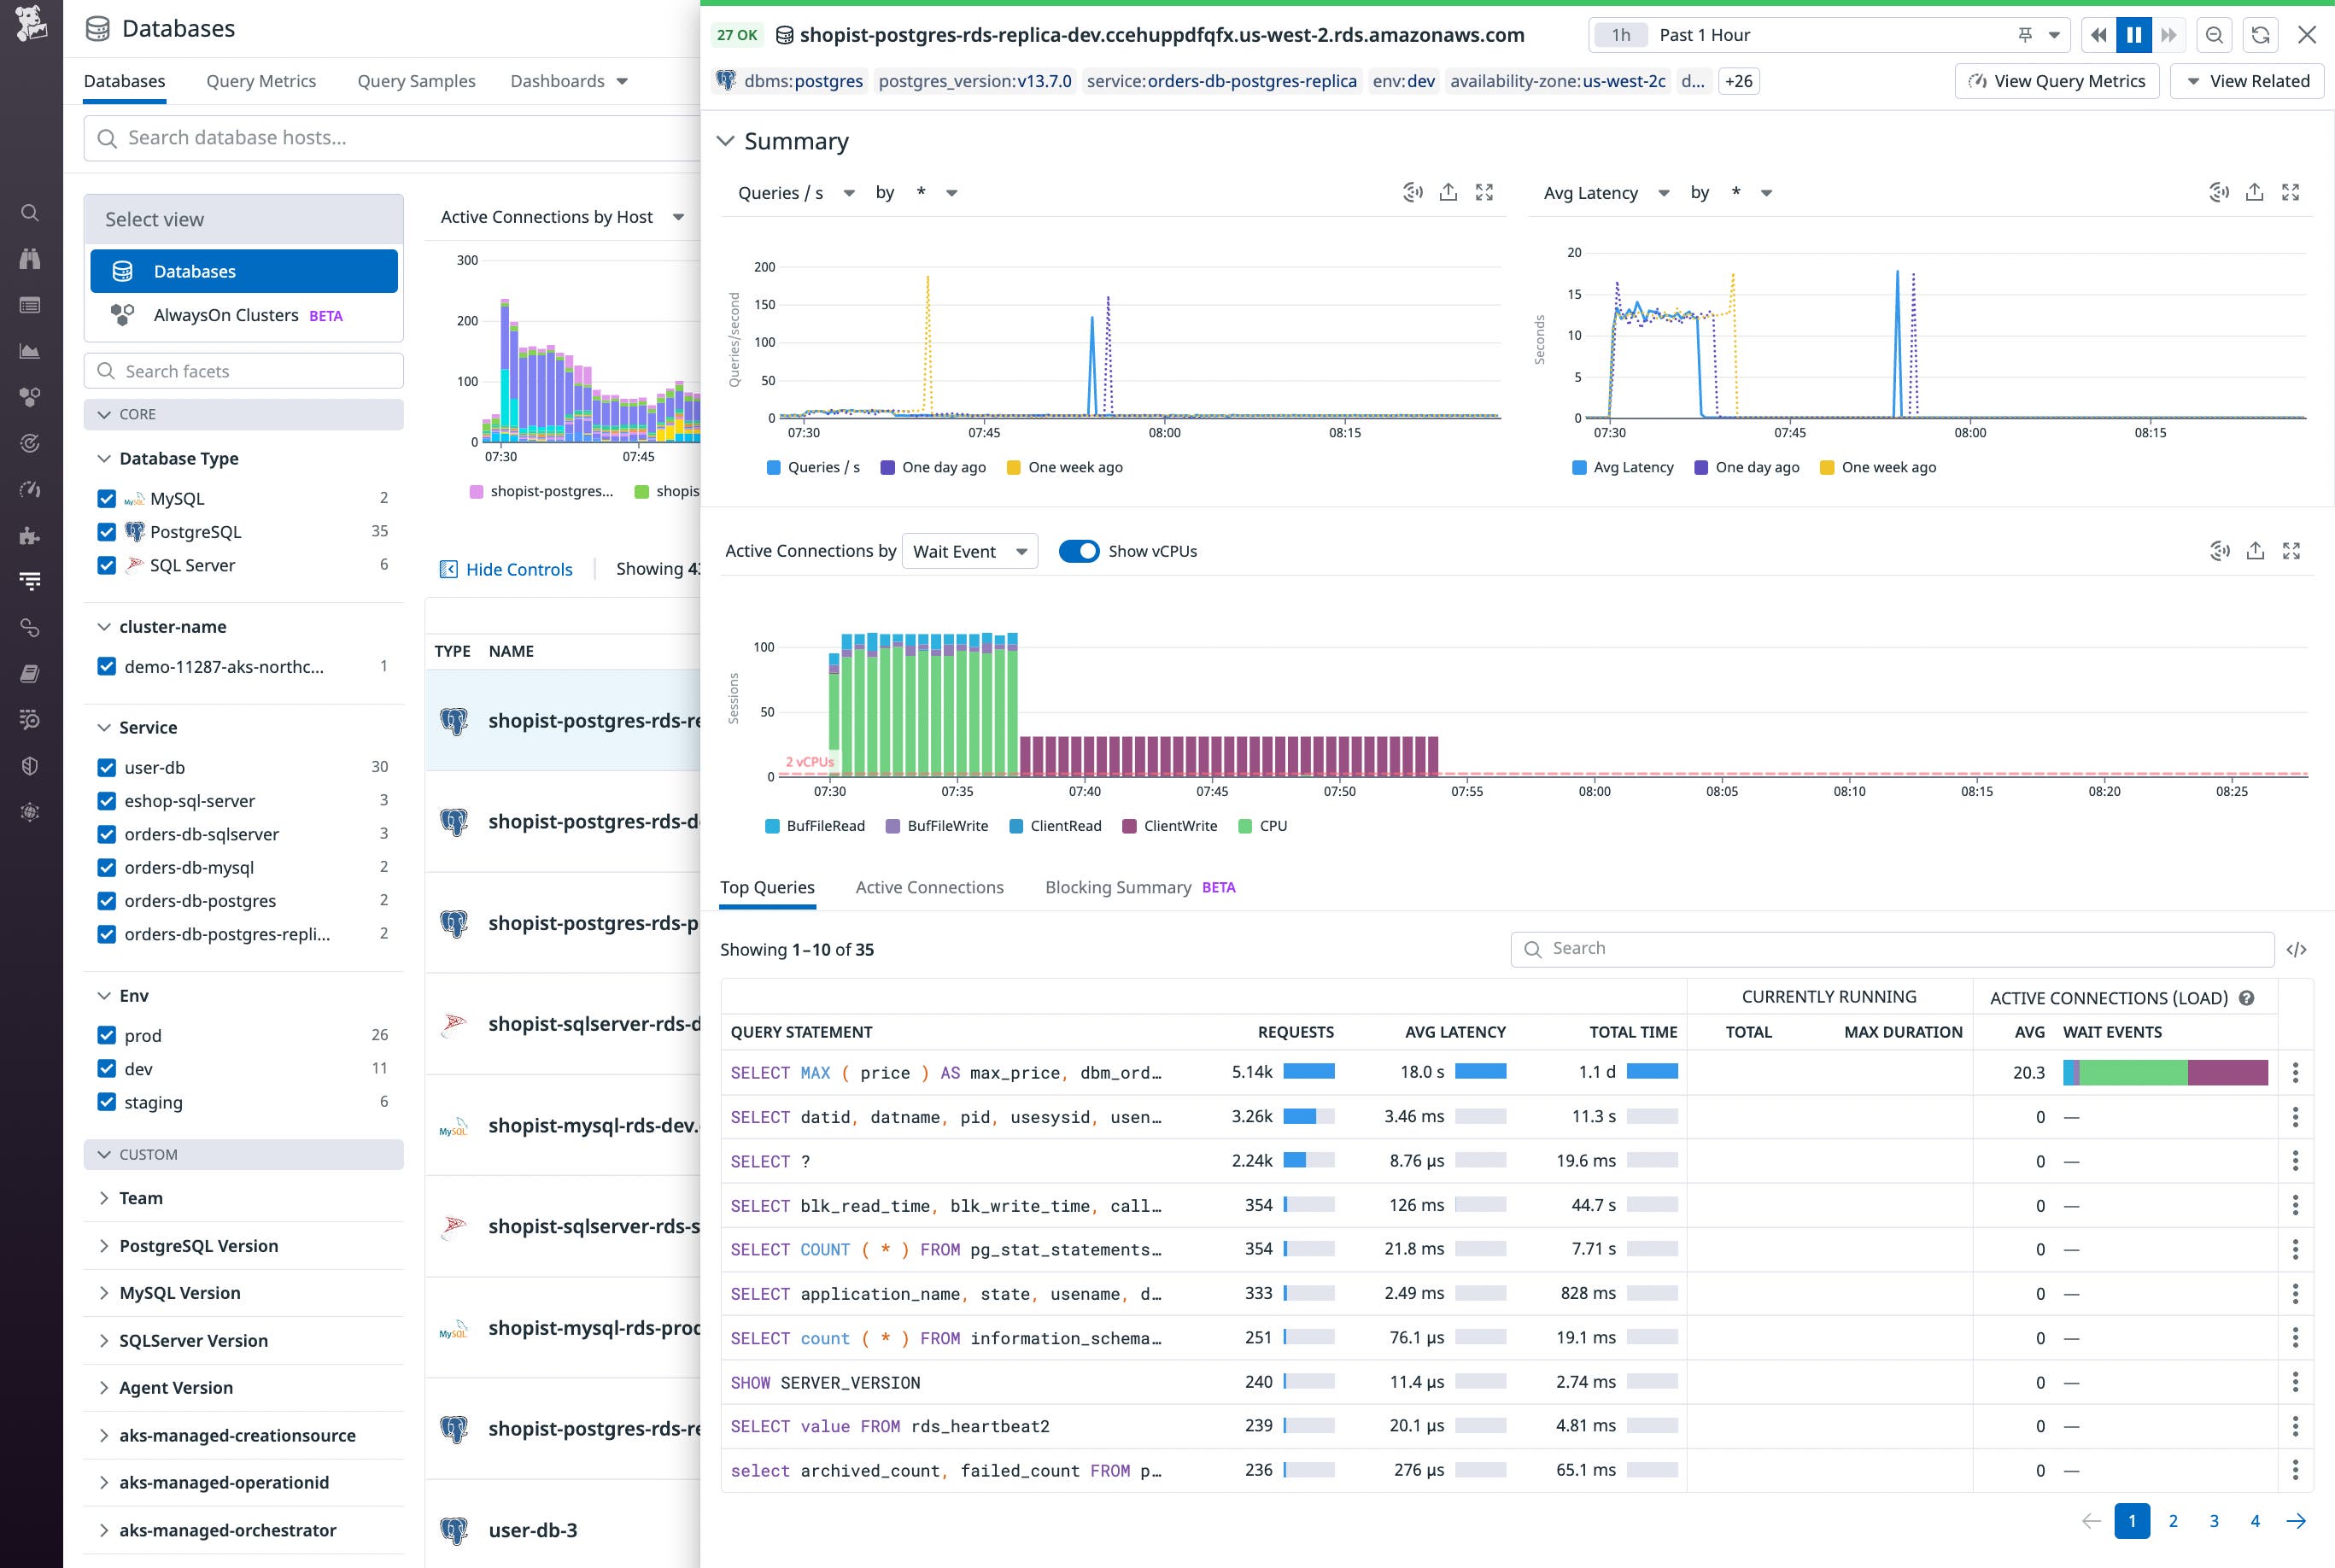
APM also provides powerful tools to help teams isolate the root causes of an incident by identifying a single line of code or database query that’s causing a critical failure. Continuous Profiler gives you method-level visibility into your application’s resource utilization, even in production. And Database Monitoring—shown in the screenshot below—allows you to analyze query performance and resource utilization.
Instantly discover, map, and monitor every service–without changing code
With USM, you can get comprehensive visibility into the health, performance, and dependencies of all services running on your infrastructure, regardless of whether they are instrumented for distributed tracing. USM is now generally available and can be enabled everywhere in seconds, simply by updating the Agent configuration file. USM monitors containerized environments running on recent versions of Linux and includes a beta integration for monitoring IIS.
See our guide to learn more about how Datadog uses eBPF to help you monitor your traffic in production. If you are not yet a Datadog customer, you can sign up for a free trial.
