

Lukas Goetz-Weiss

Eddie Cai
Technical Content Writer
Mature experimentation programs eventually have to report the cumulative impact of their shipped changes. The request might come as an ROI story for leadership, a revenue update for finance, or a gut check on the quarter’s progress.
The tempting shortcut is to sum the observed lift from each winning experiment and report the total. That naive sum almost always overstates the truth because of a statistical artifact called the winner’s curse.
Two established methods provide better estimates of cumulative impact. The first is a holdout, which combines many shipped treatments into one randomized experiment and estimates their cumulative effect directly. The second corrects the estimates you already have for the winner’s curse and aggregates them. The correction is grounded in well-established statistics. Datadog’s Cumulative Impact feature runs it for you, fitting the model and producing the aggregate impact estimate without a holdout. You can estimate cumulative impact from experiments you have already run, without setting aside traffic for a quarter-long holdout. The analysis can cover an entire experimentation program or focus on one team’s experiments by filtering on tags.
In this post, we’ll explain why naive summation overstates impact and how a holdout measures cumulative impact directly. Then we’ll cover what a holdout costs and how Cumulative Impact estimates the same number without one.
Why naive summation overstates cumulative impact
Teams need to measure the cumulative impact of their winning experiments, but adding up the observed lifts gives a biased estimate. The sum is biased upwards because of the winner’s curse, the tendency of statistically significant results to overstate their combined effect.
The bias comes from two properties of A/B test estimates.
Estimates are noisy. The lift your test measures is not the true effect. It is the true effect plus sampling variation.
Significance testing is a filter. The filter acts on the estimate, not the true effect, so it can miss a real effect whose estimate did not clear the bar.
The filter lets an experiment through when noise pushes its estimate above the significance bar, and it excludes an experiment when noise pulls its estimate down. The surviving winners are not a random sample. They are the subset where noise inflated the estimate enough to pass, so any total you sum from that subset inherits the same inflation.
See the overstatement in an example
A short example shows where the extra impact comes from. Let’s say the true effect of an experiment is 5%. In practice, you don’t see the true effects, only noisy estimates. In this example, the experiment must show at least 6% lift to be statistically significant and ship.
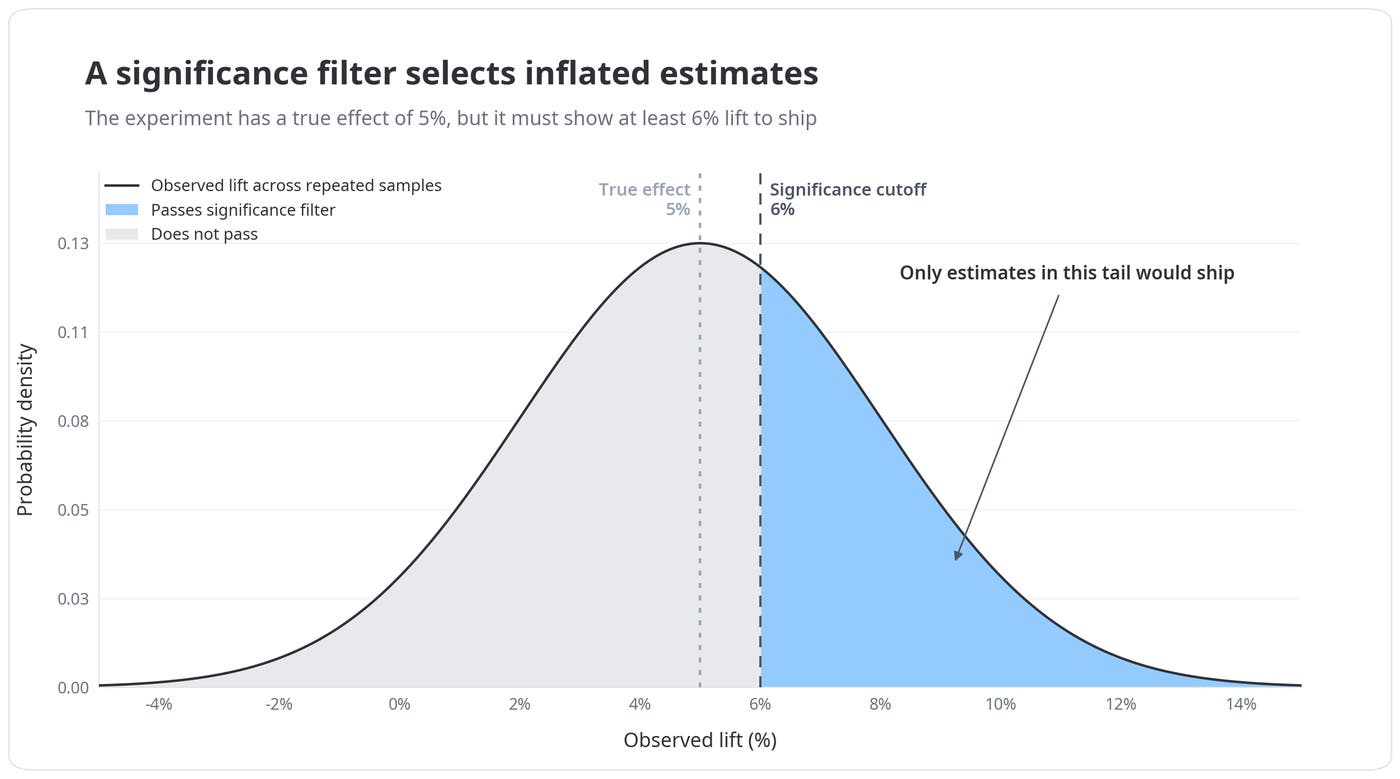
The filter keeps only estimates in the right tail of the distribution. Since the true effect is 5%, any estimate above the 6% cutoff includes positive sampling noise. The estimates that pass therefore overstate the true effect on average. This bias appears before you sum anything. When you add the observed lifts from many statistically significant winners, the total inherits the same inflation. That is the winner’s curse.
Measure cumulative impact directly with a holdout
Effect estimates from statistically significant winners are already biased upward on average. Adding them carries that bias into the total. A holdout measures every shipped treatment together, so you estimate their cumulative effect directly rather than correcting many estimates after the fact.
A holdout avoids the winner’s curse because its estimate is not selected for statistical significance. You estimate one thing, the combined effect of all the winning variants, not aggregating many statistically significant estimates.
How holdout groups are structured
A holdout randomizes users into three groups.
Holdout: sees the product as it looked when the holdout period began. This group is the control and is not included in on A/B tests during the holdout. Typical size is 1–5% of traffic.
Winners only: this traffic is also not included in A/B tests and receives winning variants once experiment decisions are made. Typical size is 1–5% of traffic.
Remainder: the population your A/B tests actually run on. It is usually the largest group (90-98% of traffic), since it has to power the tests that surface the winners rolled out to the winners only group.
Comparing the holdout and winners only groups gives you the cumulative effect of every winning variant.
What a holdout gives you and what it costs
A holdout is the cleanest way to measure the cumulative effect of everything you have shipped. It can also estimate long-term effects. Because the comparison can continue after the winning variants roll out, a holdout can also measure how their cumulative effect changes over time.
A holdout also requires advance planning. You need to configure it before the experiments it will capture begin, so it usually cannot measure the cumulative impact of historical experiments that ran without one.
That rigor comes at a cost in time and traffic. A holdout runs for an extended period, often a quarter or more, so you keep feature flags from completed experiments alive until it ends. Group sizing also forces a tradeoff between statistical power and testing capacity. Larger holdout and winners only groups raise the power of the final analysis but leave a smaller remainder to power your A/B tests. Smaller groups do the reverse and weaken the holdout analysis itself.
Estimate cumulative impact without a holdout using Cumulative Impact
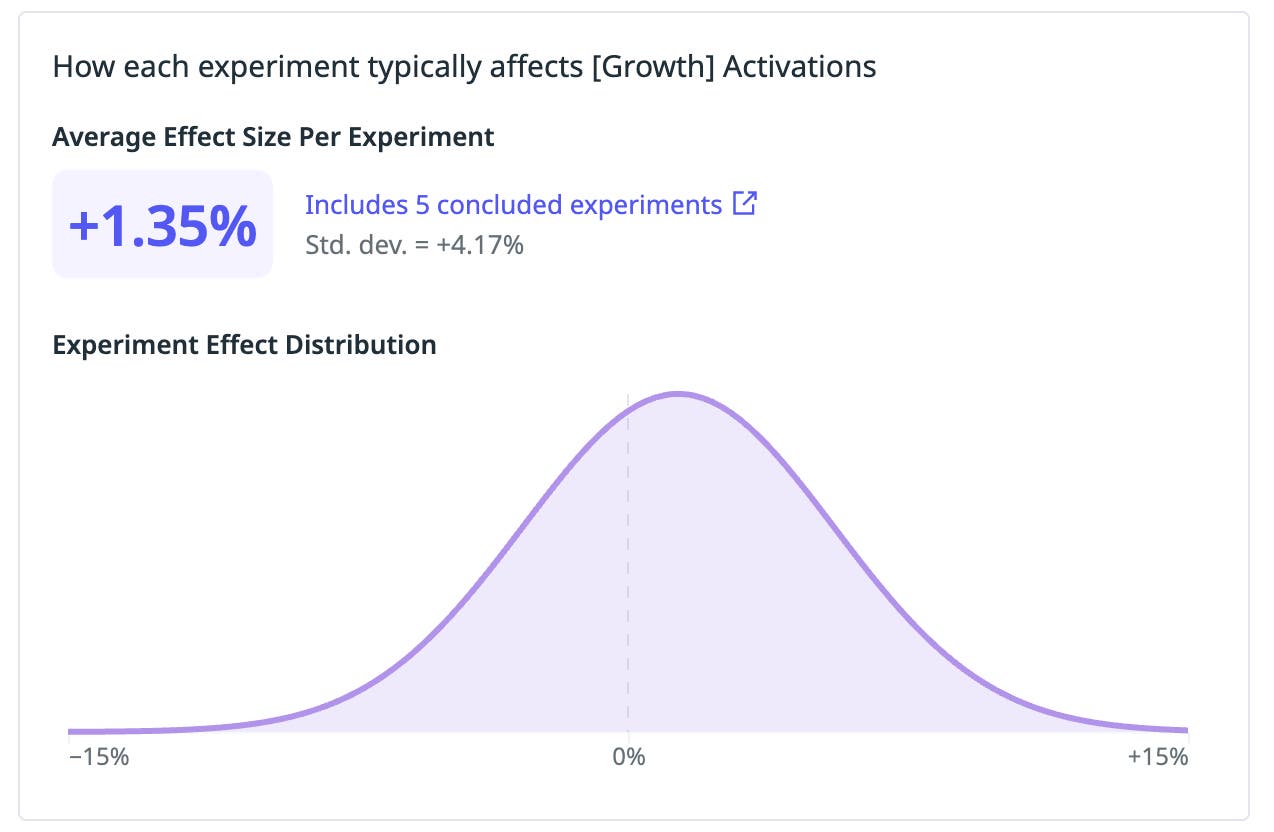
Cumulative Impact takes a list of candidate experiments and fits a statistical model that estimates an effect distribution across them. The model gives each experiment a corrected estimate of its true effect, then aggregates the winning variants into one cumulative number. The correction applies empirical Bayes shrinkage, borrowing strength across experiments to shrink each estimate toward the overall distribution and correct for the winner’s curse. For more information, read our post on the effect distribution in experimentation.
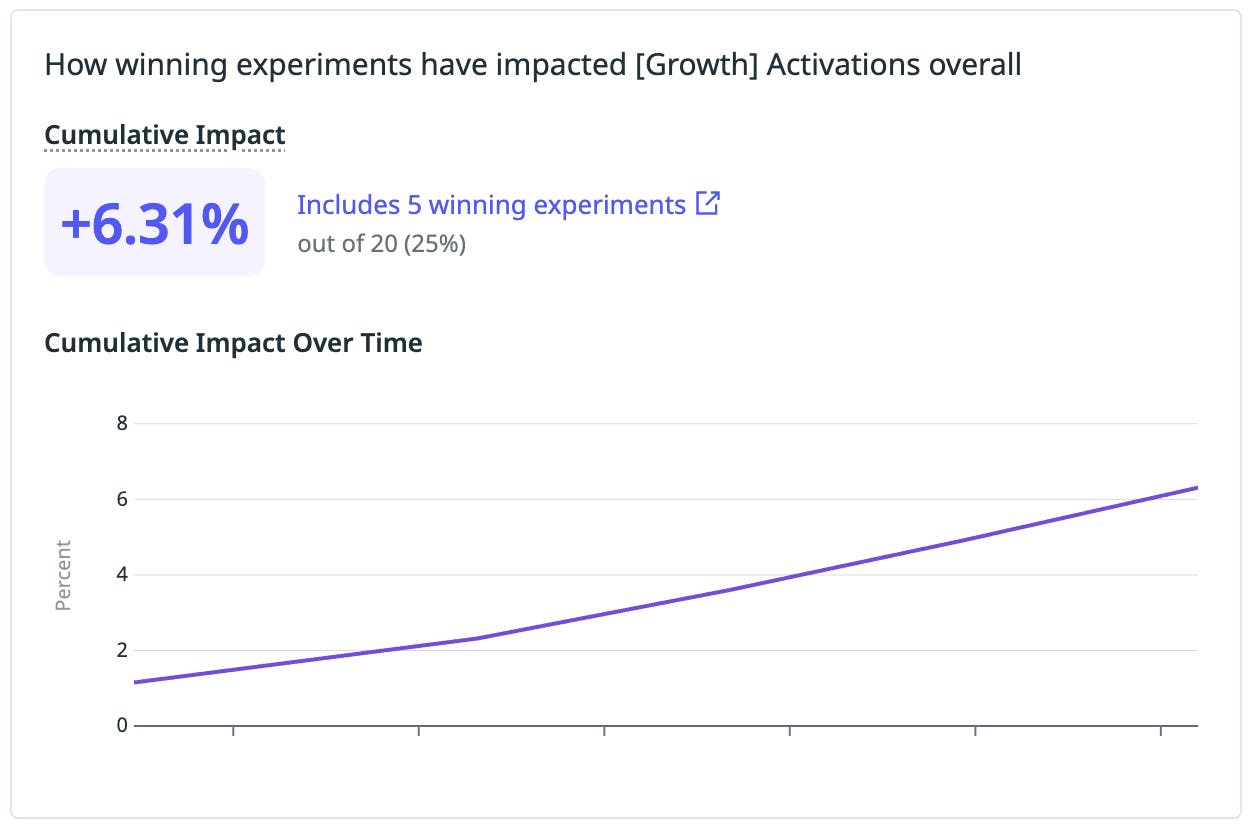
Skipping the holdout comes at a price. Cumulative Impact relies on three assumptions that a holdout does not need, and each one has a limitation worth knowing.
Exchangeable experiments
Think of each experiment’s true effect as a draw from a jar of possible outcomes. The model assumes every experiment draws from the same jar. Before it sees the results, the model has no reason to expect one experiment to have a larger or smaller effect than another. That is what exchangeable means here. The shared jar lets the model correct the winner’s curse by looking at the distribution as a whole and judging how far to shrink any single measured lift toward a realistic size.
The correction only holds when the experiments belong in the same jar. Pool a minor copy tweak with a major redesign and the correction distorts, so the experiments you group together matter.
Stable effect distribution
The model also assumes the jar does not change across the window you analyze, so every experiment in that window is still drawn from the same jar. The assumption breaks in two ways. If you shift strategy mid-window, say from small, safe tweaks to bigger, riskier redesigns, the earlier and later results are no longer draws from the same jar. And if an experiment ships on a measurement taken before a novelty effect wears off, its inflated lift looks like a draw from the jar even though it reflects a temporary distortion rather than a lasting effect.
A longer window gives the model more data, but it helps only when your strategy stays consistent and each experiment runs long enough for novelty to fade. A holdout avoids the problem, because it compares real user groups over whatever period it runs and captures the true combined effect as it stands, novelty and strategy shifts included.
No interactions among treatments
The model assumes each shipped change acts on its own, so the corrected effects can be added or multiplied together. In practice, two treatments applied to the same users can reduce or amplify each other’s effects. For example, a redesigned checkout page might behave differently once a new pricing experiment ships on top of it. Cumulative Impact cannot detect that. A holdout captures interactions directly, because the winners only group experiences every shipped change stacked together. In practice this assumption usually holds, since interaction effects in A/B testing are rare. Whether that is true for your program depends on your product, your metric, and the experiments you aggregate. Confirm it is reasonable before you rely on the cumulative estimate.
Choose between a holdout and Cumulative Impact
The right method depends on your traffic, your timeline, and whether you need a direct randomized estimate of the combined effect.
Reach for a holdout when:
You need a direct randomized estimate of the combined effect of all winning variants
You need to measure the long-term effects of winners
You have the time, resources, and patience to support a holdout
You have enough traffic to power the holdout analysis and all your other A/B tests
Reach for Cumulative Impact when:
You need a cumulative estimate quickly, without waiting out a holdout or keeping old feature flags alive
You need to estimate the cumulative impact of previous experiments that did not have a holdout
You don’t have enough traffic for a precise holdout estimate
Your run comparable experiments, with similar changes, a consistent strategy, and the same metric, so the exchangeability and stable-distribution assumptions hold
You have at least five qualifying experiments, enough for the model to produce a stable estimate
You are comfortable trading a direct randomized estimate of the combined effect for a faster, model-based estimate, and interactions and novelty effects are not a major concern for your metric
The two methods are not mutually exclusive. Many teams run Cumulative Impact for a fast, routine read and use a holdout for the highest-stakes, long-horizon questions or to validate the assumptions behind the cumulative estimate.
Key takeaways for measuring cumulative impact
Cumulative impact is not a number you can reach by summing observed lifts. The winner’s curse biases effect estimates from statistically significant winners upward on average, so adding them carries that bias into the total. A holdout measures the combined effect of your winners directly in a single randomized experiment, while Datadog’s Cumulative Impact corrects and aggregates your existing estimates without one. Choose a holdout when you need a direct randomized estimate of the combined effect and you have the traffic and time. Choose Cumulative Impact when you need a fast read and your experiments are comparable enough for the model’s assumptions to hold. For more detail on the model and how to run it, see the Datadog documentation on Cumulative Impact and our post on effect distribution in experimentation.
If you are not already a Datadog customer, you can measure the cumulative impact of your experiments by signing up for a 14-day free trial.
