Proper Agent and application configuration is essential for monitoring all parts of your infrastructure. Agent check status information lets you know if there’s a problem in your Agent or application configuration so you can ensure there are no gaps in your performance monitoring. We’re excited to announce the addition of at-a-glance Agent check status information to the Datadog Infrastructure page to report integration issues in your hosts monitored by Datadog.
Find configuration issues with Agent check status
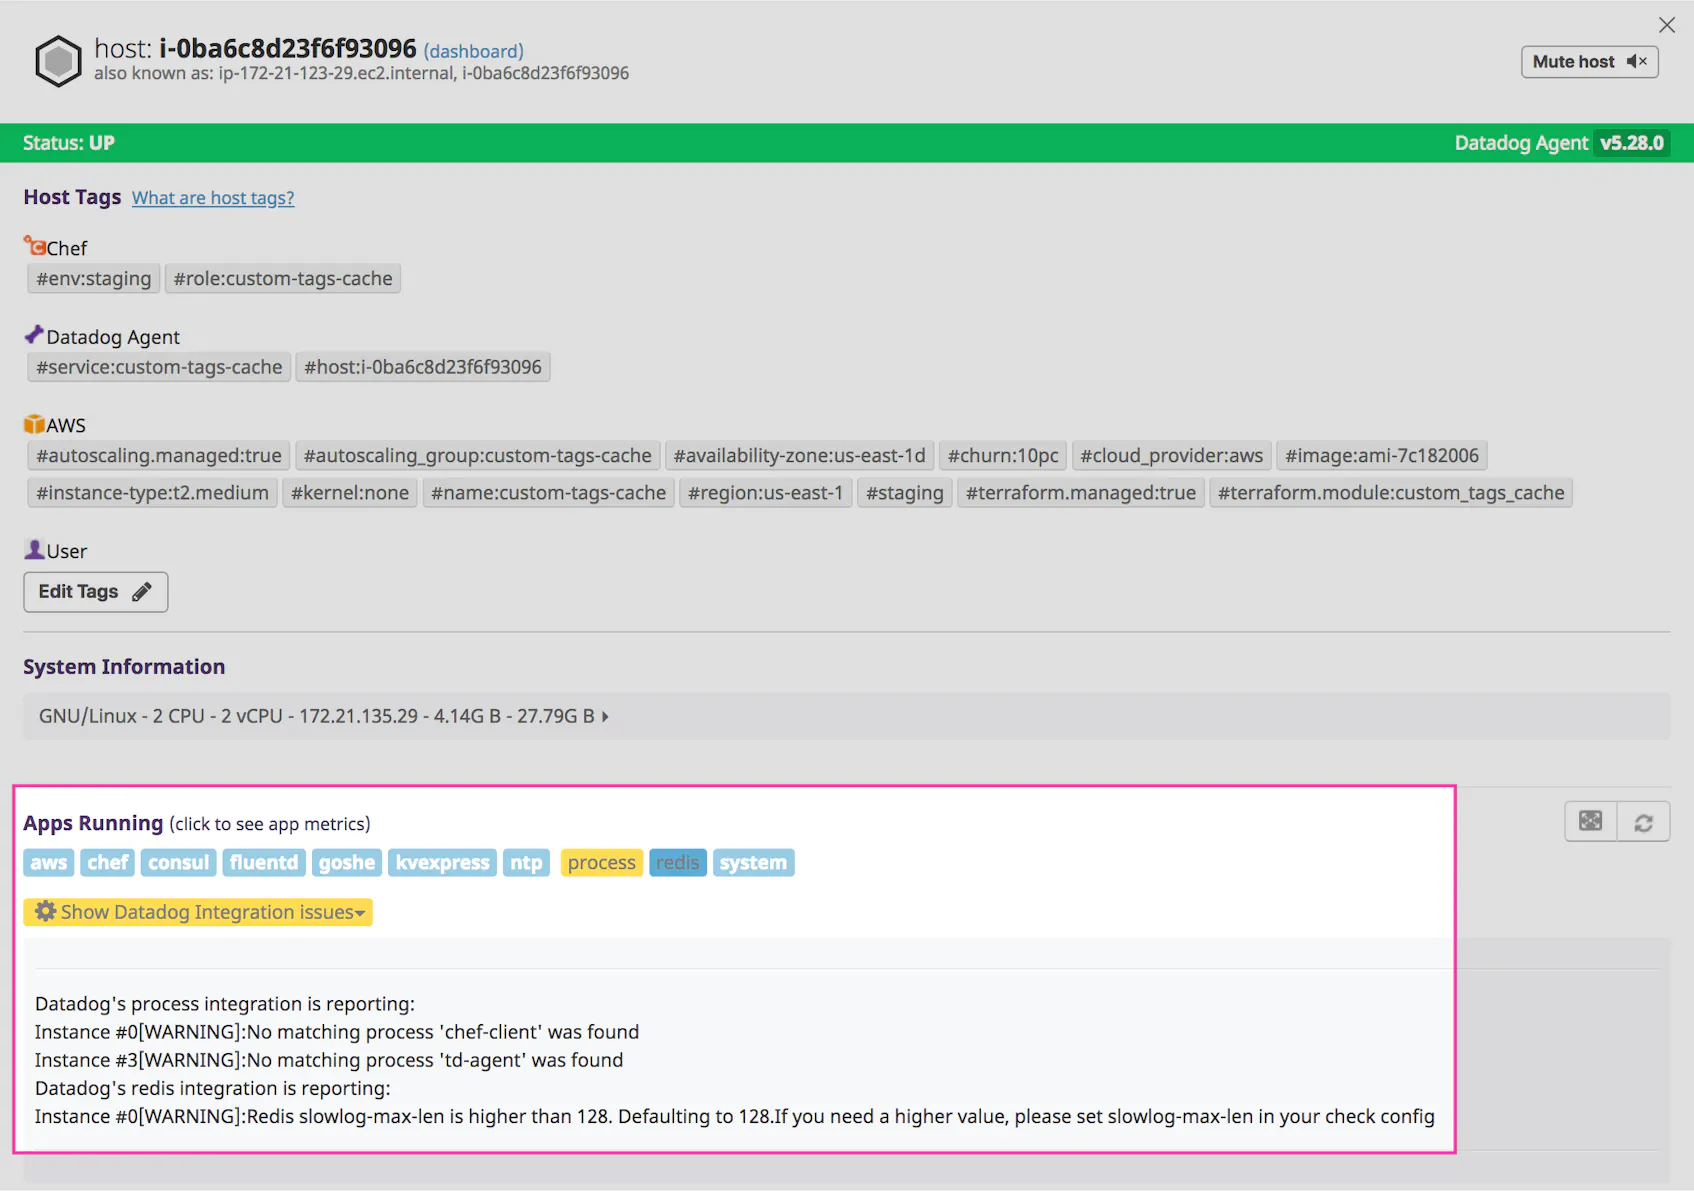
With the addition of Agent checks on the Infrastructure page, you’re now able to see when an Agent check has an error or warning. This tells you when apps are reporting metrics correctly, but more importantly, it lets you know when they are not. As seen in the example below, an app configured incorrectly will appear yellow, indicating that at least one of its checks is not working properly.
You can get more detail about the configuration issue by clicking on the problematic app, which will open the inspector panel. In the example below, the inspector panel says that the Datadog Agent can’t connect to the process and Redis integrations. This indicates that either the Agent isn’t reporting any metrics from these integrations because there’s an issue with their configuration files, or that the services are down on that specific host.
This information provides detailed logging so you’re able to pinpoint the issue and resolve it quickly.
Keep your integrations reporting
With Agent check status, you can now enable integrations without having to worry about missing important metrics.
To check out all the ways Datadog can monitor the performance of your applications and infrastructure, get a free trial for 14 days.
Note: This feature is available for hosts with Agents v4.3+ installed


