BigQuery is Google Cloud Platform’s fully managed serverless data warehouse. It enables data analysis and storage at petabyte scale while eliminating the overhead of managing infrastructure. As a managed service, BigQuery autoscales and provisions compute resources and storage as needed, helping you reduce the overhead of managing infrastructure but also reducing your visibility into performance. And BigQuery users face other challenges when it comes to visibility: BigQuery offers various pricing models and is often shared as a service by many different teams within organizations, making it difficult to track storage and compute costs.
Datadog’s BigQuery integration helps you track and analyze your BigQuery usage and gauge the efficiency of your queries in order to help you optimize costs and performance. In this post, we’ll cover how you can use the new out-of-the-box (OOTB) dashboard for our BigQuery integration to:
Track BigQuery cost drivers and resource consumption
BigQuery costs for both compute and storage are driven by a range of factors. When it comes to compute, users can choose between (or mix and match) two distinct pricing models for their workloads: on-demand pricing, which is based on the amount of data users process in their queries and other jobs, and capacity pricing, which allows customers to provision fixed allotments of compute capacity (as measured in slots, which are the virtual CPUs BigQuery uses to execute SQL queries).
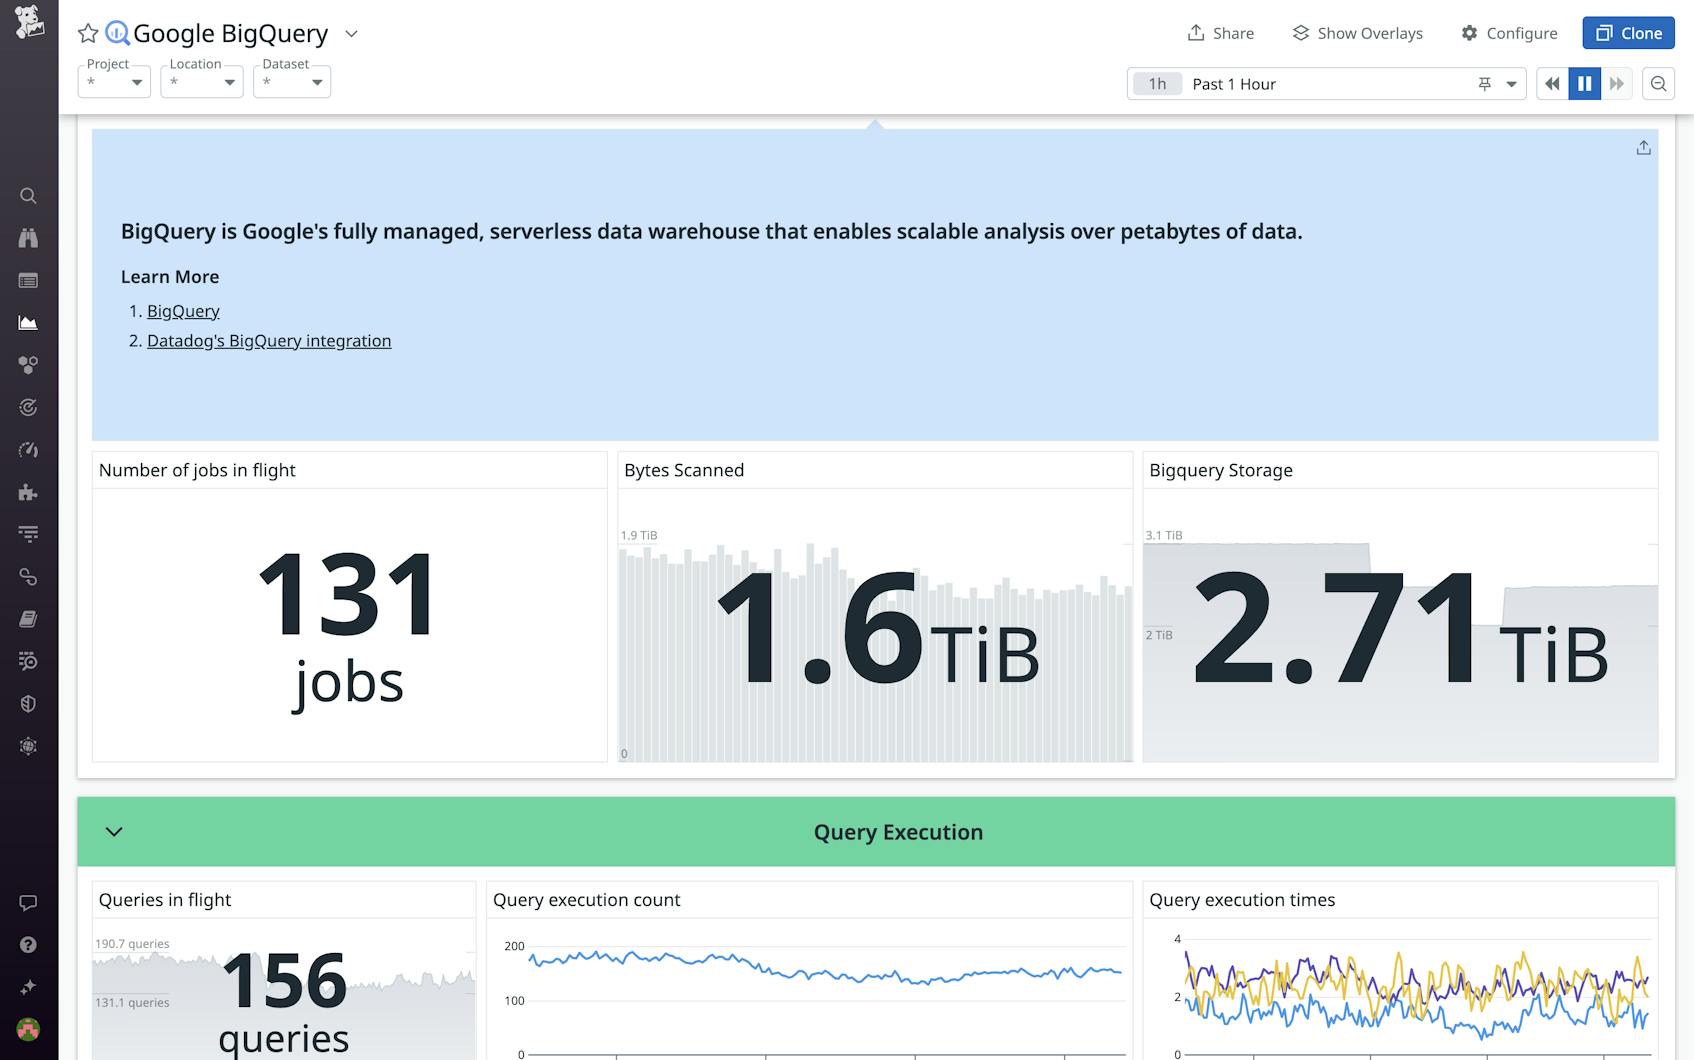
Datadog’s new OOTB BigQuery dashboard visualizes a variety of key metrics to help you track and analyze your BigQuery usage and primary cost drivers across both of these pricing models, whether you’re using BigQuery primarily for data analytics or for storage. Three high-level metrics at the top of the dashboard help provide an overview of your consumption of compute resources and storage:
- Number of jobs in flight: the overall number of actions—such as querying, loading, exporting, and copying data—in progress.
- Bytes scanned: the amount of data processed by your queries.
- BigQuery storage: the volume of your data in active storage in BigQuery.
For more granular cost analysis, this dashboard provides key Query Execution metrics, which help you identify overall usage trends and inefficiencies. And to help you analyze your resource usage in depth, the dashboard provides dedicated sections for tracking slot allocation and storage usage. By breaking down the number of slots allocated to each of your Google Cloud projects, as well as the slots allocated to query, export, and reservation processes per project, the dashboard enables you to quickly attribute BigQuery compute costs to specific teams and projects.
Storage metrics help you track your overall usage of BigQuery storage and analyze what is driving that usage. The aggregate table count, upload rate, and uploaded row count metrics enable you to gauge the rate at which your storage footprint is growing. To analyze precisely what’s driving that growth, you can filter the dashboard by project, location, or dataset.
Monitor and optimize query performance
Efficient query design is essential to ensuring optimal performance and cost-effective data management. Queries that take a long time to execute or include a high number of operations per result can eat up excessive compute resources, leading to exorbitant costs. Inefficient queries can also be a major detriment to user experience—by blocking other queries from running, they can drag down the performance of any applications that use BigQuery as a service, increasing application latency and potentially causing downtime in dependent services.
This dashboard provides several key metrics for your queries in order to help you analyze usage trends and optimize performance:
- The queries in flight metric tracks the overall volume of your queries, including everything from recurring automated jobs to ad hoc queries.
- Query execution count helps you assess compute usage trends over time.
- The query execution times metric helps you track querying efficiency and identify suboptimal performance. High execution times may indicate excessive compute usage, pointing to room for optimization of performance as well as costs. In addition to tracking these execution times via this dashboard, you may want to configure metric monitors to alert you when query execution times breach acceptable limits.
For any application relying on BigQuery as a data store or analytics service, efficient query performance is key. These metrics enable you to monitor that performance in order to ensure that you stay on track with your SLOs and help you troubleshoot performance issues.
Get comprehensive visibility into your data analytics stack
Datadog’s dashboard for BigQuery provides key insights into BigQuery costs and query efficiency. These insights enable you to rein in your cloud spend, troubleshoot issues, and optimize performance. Once you’ve installed the BigQuery integration, you can search for “Google BigQuery” in Datadog to get started.
Because Datadog integrates with over 600 other technologies, including Spark, Airflow, and Kafka, this dashboard can help you get comprehensive visibility into your data stack. If you’re new to Datadog, you can sign up for a 14-day free trial.


