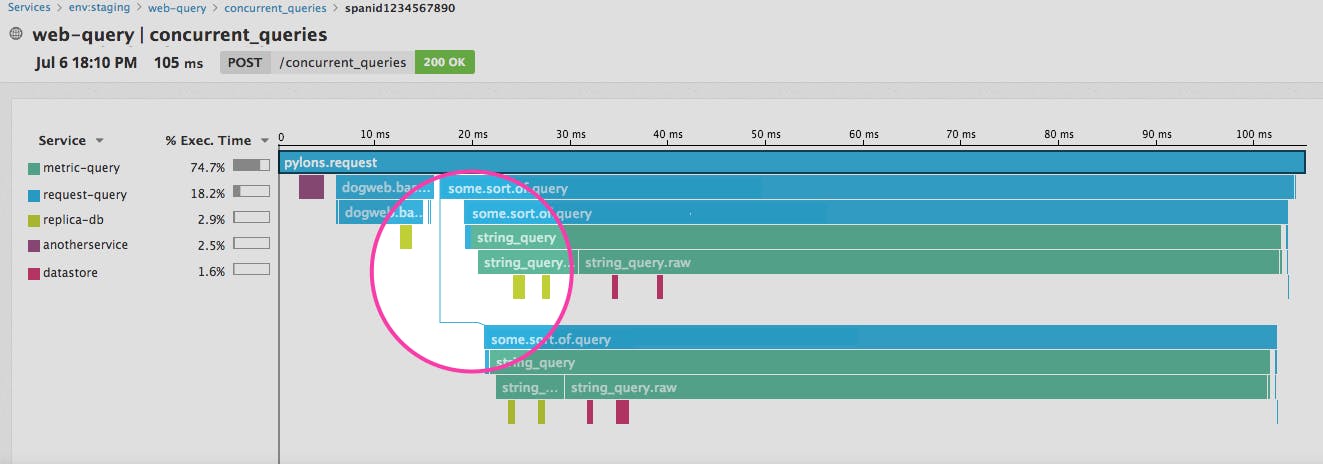
Over the past few years, asynchronous programming has been gaining popularity among Python developers who want to optimize I/O-bound applications. If you belong to this growing cadre of developers, we’re pleased to share that Datadog APM’s Python tracing client now integrates with a number of asynchronous libraries (including asyncio, aiohttp, gevent, and Tornado), so you can quickly gain visibility into your distributed applications with end-to-end flame graphs and minimal configuration.
Developed with async in mind
Asynchronous programming helps optimize the performance of I/O-bound Python applications by implementing cooperative multitasking rather than multithreading (which only poses benefits for CPU-bound applications). For example, asyncio enables a web app to strategically switch to another task/coroutine within a single-threaded event loop, instead of blocking on a network event or a database response. However, this cooperative multitasking behavior is also precisely what makes asynchronous code more challenging to trace and debug.
Many tracing tools don’t know how to keep track of the context switching that occurs in asynchronous applications, which can result in inaccurate traces (e.g., data from different requests being combined in a single trace). Datadog’s Python APM client has been designed specifically to include async support, so that users can easily instrument all kinds of applications, regardless of whether they’re running synchronous or asynchronous code.
Trace to the finish
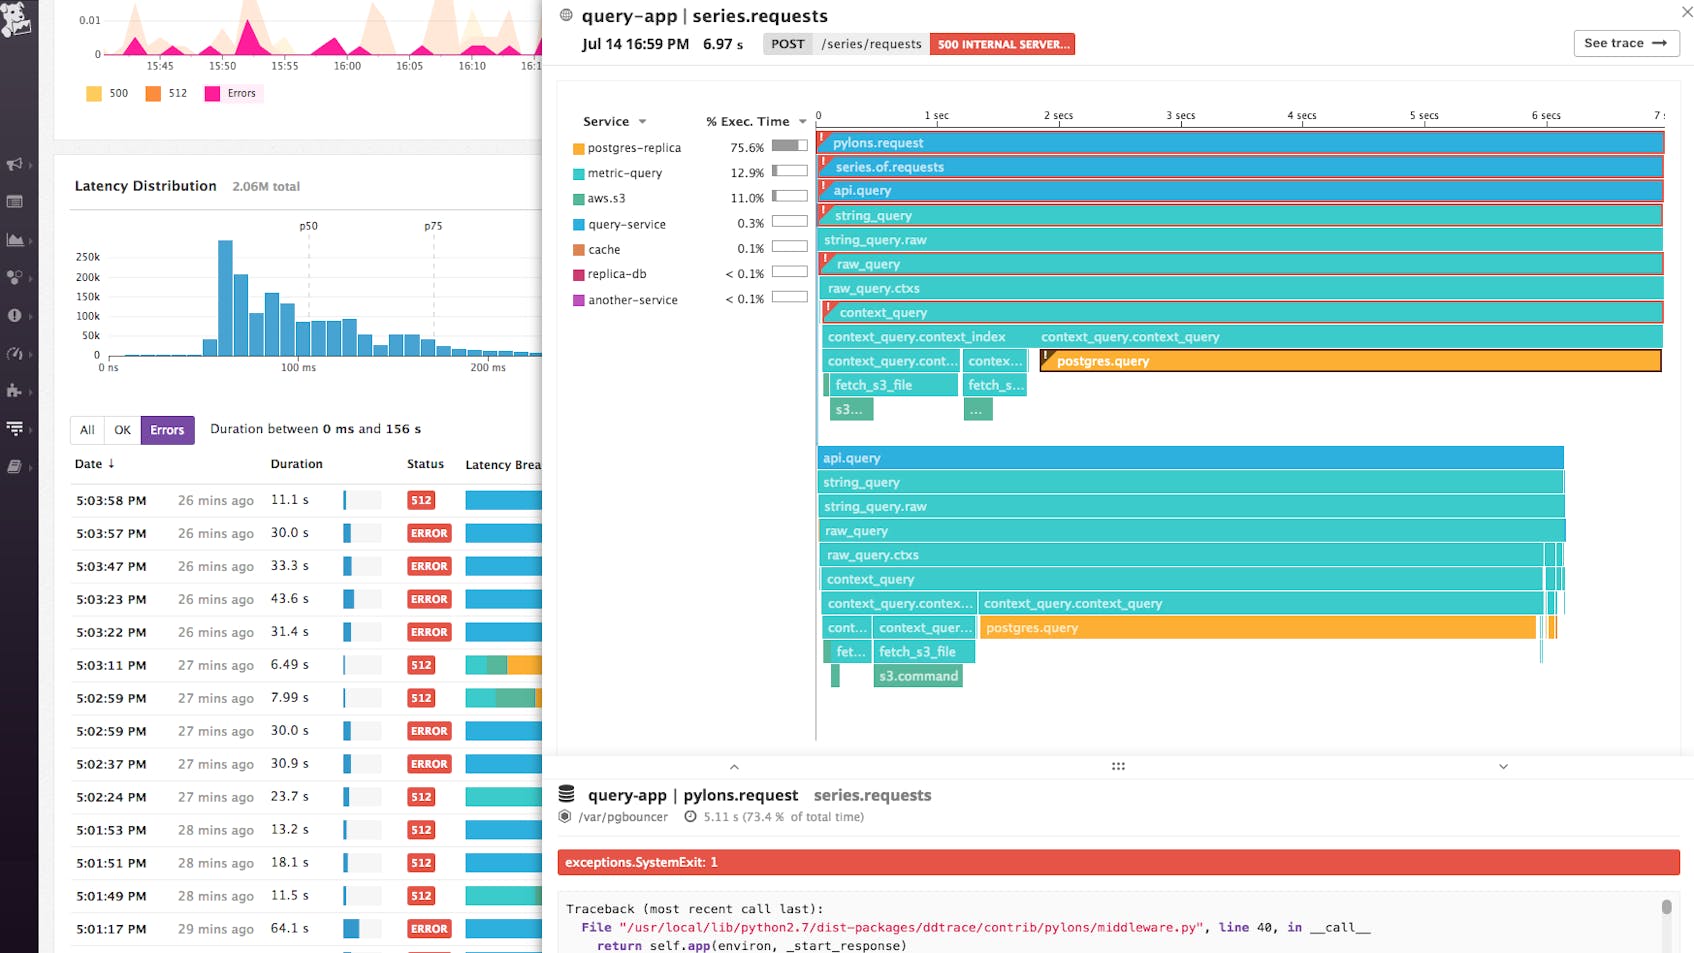
Datadog APM’s end-to-end flame graphs provide visibility into how asynchronous tasks are executed concurrently across your environment. Within each flame graph, you can trace a single request as it travels across service boundaries, and identify if/when it encounters errors or excessive latency along the way. In the example shown below, we can see that one coroutine encountered an error, while the second one was completed successfully. You can view the full stack trace for additional context to help debug the error.
Tracing asynchronous requests enables you to investigate why certain tasks are slower than others, or to identify exactly which code paths are producing errors. And once you start collecting all of this information in Datadog, you can alert on service-level indicators just as easily as any other metric. For example, you can set up targeted APM monitors that alert you when the p95 latency of a critical service is increasing, or when any service starts exhibiting a high 5xx error rate.
Tracing awaits
To start tracing your asynchronous Python applications, you simply need to configure the tracer to use the correct context provider, depending on the async framework or library you’re using. Datadog APM can even auto-instrument some libraries, like aiohttp and aiopg. (To make use of these features, make sure that you’re running version 0.9.0 or higher of the Python APM client.)
If you’re currently using Datadog but haven’t tried APM yet, find out more details here. Otherwise, if you’re new to Datadog, sign up for a free trial.
Thanks to our contributors
We’d like to thank Alex Mohr for his contributions enhancing async support in the Python tracing client. The library is open source, so if you’re interested in contributing, check out the repo here.


