In Part 1 of this series, we covered a number of features that SQL Server provides for optimizing its resource usage. You can, for example, adjust the way your query batches are compiled, configure your buffer cache to flush at different intervals, and create memory-optimized tables. Making the most of these features requires that you get real-time insights into the health and performance of SQL Server. Here we’ll survey SQL Server monitoring tools within built-in features and commonly used applications, including:
- T-SQL queries: Use SQL Server’s query language to gather internally collected data
- SQL Server Management Studio (SSMS): Get real-time views into your system, diagrams of T-SQL queries, and on-demand reports
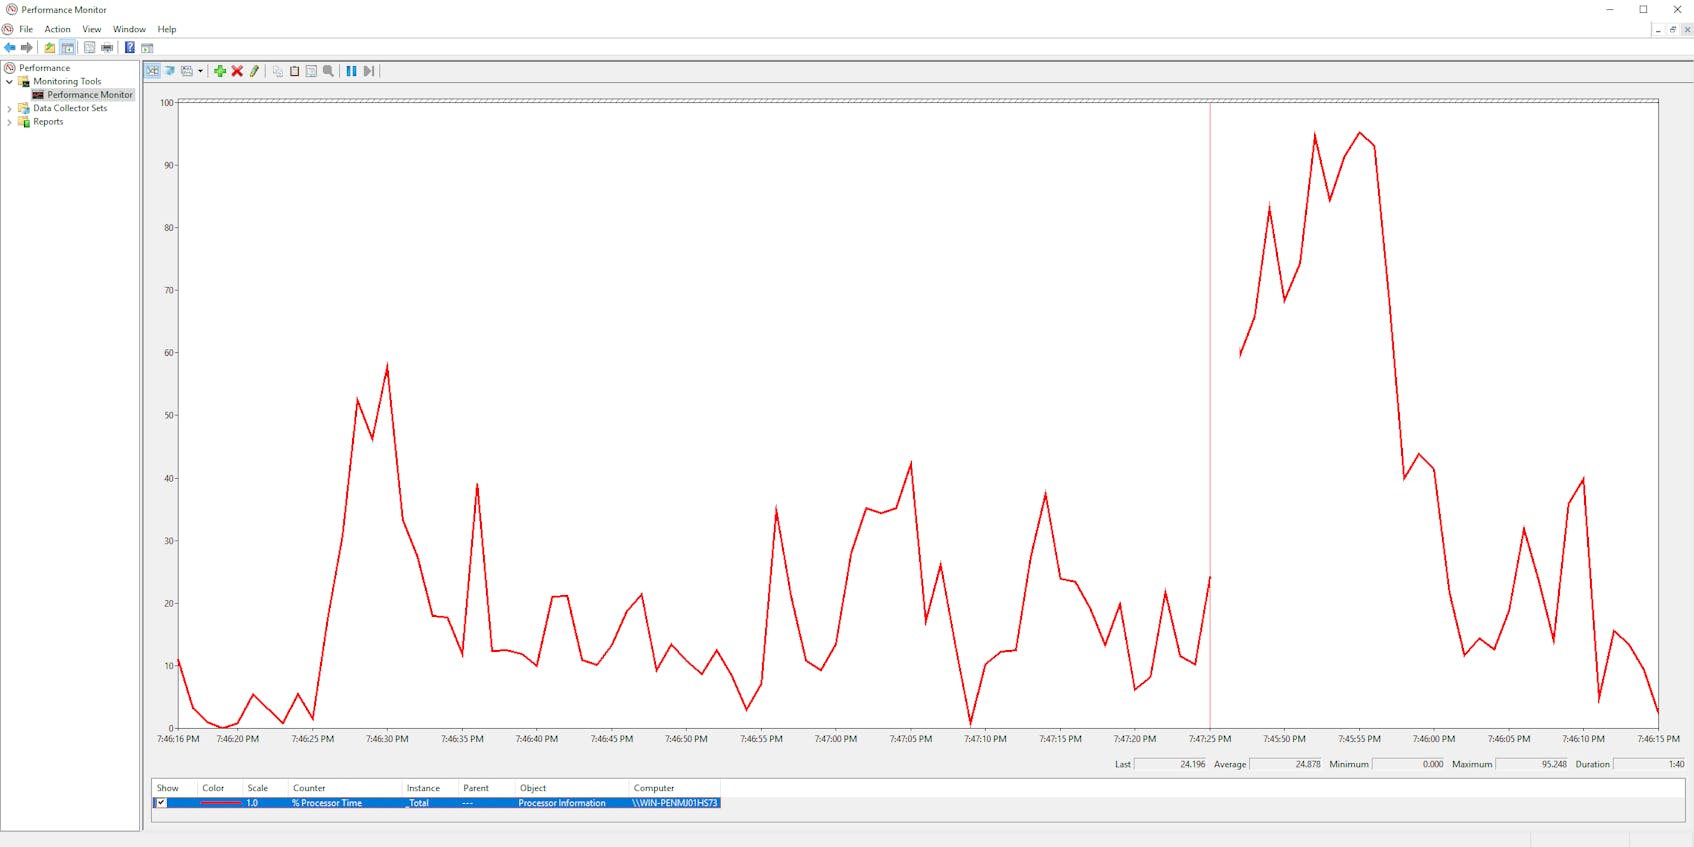
- Performance Monitor: Correlate metrics from SQL Server with data from your Windows hosts
SQL Server monitoring tools can help you access the metrics we discussed in Part 1. Some of these tools report the same metrics, and you may prefer one interface over the other. For example, you can use either the Performance Monitor or T-SQL queries to obtain metrics from SQL Server’s performance counters. You might opt for the real-time graphs of the former versus the ability to script the latter. In this post, we’ll explain how to use SQL Server monitoring tools to gain a comprehensive view of your database infrastructure.
Using T-SQL queries
You can monitor SQL Server by using its own query language, T-SQL, to gather metrics. T-SQL queries are flexible. You can run them with a graphical management tool like SSMS or a command line utility like sqlcmd. And since they are executed and return data just like any other database query, you can easily incorporate them into a homegrown automated monitoring solution. In this section, we’ll show how T-SQL queries can be a powerful tool for SQL Server monitoring, whether you’re using dynamic management views, built-in functions, stored procedures, or system data collection sets.
Dynamic management views
SQL Server tracks data about its own health and performance, and makes this information available through dynamic management views (DMVs). Because DMVs are displayed as virtual tables, they lend themselves to both ad-hoc and automated querying. Some DMVs return the current value of a metric or setting (e.g., the current size of the transaction log in megabytes). Others, particularly the metrics for rates within the performance counters DMV, measure values at regular intervals and take the difference between consecutive samples (e.g., batch requests per second). You can read about specific DMVs in the SQL Server documentation.
If you’re monitoring SQL Server with dynamic management views, you’ll probably want to query the performance counters DMV, sys.dm_os_performance_counters. Each SQL Server performance object (which can represent anything from a database to the plan cache) maintains its own set of performance counters, which map to many of the categories of metrics discussed in Part 1: SQL statistics, locks, and the buffer manager.
For example, you can query the performance counters DMV to view data from the buffer manager performance object and limit the results to metrics with nonzero values:
SELECT object_name, counter_name, cntr_value
FROM sys.dm_os_performance_counters
WHERE object_name="SQLServer:Buffer Manager" AND cntr_value != 0;
GO
You’ll get a result similar to this (but with many more rows!):
object_name                            counter_name                         cntr_value
---------------------------------------------------------------------------------------
SQLServer:Buffer Manager               Buffer cache hit ratio               30
SQLServer:Buffer Manager               Buffer cache hit ratio base          30
SQLServer:Buffer Manager               Page lookups/sec                     11091500
SQLServer:Buffer Manager               Database pages                       5819
SQLServer:Buffer Manager               Target pages                         212992
SQLServer:Buffer Manager               Integral Controller Slope            10
You can find a list of the available dynamic management views organized by category here. Within each category, views are diverse—while some calculate performance metrics and output numbers, others report names and properties. You can list the SQL Server nodes in a cluster, retrieve index usage data, and get statistics for your execution plans like completion time and resource use. And since dynamic management views behave like tables, you can use built-in functions to aggregate and rank the data.
It’s important to check the documentation for any DMV you plan to use. One reason is that DMVs require different permissions, and the documentation for each DMV explains the required level. Another reason is that DMVs may contain thousands of rows, and columns may change with new versions of SQL Server.
Built-in functions
SQL Server also includes built-in functions to help you access system information. Unlike dynamic management views, which return data in the form of virtual tables, built-in functions return system data as single numerical values, calculated since the server was last started. You can call each built-in function as the argument of a SELECT statement. For example, you can use the built-in function @@connections to return the sum of successful and unsuccessful connections over time:
SELECT @@connections AS "Total Connections";
GO
You’ll receive output similar to:
Total Connections
-----------------
             1571
Built-in functions sometimes resemble dynamic management views. @@connections is similar to the User Connections counter within the general statistics object. But while User Connections tracks the number of currently connected users, @@connections increments every time a user attempts to log in (even if the attempt is unsuccessful).
The only built-in system statistics function that doesn’t return a single numerical value is sys.fn_virtualfilestats, which returns a table with data on disk I/O for database files, and yields the same information as the sys.dm_io_virtual_file_stats dynamic management view.
System stored procedures
Editor’s note: SQL Server uses the terms “master” to identify its primary Database. Datadog does not use this term.
Another built-in feature you can use to query metrics is the system stored procedure. Most stored procedures help with administrative tasks such as attaching a database or adding a login, but some stored procedures report metrics. For example, sp_spaceused measures disk consumption within a database. You call system stored procedures with EXEC rather than SELECT statements. This command calls the sp_spaceused stored procedure, which will return disk usage information as two result sets (that is, two table rows, each row including different columns):
EXEC sp_spaceused;
GO
The output will have a similar format to the following:
database_name     database_size      unallocated space
--------------- ----------------- ---------------------
master            6.00 MB            0.52 MB

reserved           data               index_size         unused
--------------- ----------------- ------------------ ------------
3568 KB            1536 KB           1600 KB             432 KB
System data collection sets
If you’re using T-SQL queries to gather metrics from SQL Server, and you want to be able to store the data and generate reports, you might consider using SQL Server’s collection sets. A collection set draws data from a range of reporting commands and dynamic management views, and sends the data to a dedicated database called a Management Data Warehouse.
The process relies on SQL Server Integration Services to automate the task of querying the database and writing the results to the Management Data Warehouse.
For example, as of SQL Server 2008, the disk usage collection set queries the sys.dm_io_virtual_file_stat dynamic management view and other views such as sys.partitions and sys.allocation_units. You can also create a custom collection set that corrals a sequence of T-SQL queries into a periodic job that runs in the background. You can learn more about configuring the Data Management Warehouse here.
SQL Server Management Studio
SQL Server Management Studio (SSMS) is a graphical environment that helps you monitor your system in several ways:
- Live statistics in the Activity Monitor
- A data-rich map of a given query
- Reports that combine tables, graphs, and text in a printer-friendly format
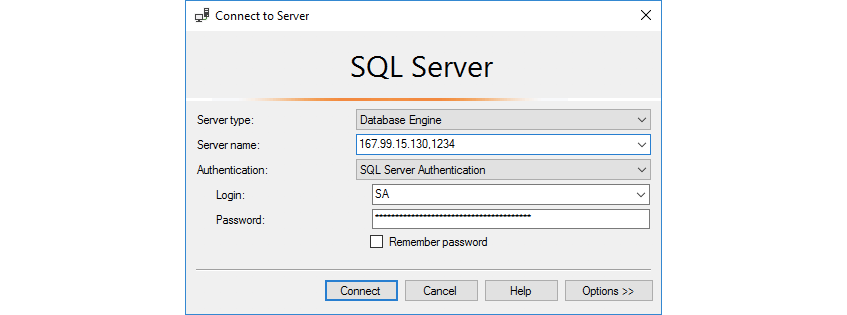
To use SSMS, you’ll need to download it on one of your hosts, open the installer, and follow the prompts. The software can monitor remote instances of SQL Server, including any instances running on Linux. To connect to a host, navigate to the “File” menu and click “Connect Object Explorer.” In the dialogue that follows, specify the host and port in the “Server name” field, in the format 0.0.0.0,0000 (note the comma). Select “SQL Server Authentication” in the “Authentication” dropdown menu, and fill in the username (“Login”) and password.
If you’ve connected successfully, you’ll see the “Object Explorer” window populate with a file tree that shows the components of your SQL Server instance, including databases. You’ll then be able to monitor your instance with the features shown below.
Activity Monitor
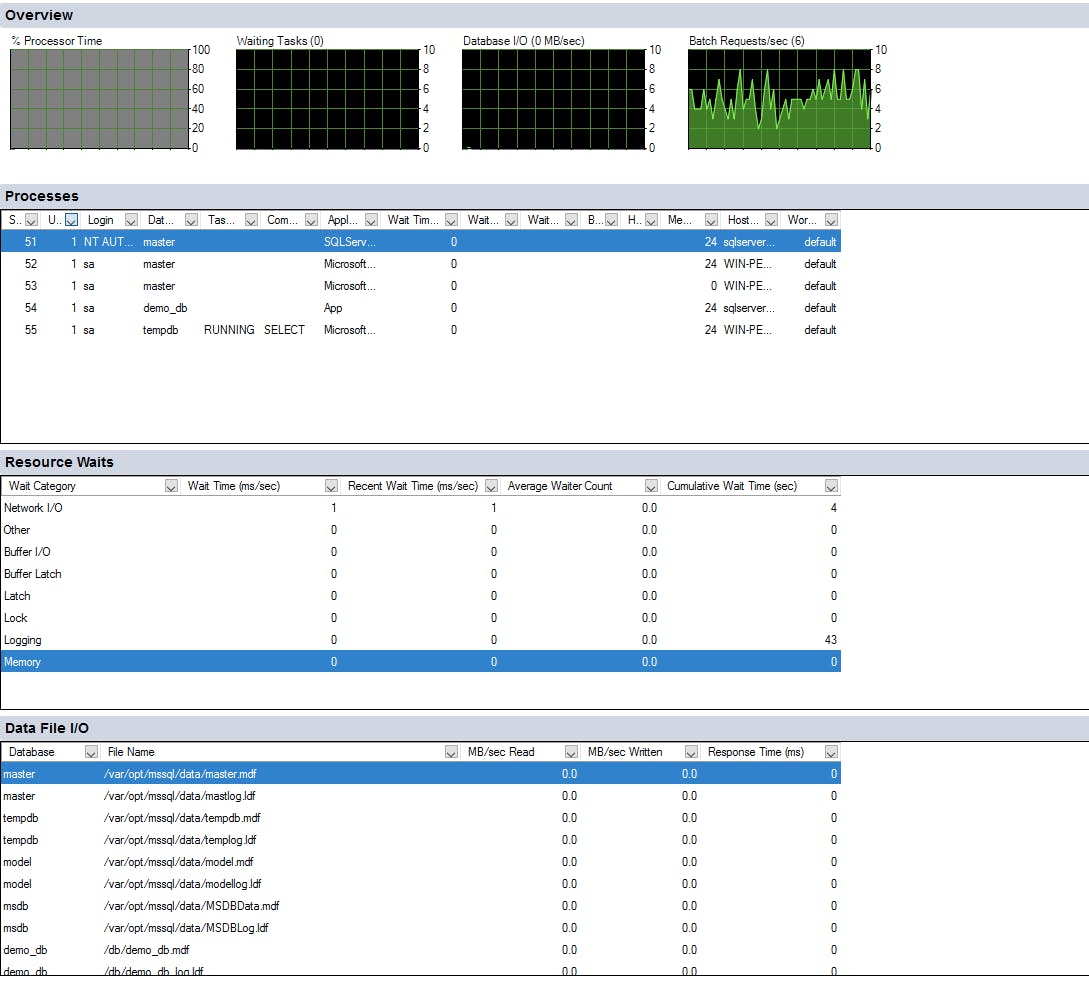
The Activity Monitor makes it possible to view SQL Server metrics in real time, with a gallery of graphs, an overview of processes, and statistics about your queries. If you’re already using SSMS for management tasks like configuring resource pools or creating tables, the Activity Monitor is easy to add to your workflow. To use the Activity Monitor, type “Ctrl-Alt-A” or click the icon within the SSMS toolbar.
You can use the Activity Monitor to get real-time insights into the demand on your SQL Server instance. The “Overview” section shows four graphs that display work and resource metrics in real time. By default, these metrics refresh every 10 seconds, but you can update the refresh interval by right-clicking on the “Overview” pane. While the refresh interval can be as frequent as once per second, this comes with the performance cost of more frequent database queries.
The “Recent Expensive Queries” pane within the Activity Monitor can help provide the information you need to make your queries more efficient. Here you’ll find query-related metrics like executions per minute, physical reads per second, and the number of duplicates of an execution plan within the cache. If a single execution plan has a high number of duplicates or executions per minute, you may be able to boost performance by using query hints as discussed in Part 1.
The Activity Monitor provides a convenient high-level overview of your database, but it does have its limits. For one, you can’t adjust the sizes of the graphs or the metrics they show. Nor can you change the way the Activity Monitor aggregates its statistics for query performance, or view data beyond the preset display window.
Visualizing queries
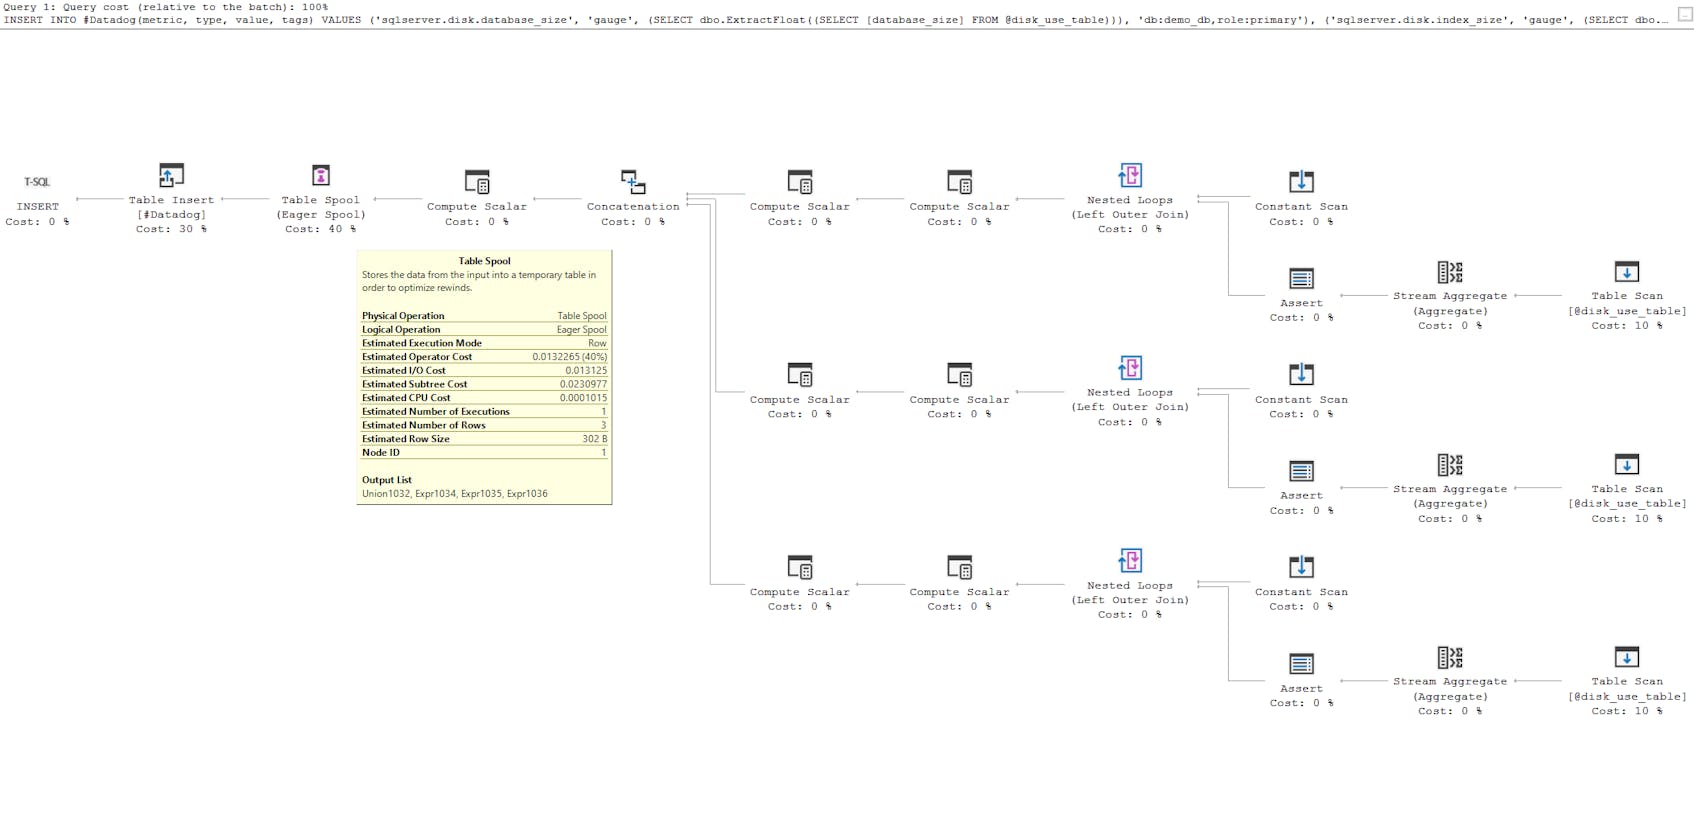
SSMS can help you optimize query performance by enabling you to visualize how SQL Server executes its query plans, and showing you the resource usage associated with executing each step of a query plan. As we discussed in Part 1, SQL Server compiles batches of T-SQL statements by using an automatic optimizer to transform the batch into an execution plan. You can inspect an execution plan in SSMS as a diagram of computational steps, and find out exactly how the optimizer interpreted your batch. To visualize a query, navigate to the Activity Monitor’s “Recent Expensive Queries” pane, right-click on one of the queries, and click “Show Execution Plan.” The view that follows will look something like this:
If you mouse over a node within the diagram, you can see a brief explanation of the step the node represents, as well as a quick readout of the node’s “Estimated Operator Cost.” This value is calculated by the SQL Server optimizer when executing the query. Since the optimization process is automatic, this gives you a way to check that your batches have compiled as intended. And because each step in the execution plan is scored by cost, you can see which steps you should focus on if you want to boost performance.
In this example, we can see that Compute Scalar (converting a string to a float) is minimal, with zero cost in the execution plan. The most costly operation is an optimization technique, table spooling, which copies rows into a hidden temporary table.
Reports
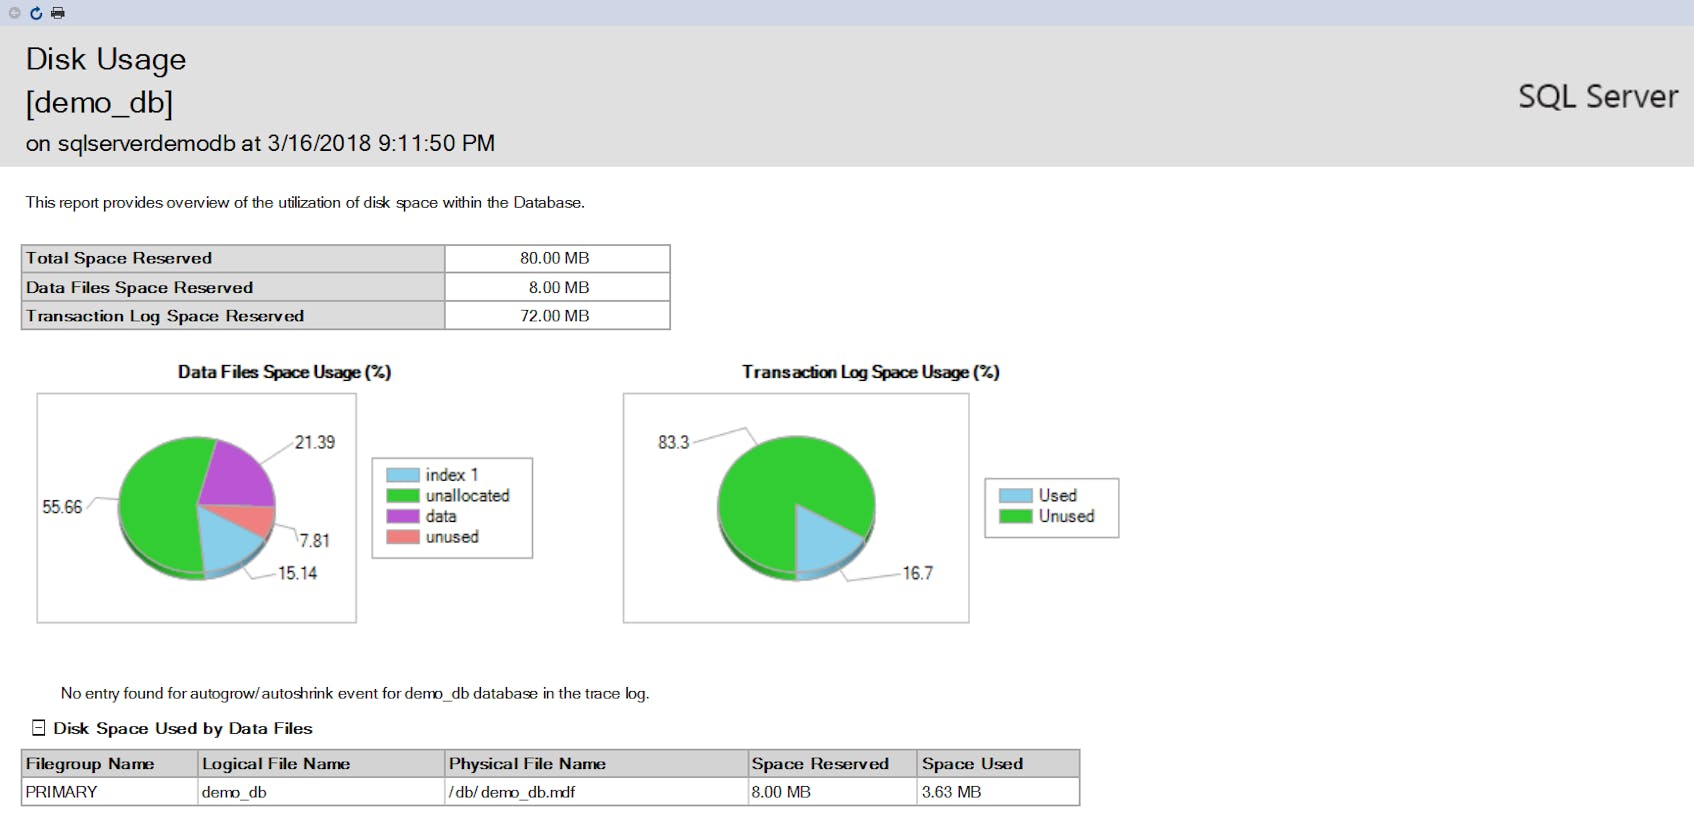
SSMS offers 20 standard reports that provide a high-altitude survey of your SQL Server deployment, ranging from your database’s resource usage to historical data about schema changes and database consistency. You can find a detailed breakdown of the reports here.
Reports are fixed in layout and content—they show data available the moment you create the report, rather than updating in real time. Interactivity in the standard reports is limited. You can sort some tables by column and expand others when information is nested. The fixed layout makes it straightforward to create printouts or documents (PDF, Word, and Excel).
In 2017, Microsoft added the Performance Dashboard report, which shows CPU utilization, current counts of user sessions, and other system information for SQL Server instances.
To generate a report, right-click the name of a database in Object Explorer, mouse over “Reports,” then over “Standard Reports,” and select a report from the menu.
If you can’t find the view you need from the SSMS standard reports, you can create a custom report. Custom reports are written in Report Definition Language (RDL), an extension of XML. After you’ve specified the structure of a custom report, you can populate it from the “Reports” menu by clicking “Custom Reports.” These remain separate from the list of standard reports.
It’s also worth noting that Microsoft has developed several tools for creating graphical reports that go beyond the functionality of SSMS. Power BI can visualize data from a number of sources, including SQL Server, and comes with a more full-featured set of visual editing tools. SQL Server Reporting Services (SSRS) is a graphical reporting tool designed for SQL Server that can generate paginated, PDF-ready reports as well as data visualizations for mobile devices and the web.
Performance Monitor
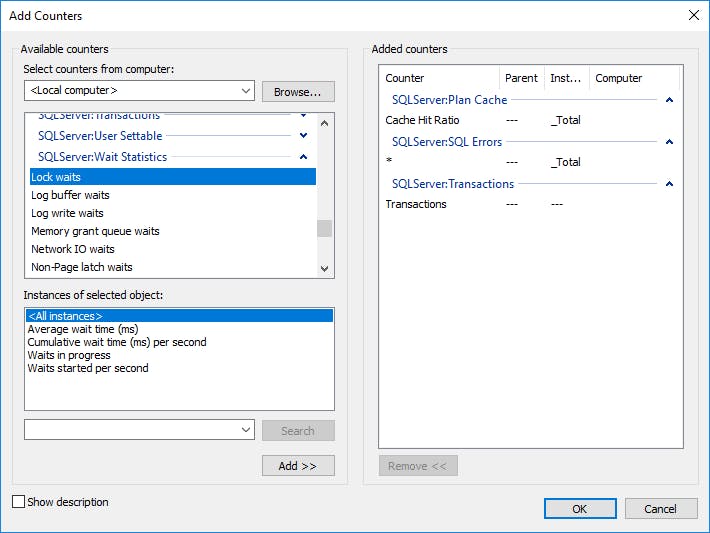
Windows Performance Monitor helps you visualize system-level resource usage from your Windows hosts, and enables you to correlate these metrics with SQL Server performance counters in timeseries graphs.
Performance Monitor is built into the Windows operating system. To use it, open the Run window from the Start Menu and enter the program name perfmon. A real-time graph will appear in the navigation tree under “Monitoring Tools.” You can then select SQL Server performance counters and system resource metrics you’d like to plot, and use the options to style your graphs.
Richer real-time SQL Server monitoring tools
In this post, we’ve shown how to use SQL Server monitoring tools and built-in features to generate real-time overviews of your databases as well as to get detailed, on-demand data on SQL Server health and performance.
In the next part of this series, we’ll show you how to use Datadog to collect, graph, and alert on real-time and historical SQL Server metrics. We’ll also show you how to set up dashboards with drag-and-drop visualizations, and correlate SQL Server metrics with data from across your stack.

