Datadog Database Monitoring (DBM) provides comprehensive visibility into SQL queries running on your databases. Using DBM, you can troubleshoot database performance issues by drilling into frequently used queries and analyzing historical trends in your queries’ metrics and execution plans.
Whether you operate self-hosted SQL Server, Azure SQL Database, or leverage Azure SQL Managed Instance, DBM can provide deep visibility into the databases your application depends on. In this post, we’ll cover how you can use Database Monitoring to monitor the health and performance of SQL Server and Azure Database for PostgreSQL and MySQL.
Optimize SQL Server query performance
SQL Server is a relational database management system developed by Microsoft that uses an extension of SQL called Transact-SQL (T-SQL) for its queries. Using T-SQL, you can write queries that SQL Server will automatically compile and cache as execution plans in order to minimize latency. With DBM, you can sort your queries by average latency and drill into slow queries to inspect recent trends in their performance. If a query begins to execute more slowly without an obvious reason, it may be experiencing plan regression. By selecting a query in DBM, you can compare its execution plans over time (shown below) to identify potential regressions and the most cost-effective plan to reduce execution latency.
After inspecting a query’s execution plan, you can navigate to the Metrics tab within the Query Details panel to visualize trends in performance and resource usage. For example, DBM provides visibility into each query’s memory grant usage (memory used to reserve and store temporary data for workspace queries). If you notice large disparities between a query’s received memory grant and used memory grant, the query may be reserving more memory than it needs and putting your database at risk of memory pressure. As a result, your database may experience abnormally long wait queues and decreased concurrency, resulting in high latency. By visualizing your database’s memory metrics with DBM, you can decide if you need to enable memory grant feedback, which allows SQL Server to automatically adjust your memory grant configurations based on past query performance.
To detect performance issues, you can use our SQL Server integration to create monitors tracking the number of queries in queue for memory grant allocation. You can also configure an anomaly monitor that notifies you if a query begins to take an abnormally long time to execute, as shown below.
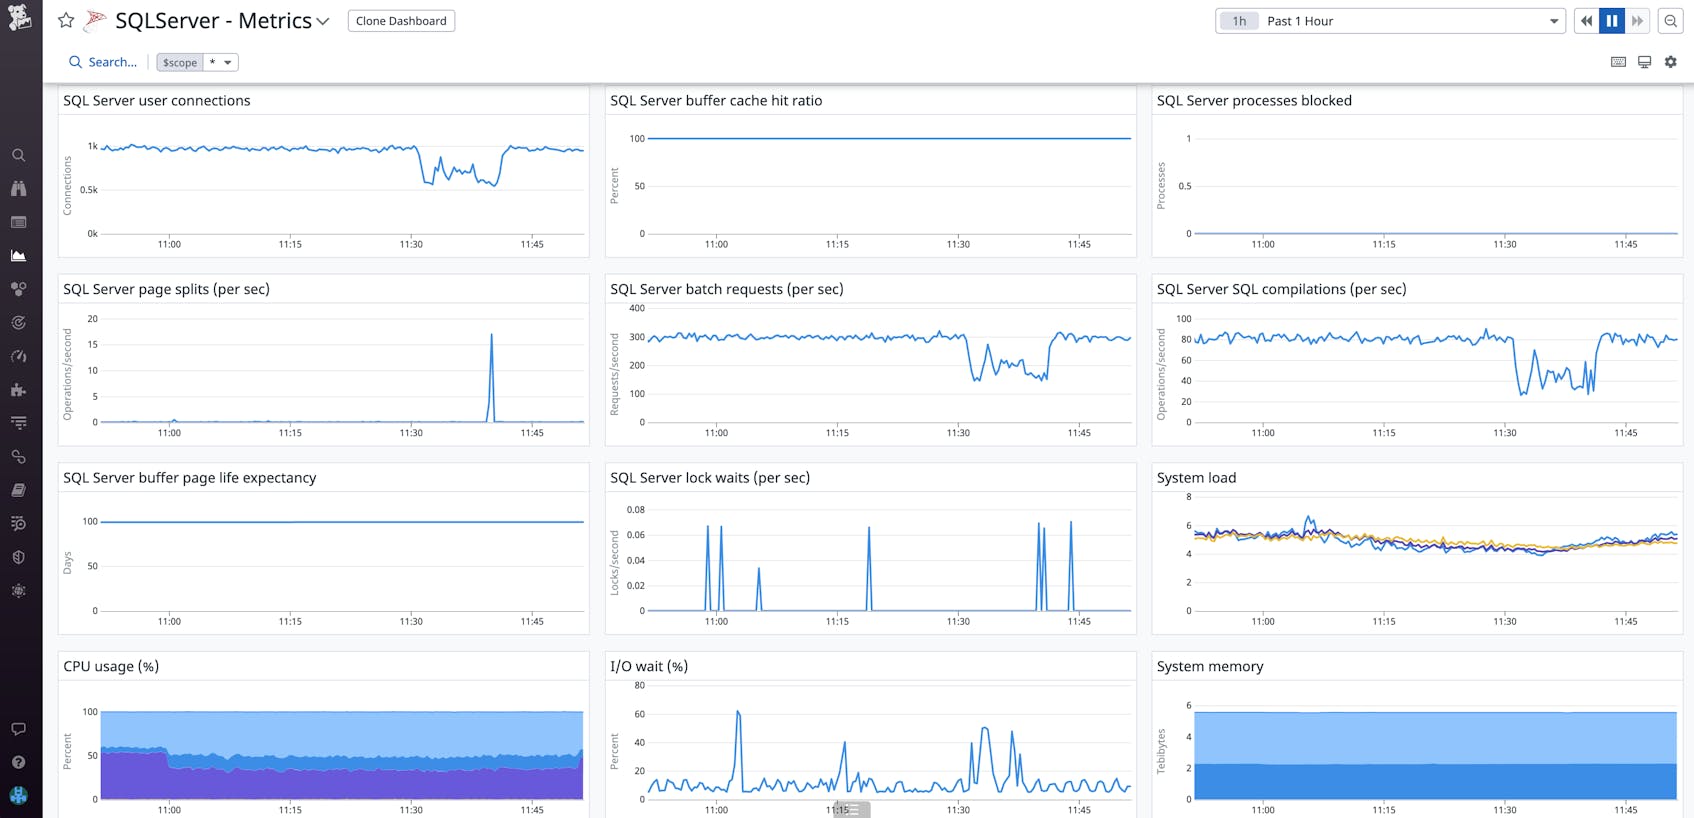
In addition to the query-level insights you get with DBM, our SQL Server integration provides higher-level visibility into your database’s health and performance. The out-of-the-box dashboard (shown below) helps you visualize metrics such as connections, system memory, and throughput. From here, you can quickly pivot to DBM to get deeper insight (e.g., by looking at queries running on hosts that exhibit high resource utilization).
Full visibility into your Azure managed databases
Azure Database for MySQL and PostgreSQL are fully managed database services that feature built-in security controls, automated maintenance, and a wide range of additional platform features. By monitoring your Azure managed databases with Datadog DBM, you can troubleshoot inefficient queries and errors to ensure that your databases continue to run smoothly.
DBM provides deep insights into your managed PostgreSQL and MySQL databases, enabling you to build and scale your workloads with confidence. Using DBM in conjunction with our Azure integration, you can use out-of-the-box dashboards to visualize each database’s storage and resource metrics (as shown below) and pivot to DBM to dive deeper into query-level performance.
Expanded ecosystem support for database monitoring
Whether you’re using Azure’s managed offerings to scale hundreds of databases, running self-hosted databases on Azure, or just beginning to migrate your workloads to the cloud, DBM gives you around-the-clock visibility into your databases’ health and performance, so you can keep your systems healthy. To start monitoring your SQL Server and Azure managed databases with Datadog, check out our documentation. If you aren’t already a Datadog customer, sign up today for a free 14-day trial.


