Pierre-Yves Bigourdan
The use of code profiling to troubleshoot application performance can appear daunting to the uninitiated, and many software engineers even assume that this domain is reserved for niche specialists. But here at Datadog, one of the key goals for our Continuous Profiler product has been to take this seemingly intimidating practice of code profiling and make it more accessible to engineers at all levels.
One area of improvement we are particularly focused on is making visualizations more intuitive. For example, even though flame graphs are a common way to visualize profiling data in the industry, we have seen that engineers who investigate them often get blocked in their troubleshooting journeys. This happens for a number of reasons. First, it’s challenging for many to figure out what the cells in flame graphs represent. But even when users understand that each cell maps to an element in the call stack and that a cell’s relative width corresponds to resource usage, the format used to identify code can still be hard to interpret. And then, once users spot a particular cell that reveals a performance issue, it’s tedious to switch contexts and connect that cell back to any particular block of source code to review.
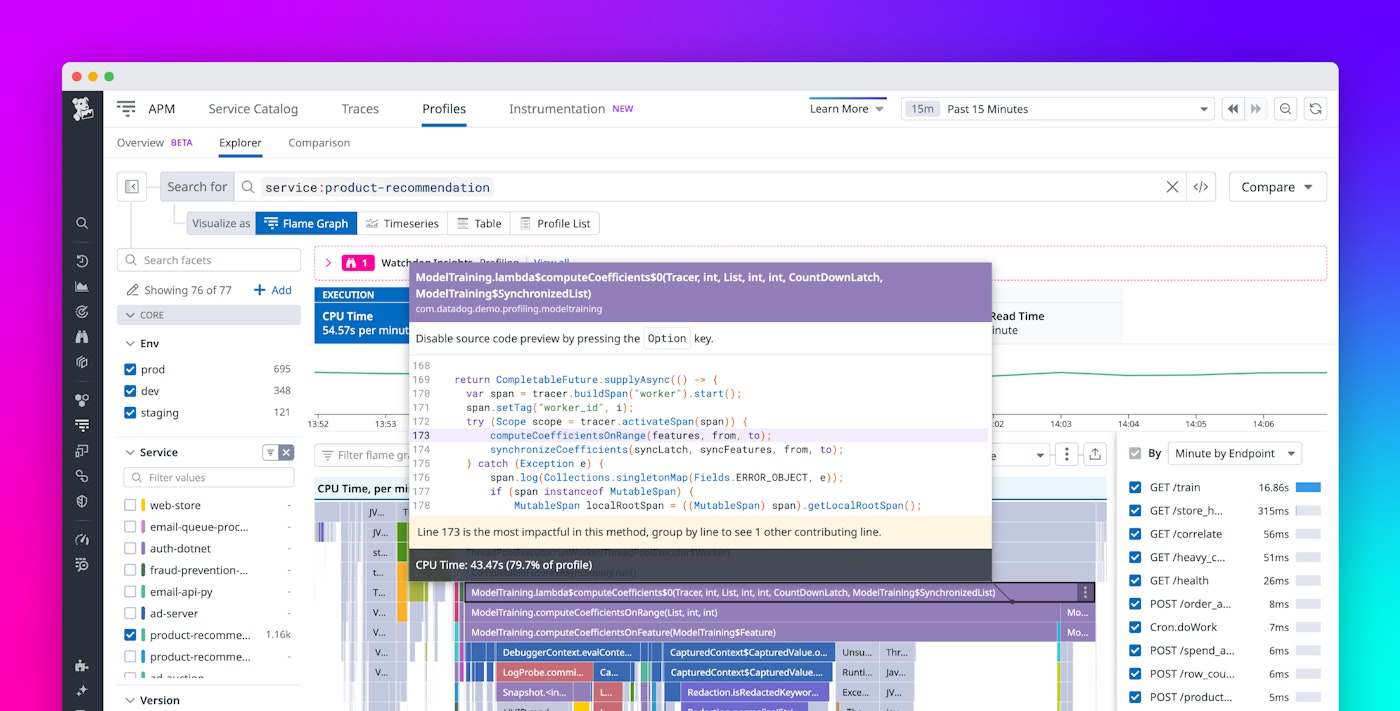
To help address this problem and make it easier for engineers to connect flame graphs to their next troubleshooting steps, we are introducing source code previews in Continuous Profiler. This feature contextualizes profiling data by linking individual cells in flame graphs to information that software engineers can immediately recognize and relate to—the source code of their applications.
Enabling source code previews
To begin to enable source code previews, you first need to set up Datadog’s source code integration, which allows you to connect your telemetry with your Git repositories. To do so, either follow the language-specific instructions to associate the repository and hash for the build artifacts, or use our in-app setup page to guide you through the installation steps.
Viewing source code previews
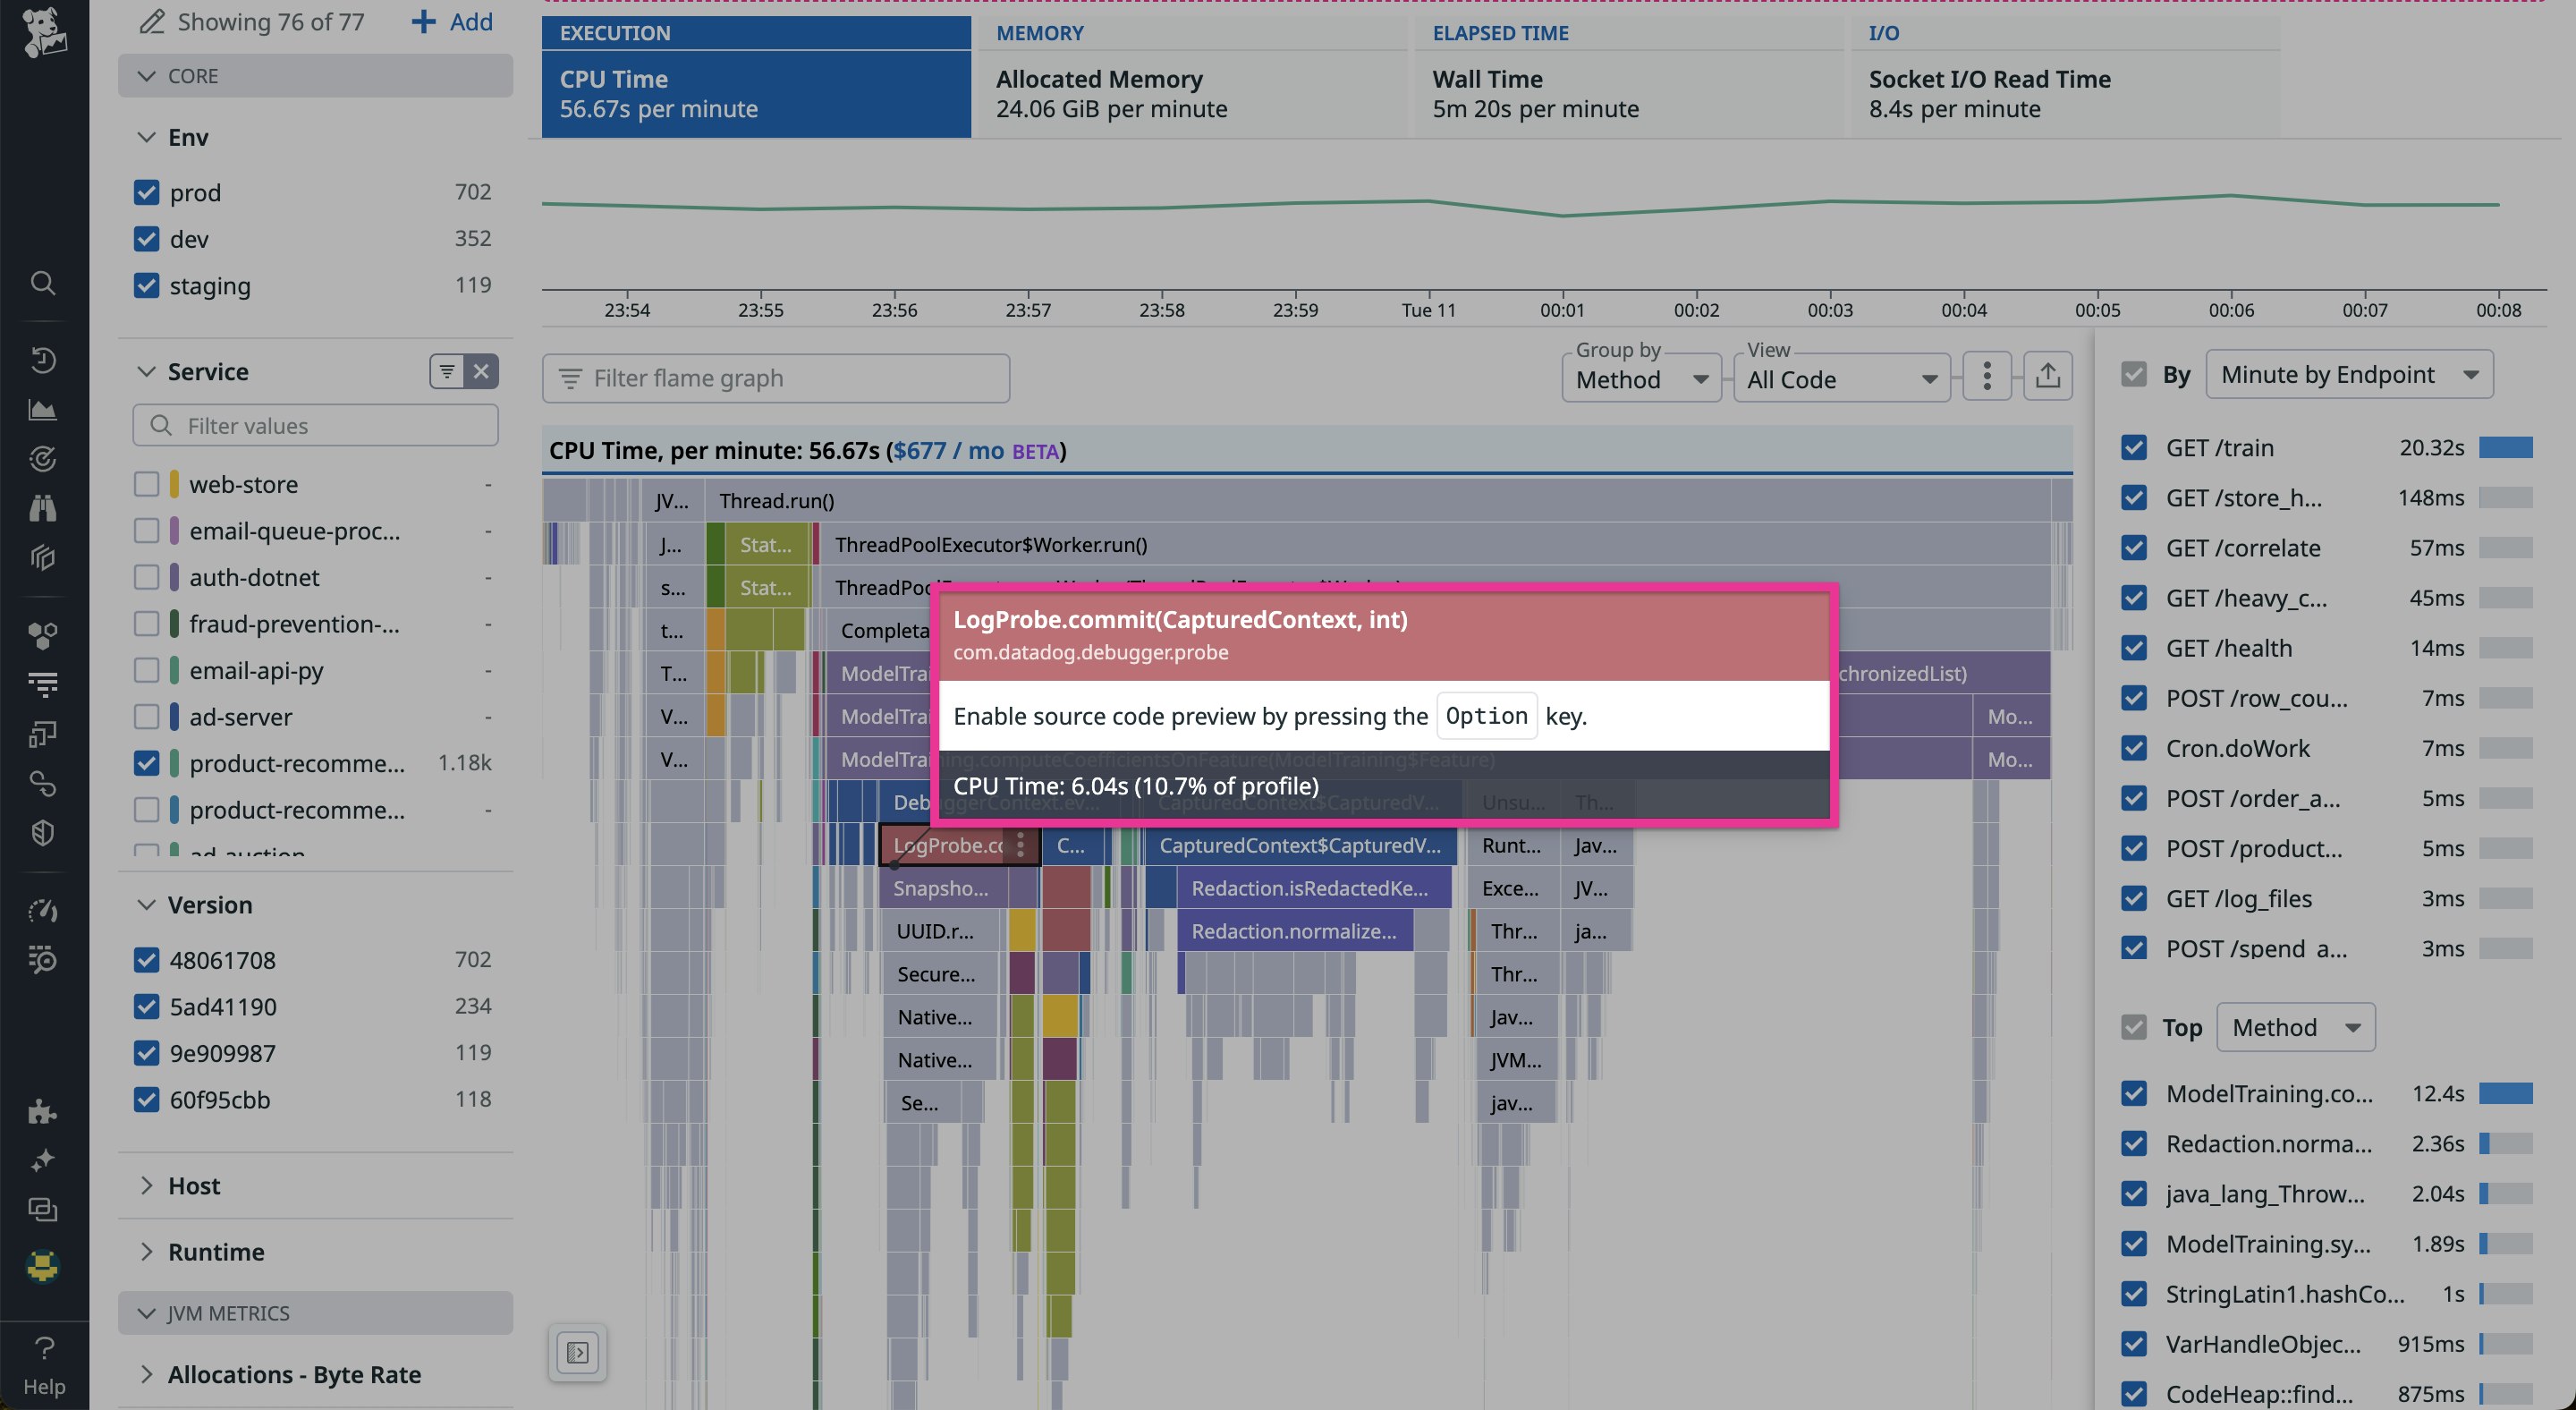
Once you have set up Datadog’s code integration, hover over a flame graph cell within a profile. If prompted to do so in the tooltip (as shown in the example below), press the Option key (or the Alt key in Windows) to enable the source code preview feature.

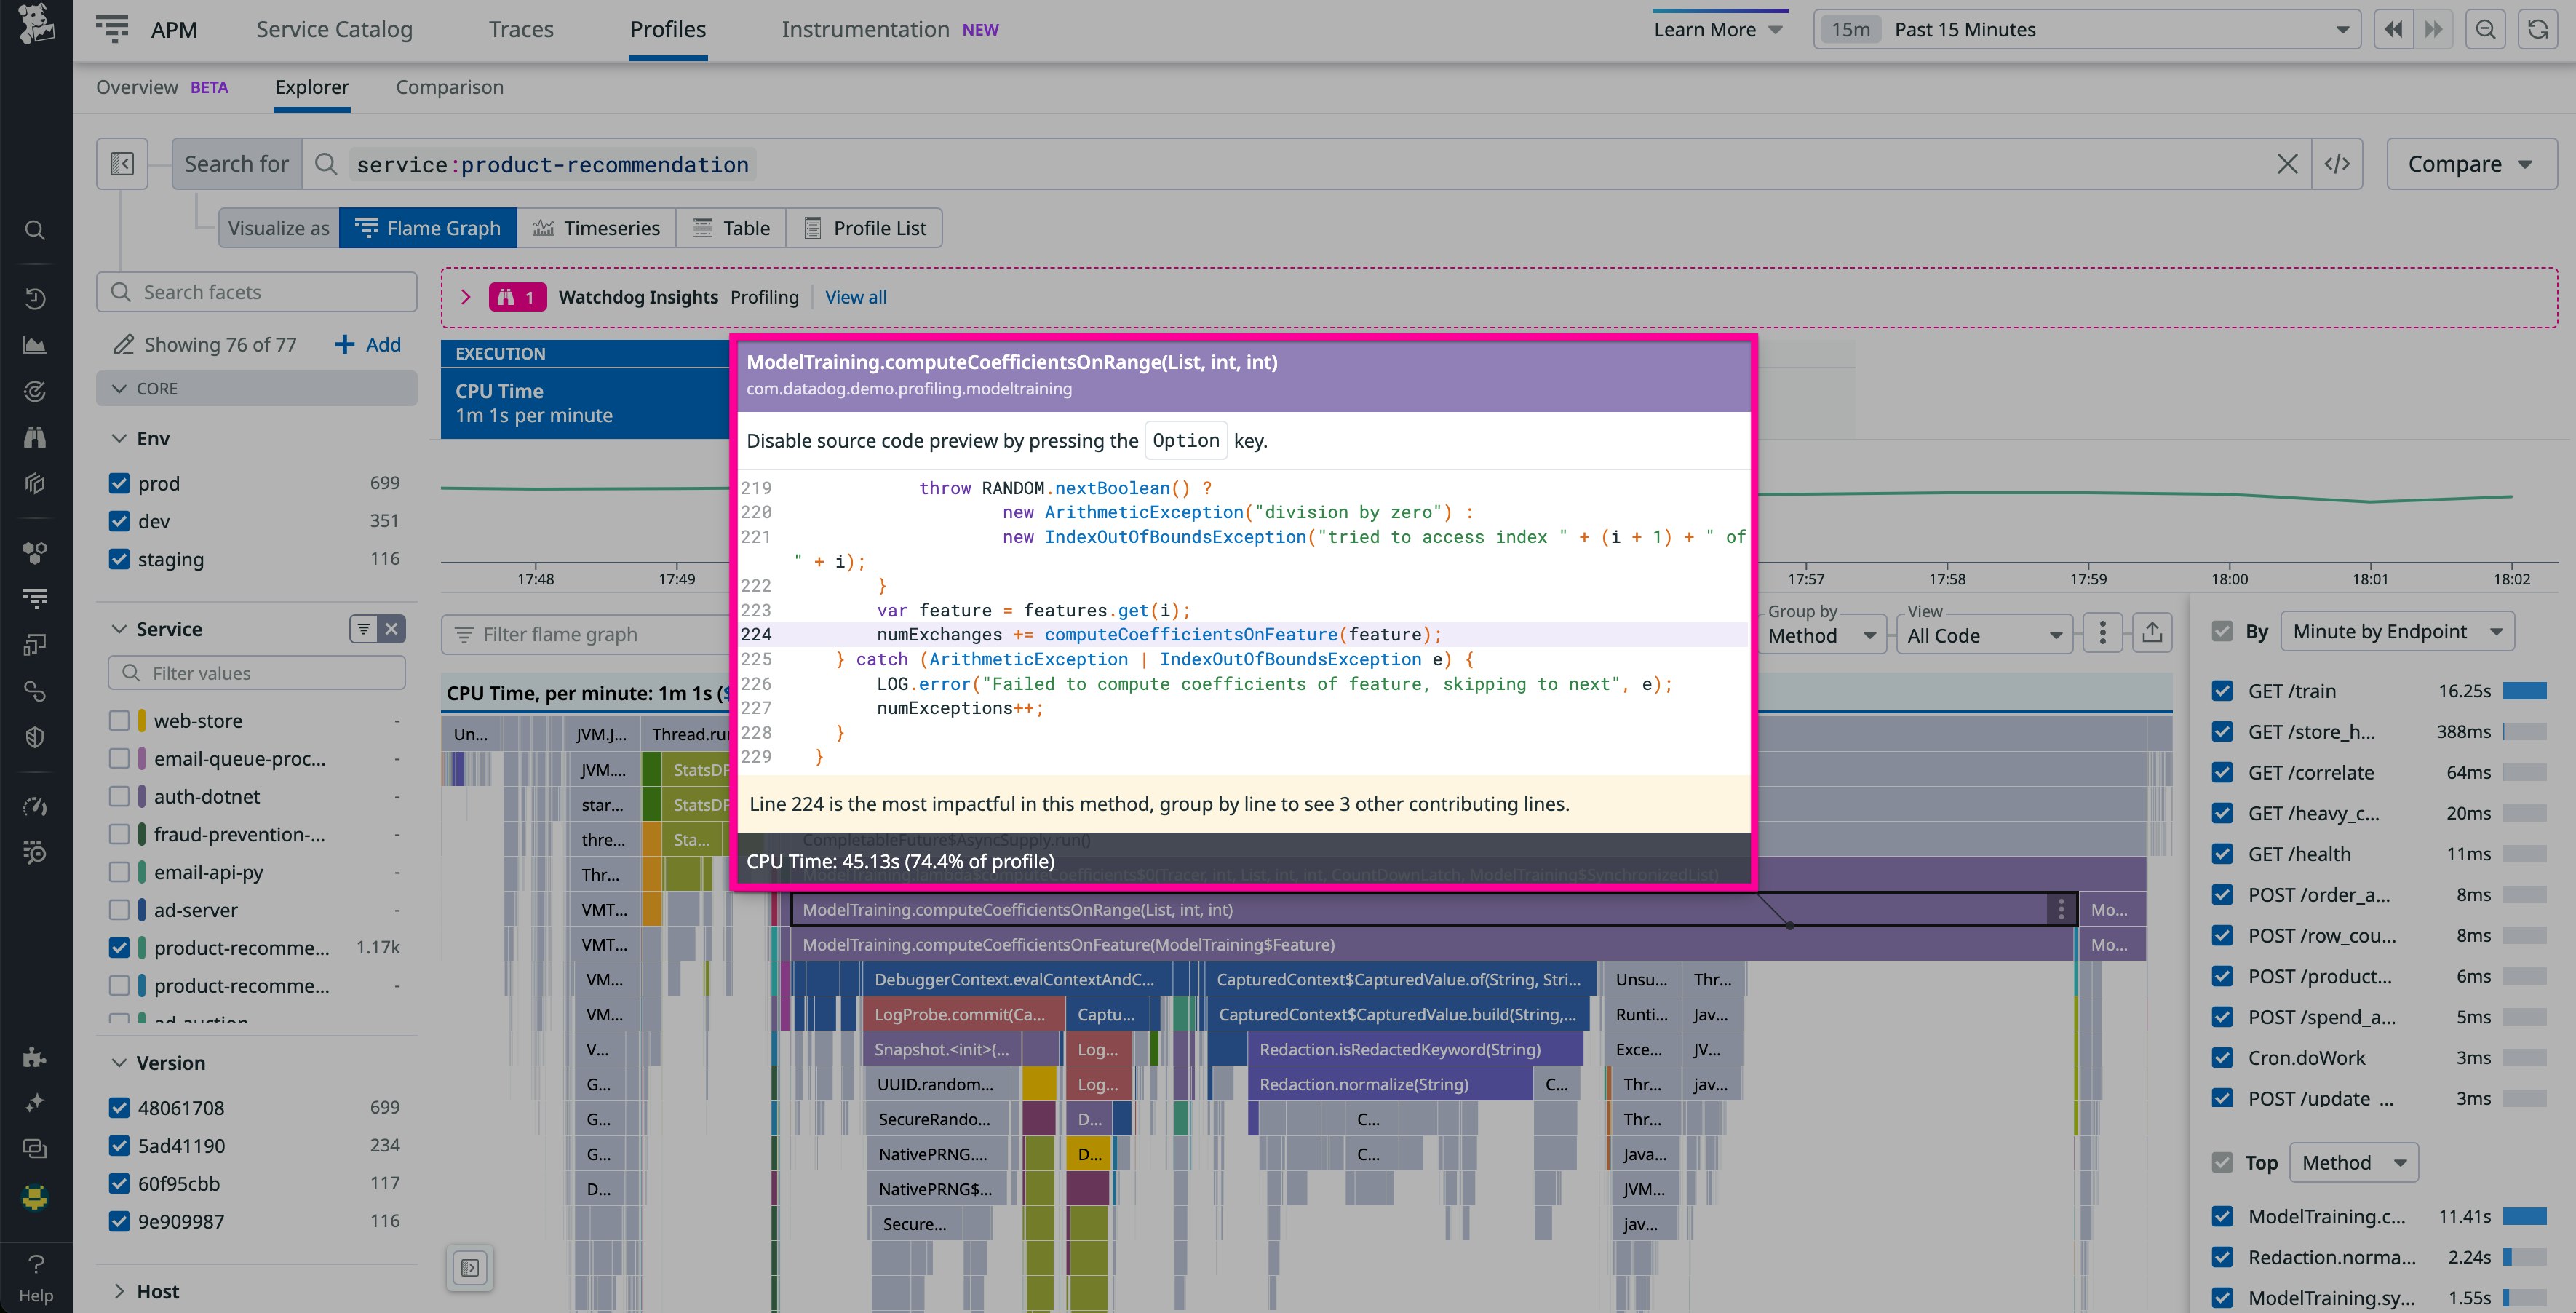
Once the feature is enabled, hovering over a cell will reveal the associated code.

Grouping by line for more granular insights
By default, each cell in the flame graph corresponds to a method, and the code preview highlights the most impactful line in the method. If you want more granular information about the impact of individual lines of code, you can switch the Group by value from Method to Line. This will display the most impactful lines of code as individual cells, and the code preview will highlight the code surrounding that line.
Troubleshoot code performance more efficiently with source code previews
Source code previews are available for services written in Java, Python, Node.js, Go, Ruby, and .NET. We plan to keep enhancing the capabilities of code previews to make your troubleshooting journeys easier, so look out for new features such as support for third-party libraries, the ability to interact with and scroll through code previews, and more.
For more information about our Continuous Profiler product, check out our product documentation. And if you’re not yet a Datadog customer, feel free to sign up for a 14-day free trial to get started.


