Thomas Sobolik
Your applications are only as powerful as they are iterable. To keep up with their rapidly changing production environments, your teams need reliable CI/CD systems that implement best practices—including build and test automation, flaky test management, and deployment management. By optimizing their CI/CD pipelines, your teams can build their apps more efficiently, deploy them more safely, and catch bugs and security vulnerabilities before they make it to production. And likewise, by monitoring quality and security issues in your code, your teams can avoid shipping regressions like security exposures or runtime errors.
To help you evaluate your applications’ CI/CD health and code quality alongside the rest of your observability data, Datadog’s Software Catalog integrates with CI Visibility and Code Security. CI Visibility helps you monitor your CI/CD pipelines to ensure that your builds, tests, and deployments are running as smoothly as possible, while Code Security surfaces warnings to help you characterize the quality and security of your code and quickly find fixes.
In this post, we’ll show how you can use these features with the Software Catalog to correlate dispersed information about your services’ performance, availability, and security posture with telemetry from your code and CI pipelines—forming a clearer picture of your services’ health.
Investigate your services’ code
Datadog Software Catalog provides a consolidated view of your applications, collating ownership metadata, performance insights, security analysis, cost allocation, and much more. By eliminating the silos between all these sources, Datadog Software Catalog makes it easier to correlate issues and characterize your services’ overall health.
Software Catalog’s Delivery tab adds shift-left observability to this broader picture. You can filter services by facets such as environment, team, or cloud region in the Delivery tab to get quick insights into your services’ production code quality and pipeline efficiency. This way, if you’ve discovered issues with the health, performance, or security posture of your services in production, you can quickly dive into related code analysis results and CI telemetry to spot where regressions or errors may have been introduced.
By using the Delivery tab, you can filter to your source code and find services with unaddressed code issues, then pivot to Code Security to investigate further. For example, the following screenshot shows that a service in the dev environment called ad-server has nine moderately severe violations on its repository’s default branch. You can hover over its violations to see details about their type and severity.
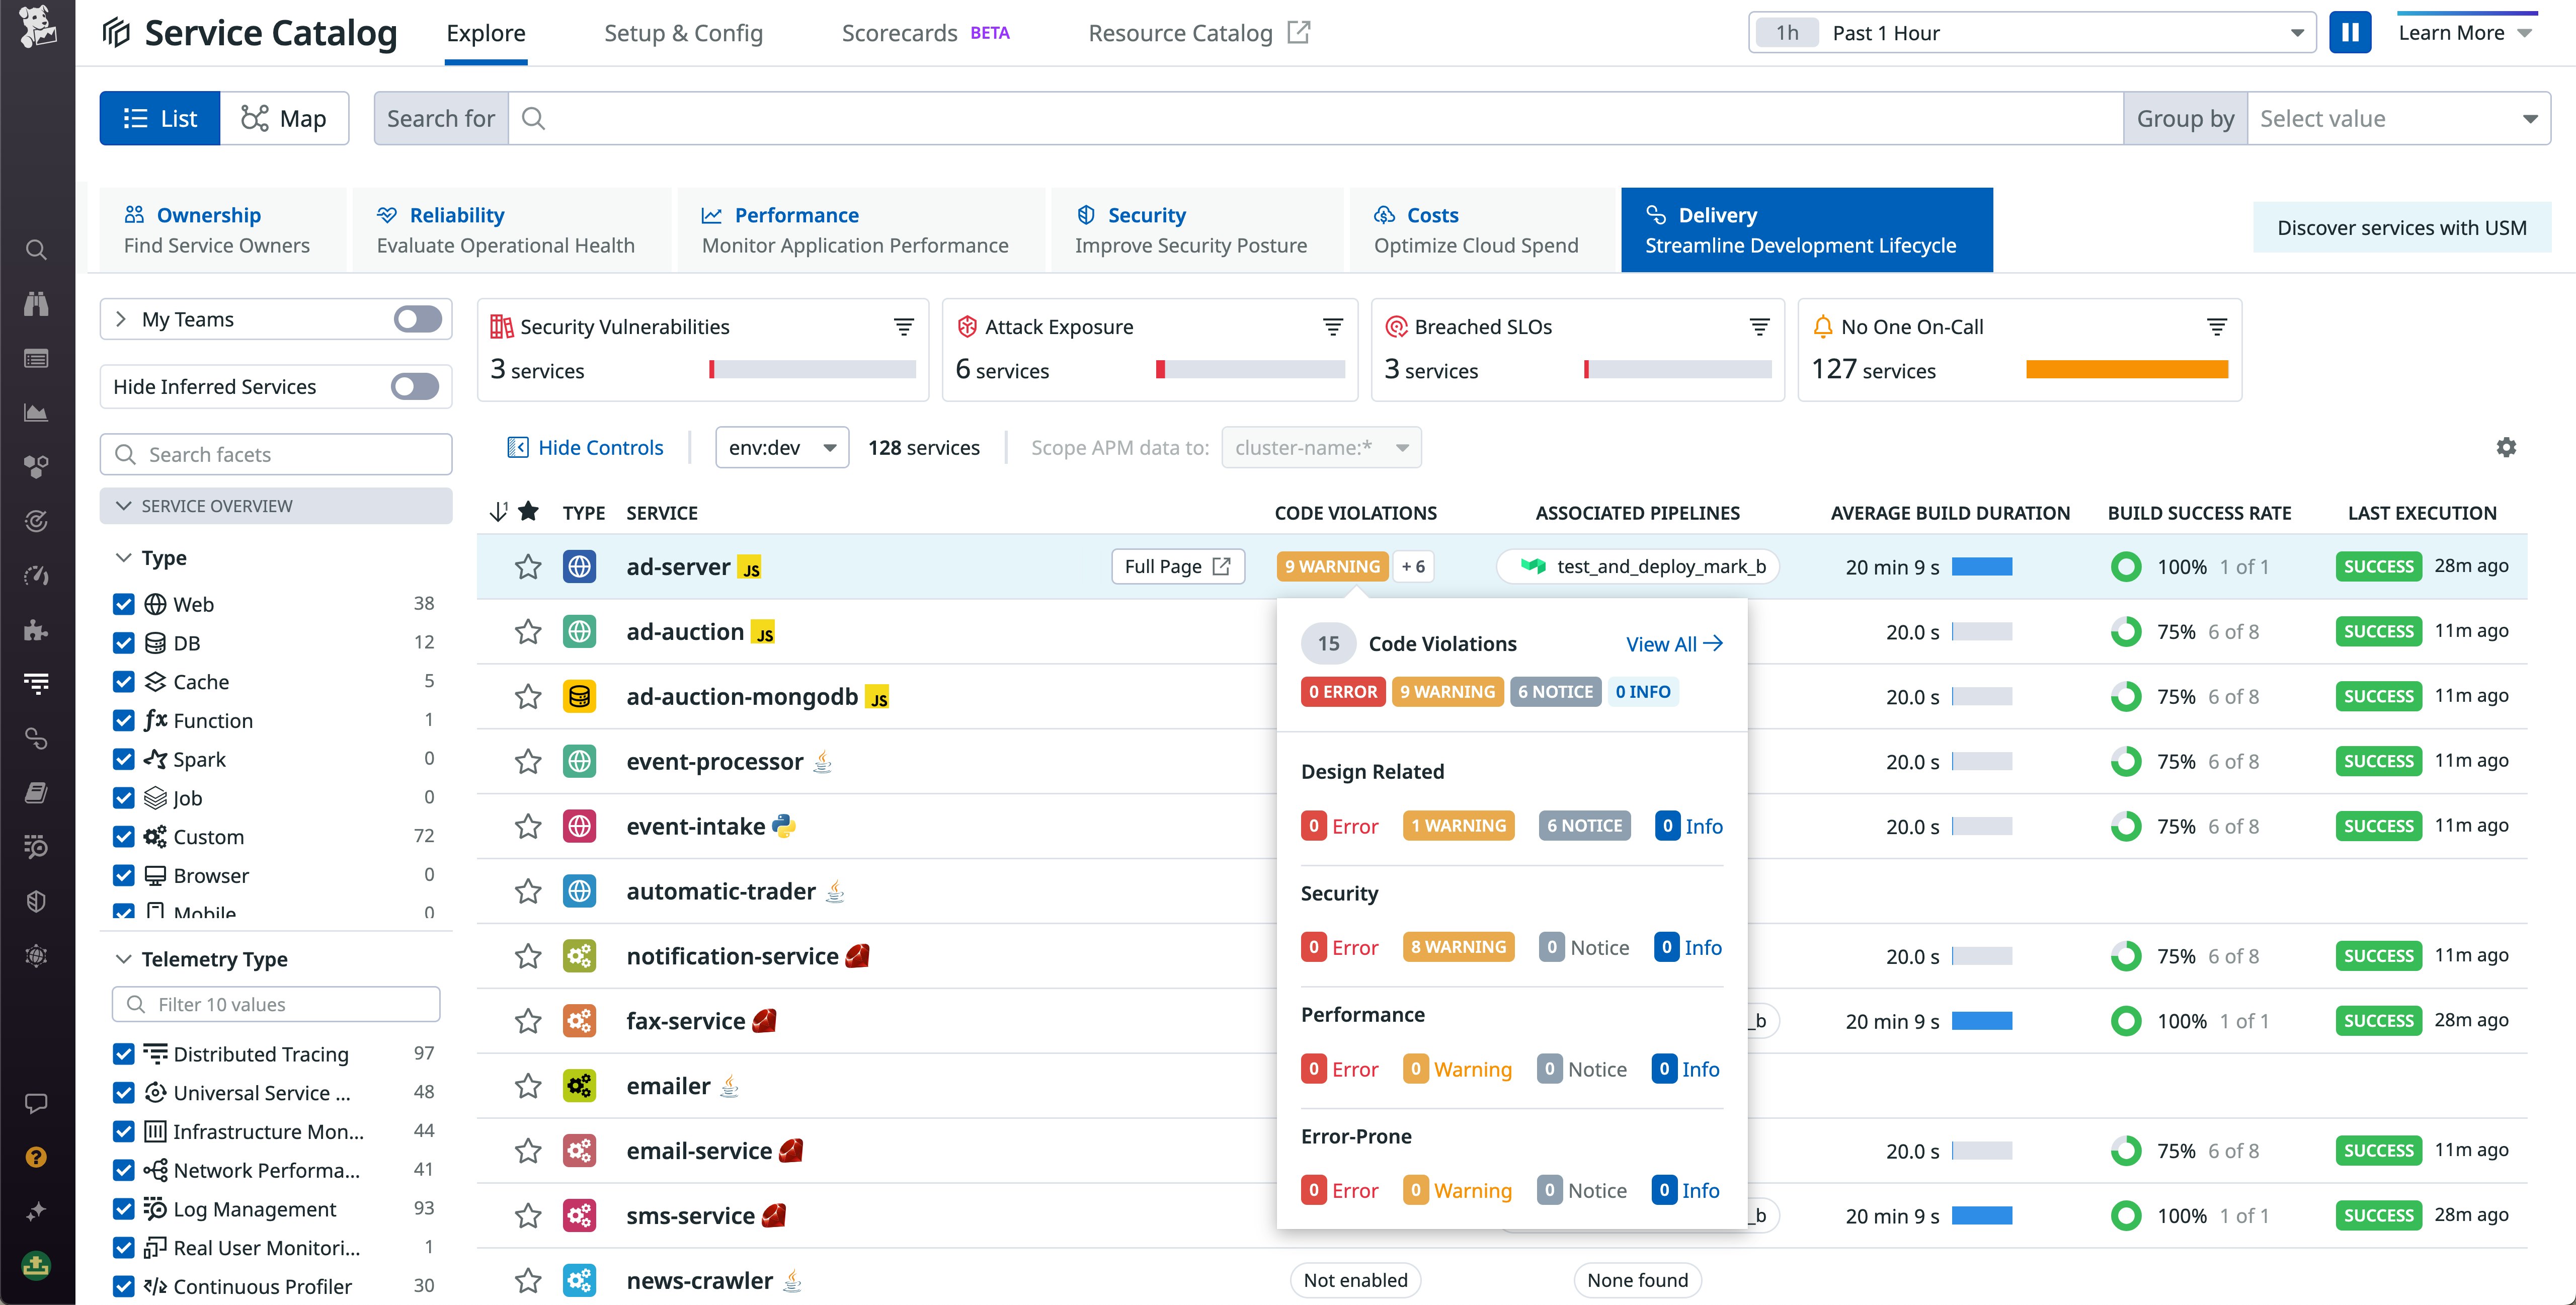
You can click the “View All” link and pivot directly to the violations for this service in Code Security. Then, you can investigate each one by viewing the offending code snippet and a description of the issue, identifying the relevant Git commit in order to contact the code owner, and even reviewing a fix suggestion that could solve the problem. Code Security includes both a library of default suggested fixes created by Datadog, as well as AI-generated ones that can help tackle more complex issues.
You can use Code Security to identify issues that are already in your production code, or issues that are on feature branches that will put your production code at risk if they are not fixed before deploying to production. For example, the following screenshot shows a snippet of code that introduced a SQL injection vulnerability. By patching this issue before deploying your code to production, you can ensure that malicious actors won’t be able to access sensitive data or perform unauthorized actions with arbitrary SQL queries.
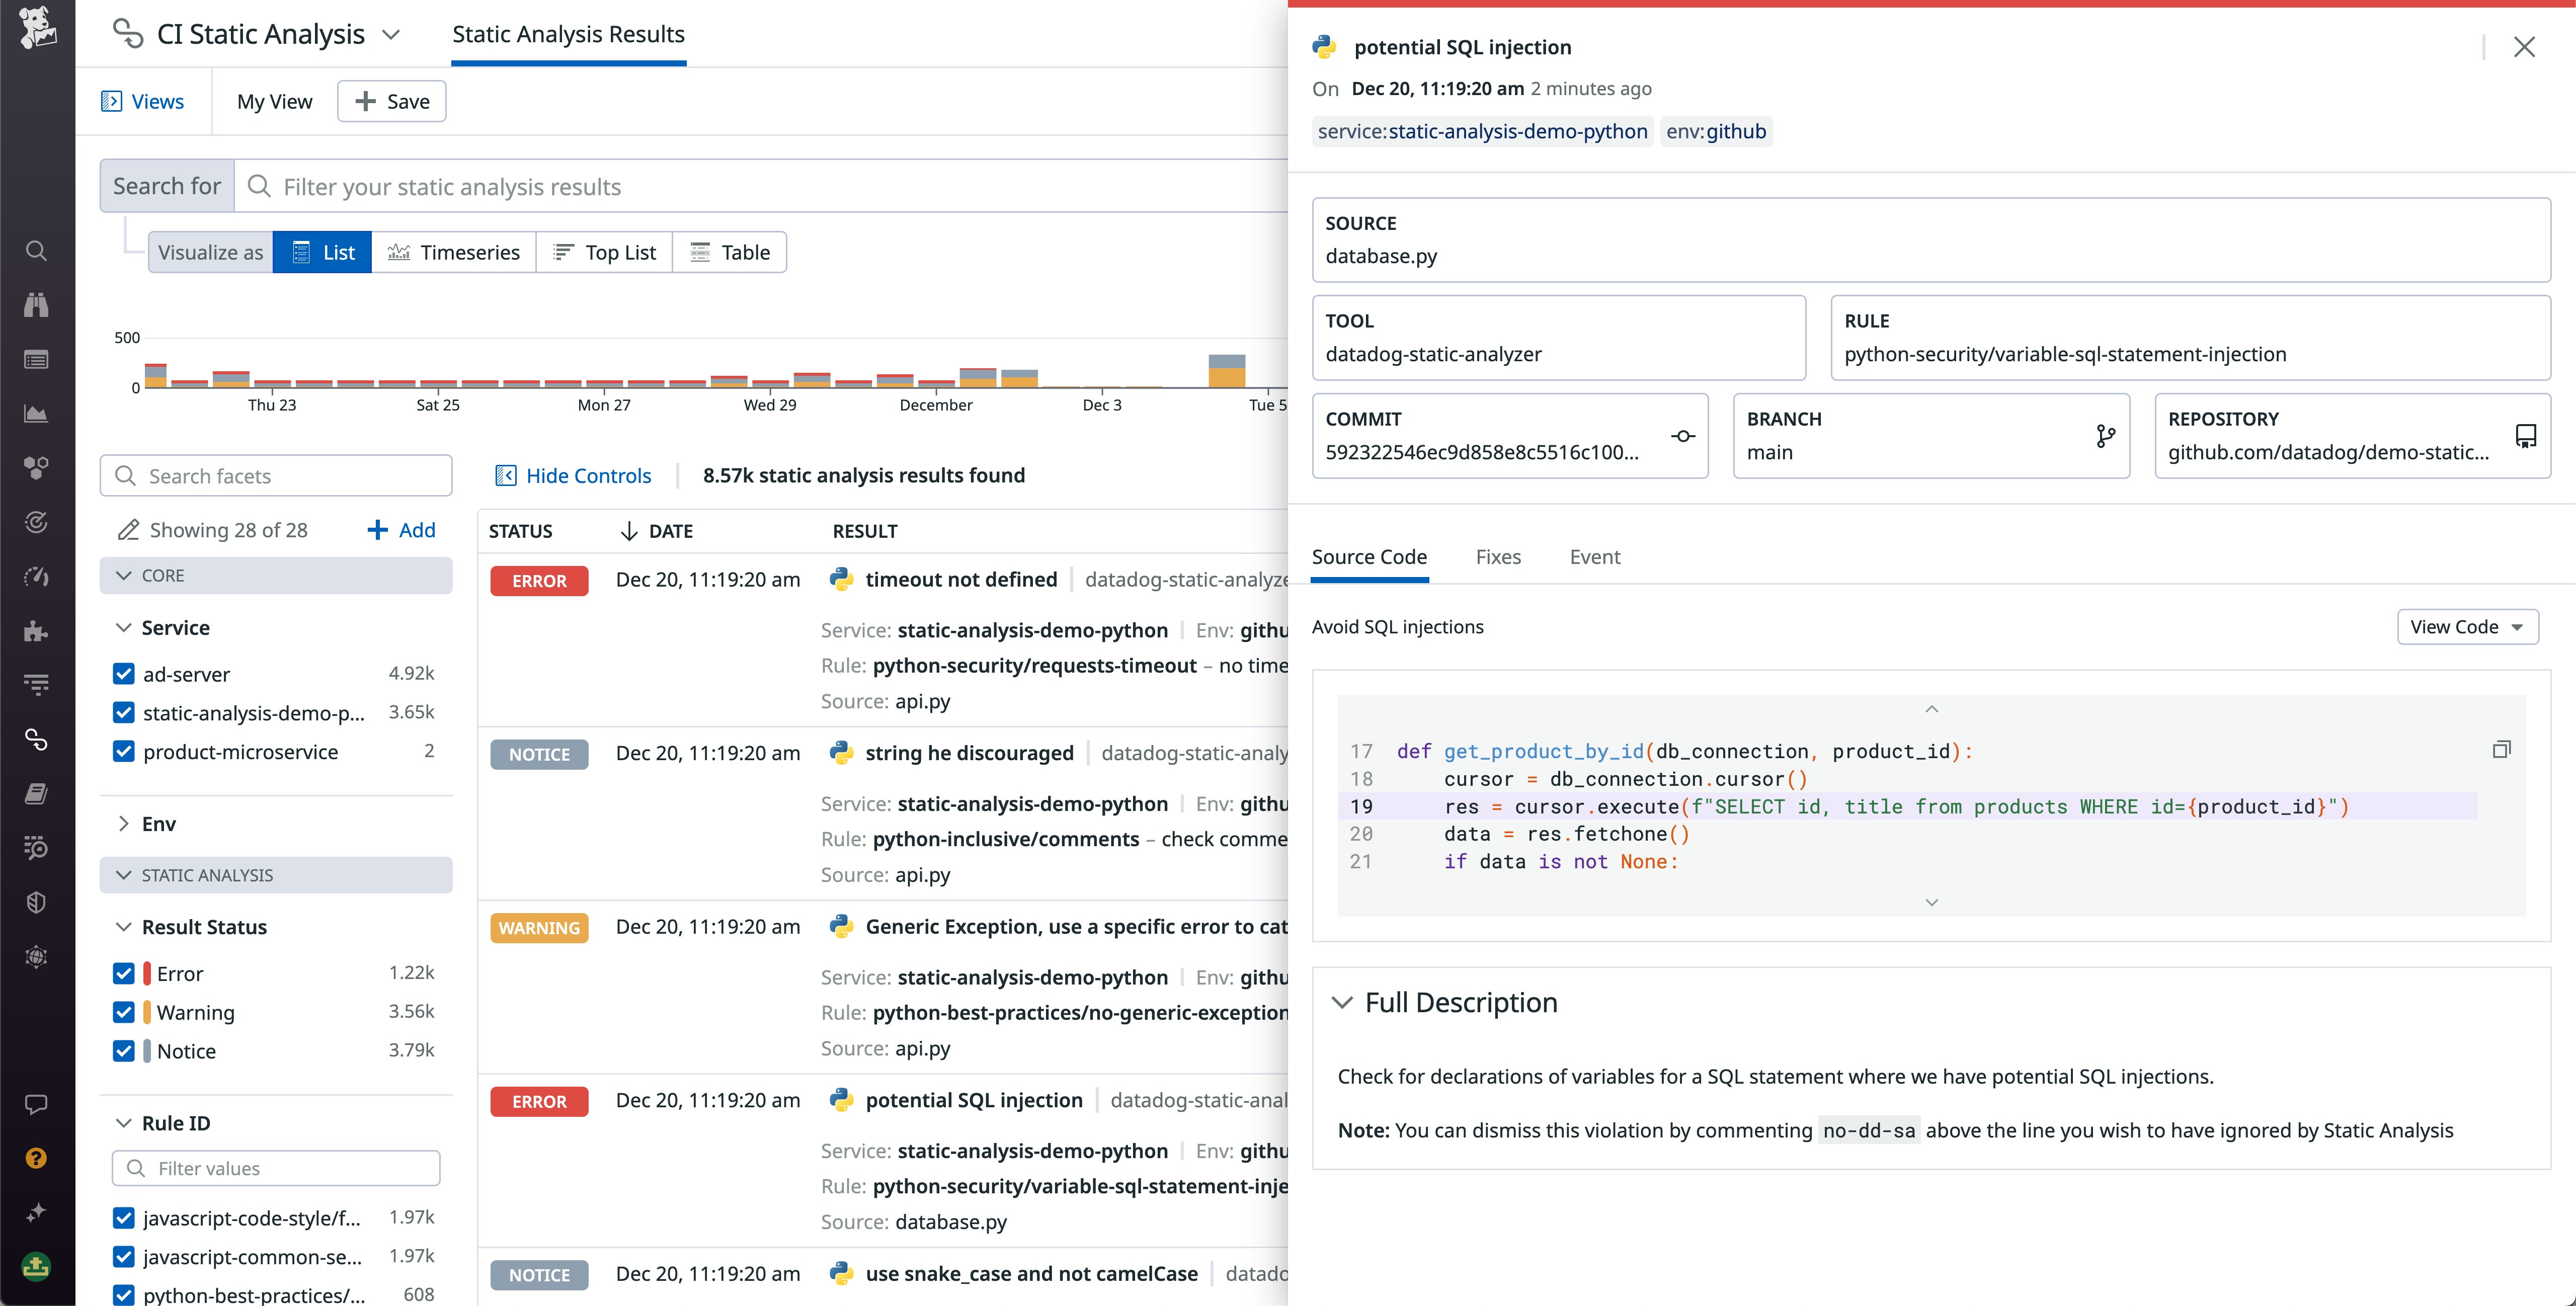
Code Security provides you with a list view to search for issues on any commit in any branch so you can find issues in both pre-production and production. To help your engineers catch and fix issues as early as possible, Datadog also provides integrations for VS Code and JetBrains that allow engineers to identify issues in real time as they write code.
Track the health of your services’ CI pipelines
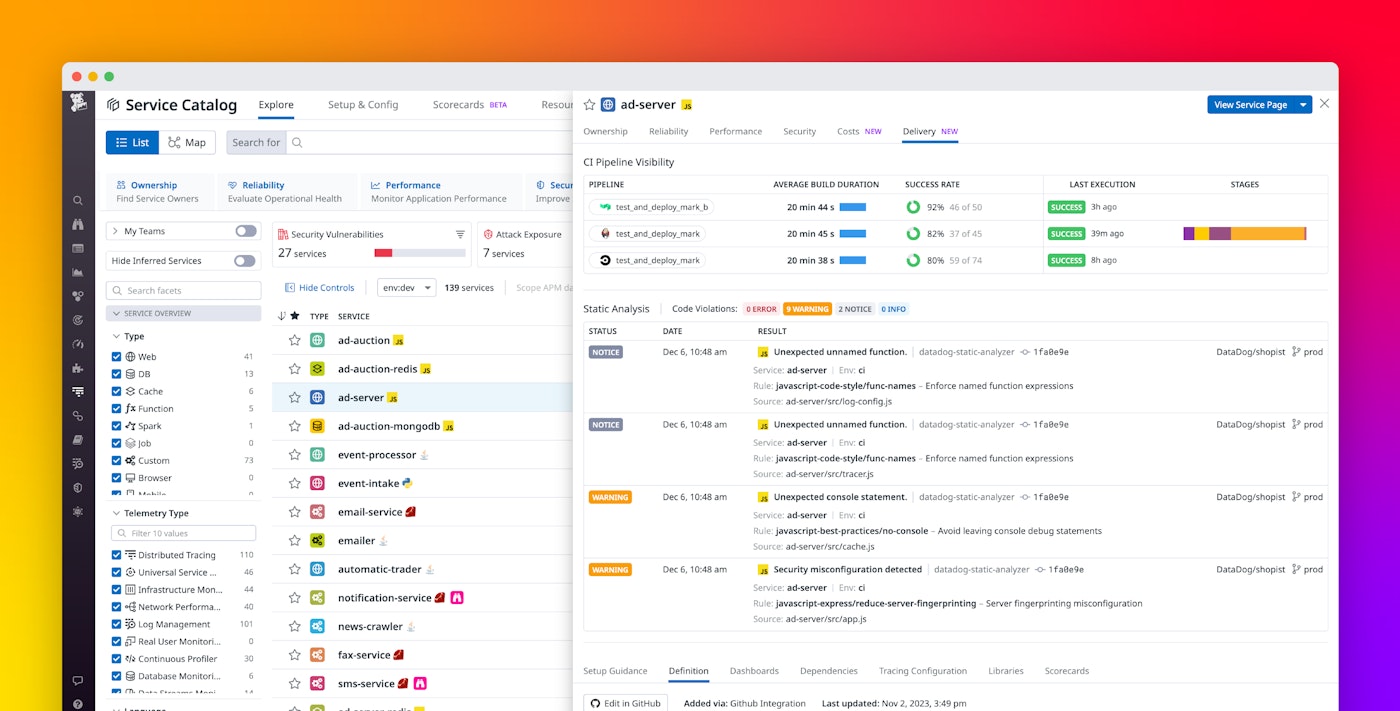
By surfacing key metrics for your services’ associated CI pipelines, Datadog’s Software Catalog helps you spot when services’ builds are experiencing friction caused by issues like flaky tests or long-running jobs. The Delivery tab side panel provides the average build duration, success rate, and most recent execution status for each pipeline associated with a service. For example, the following screenshot shows that two of the pipelines associated with the ad-server service recently failed, and that the average build duration is relatively high across all pipelines.
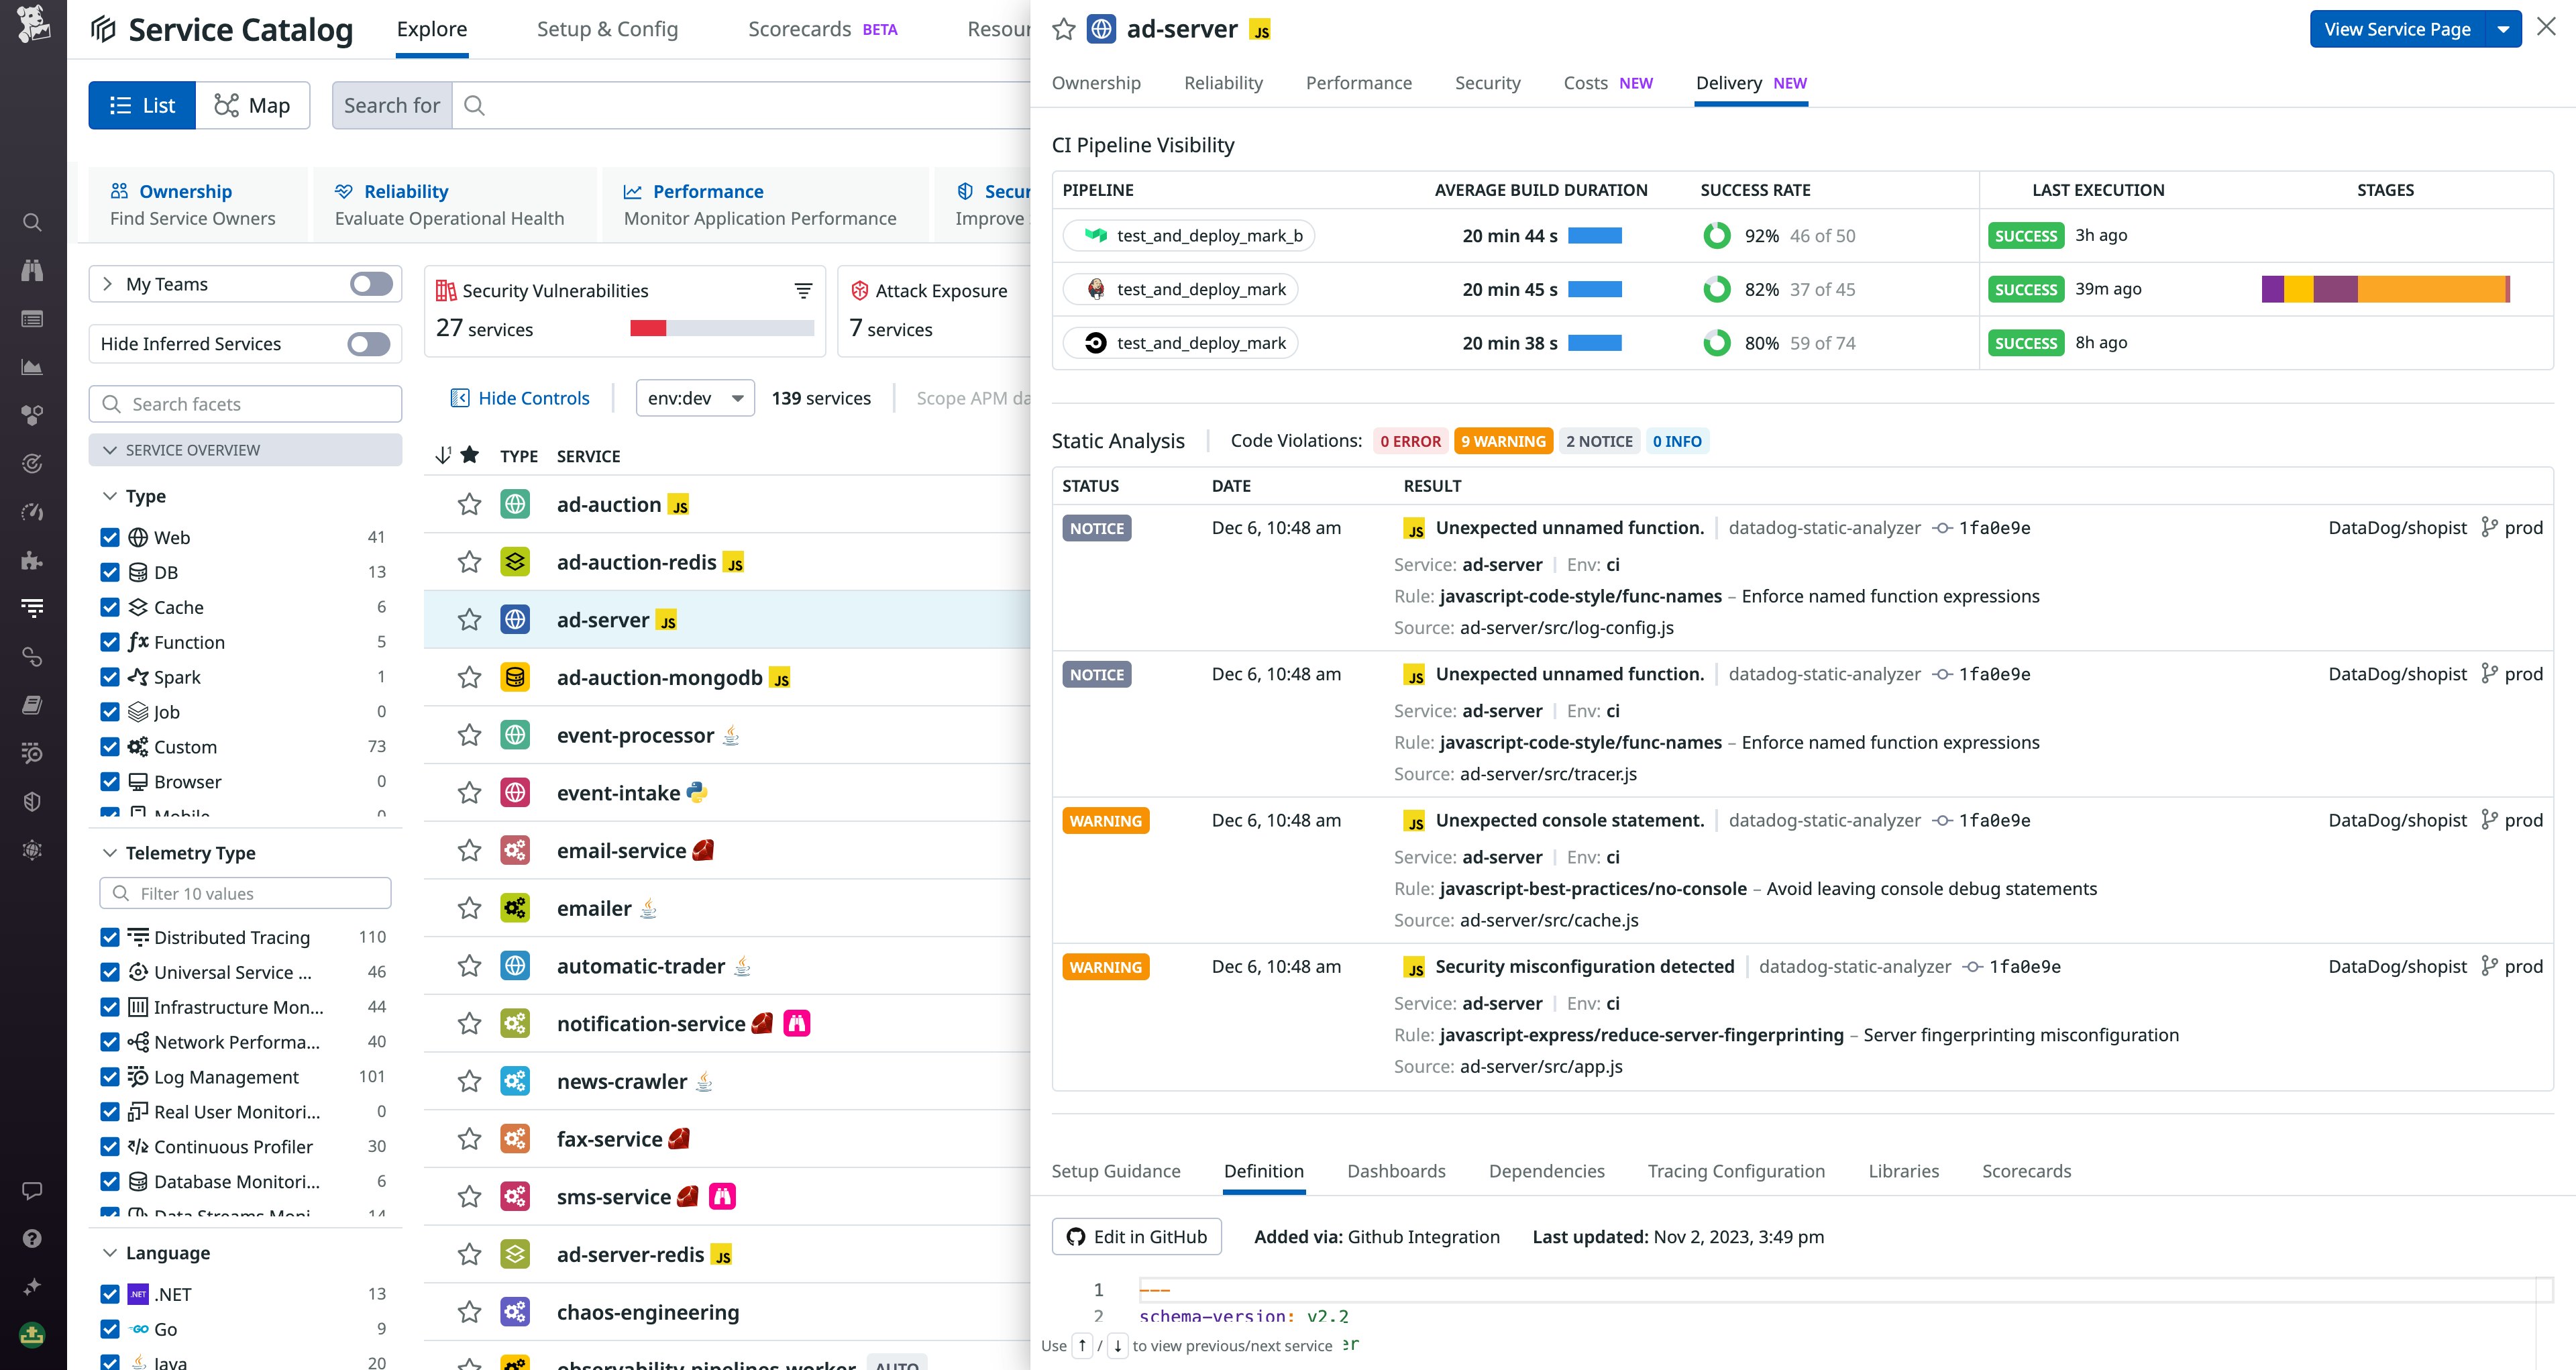
In the same way as you can for Code Security, you can quickly pivot from the Software Catalog to CI Visibility to further investigate issues with your builds. By opening an errored pipeline in CI Visibility, you can examine traces for all of its executions and spot errors that may be causing them to fail.
For example, the following screenshot shows that the ad-server service’s test-and-deploy pipeline has a failed test that stopped the pipeline. The trace span’s included metadata and logs can point you to the engineer who triggered the build and provide more details about the root cause.
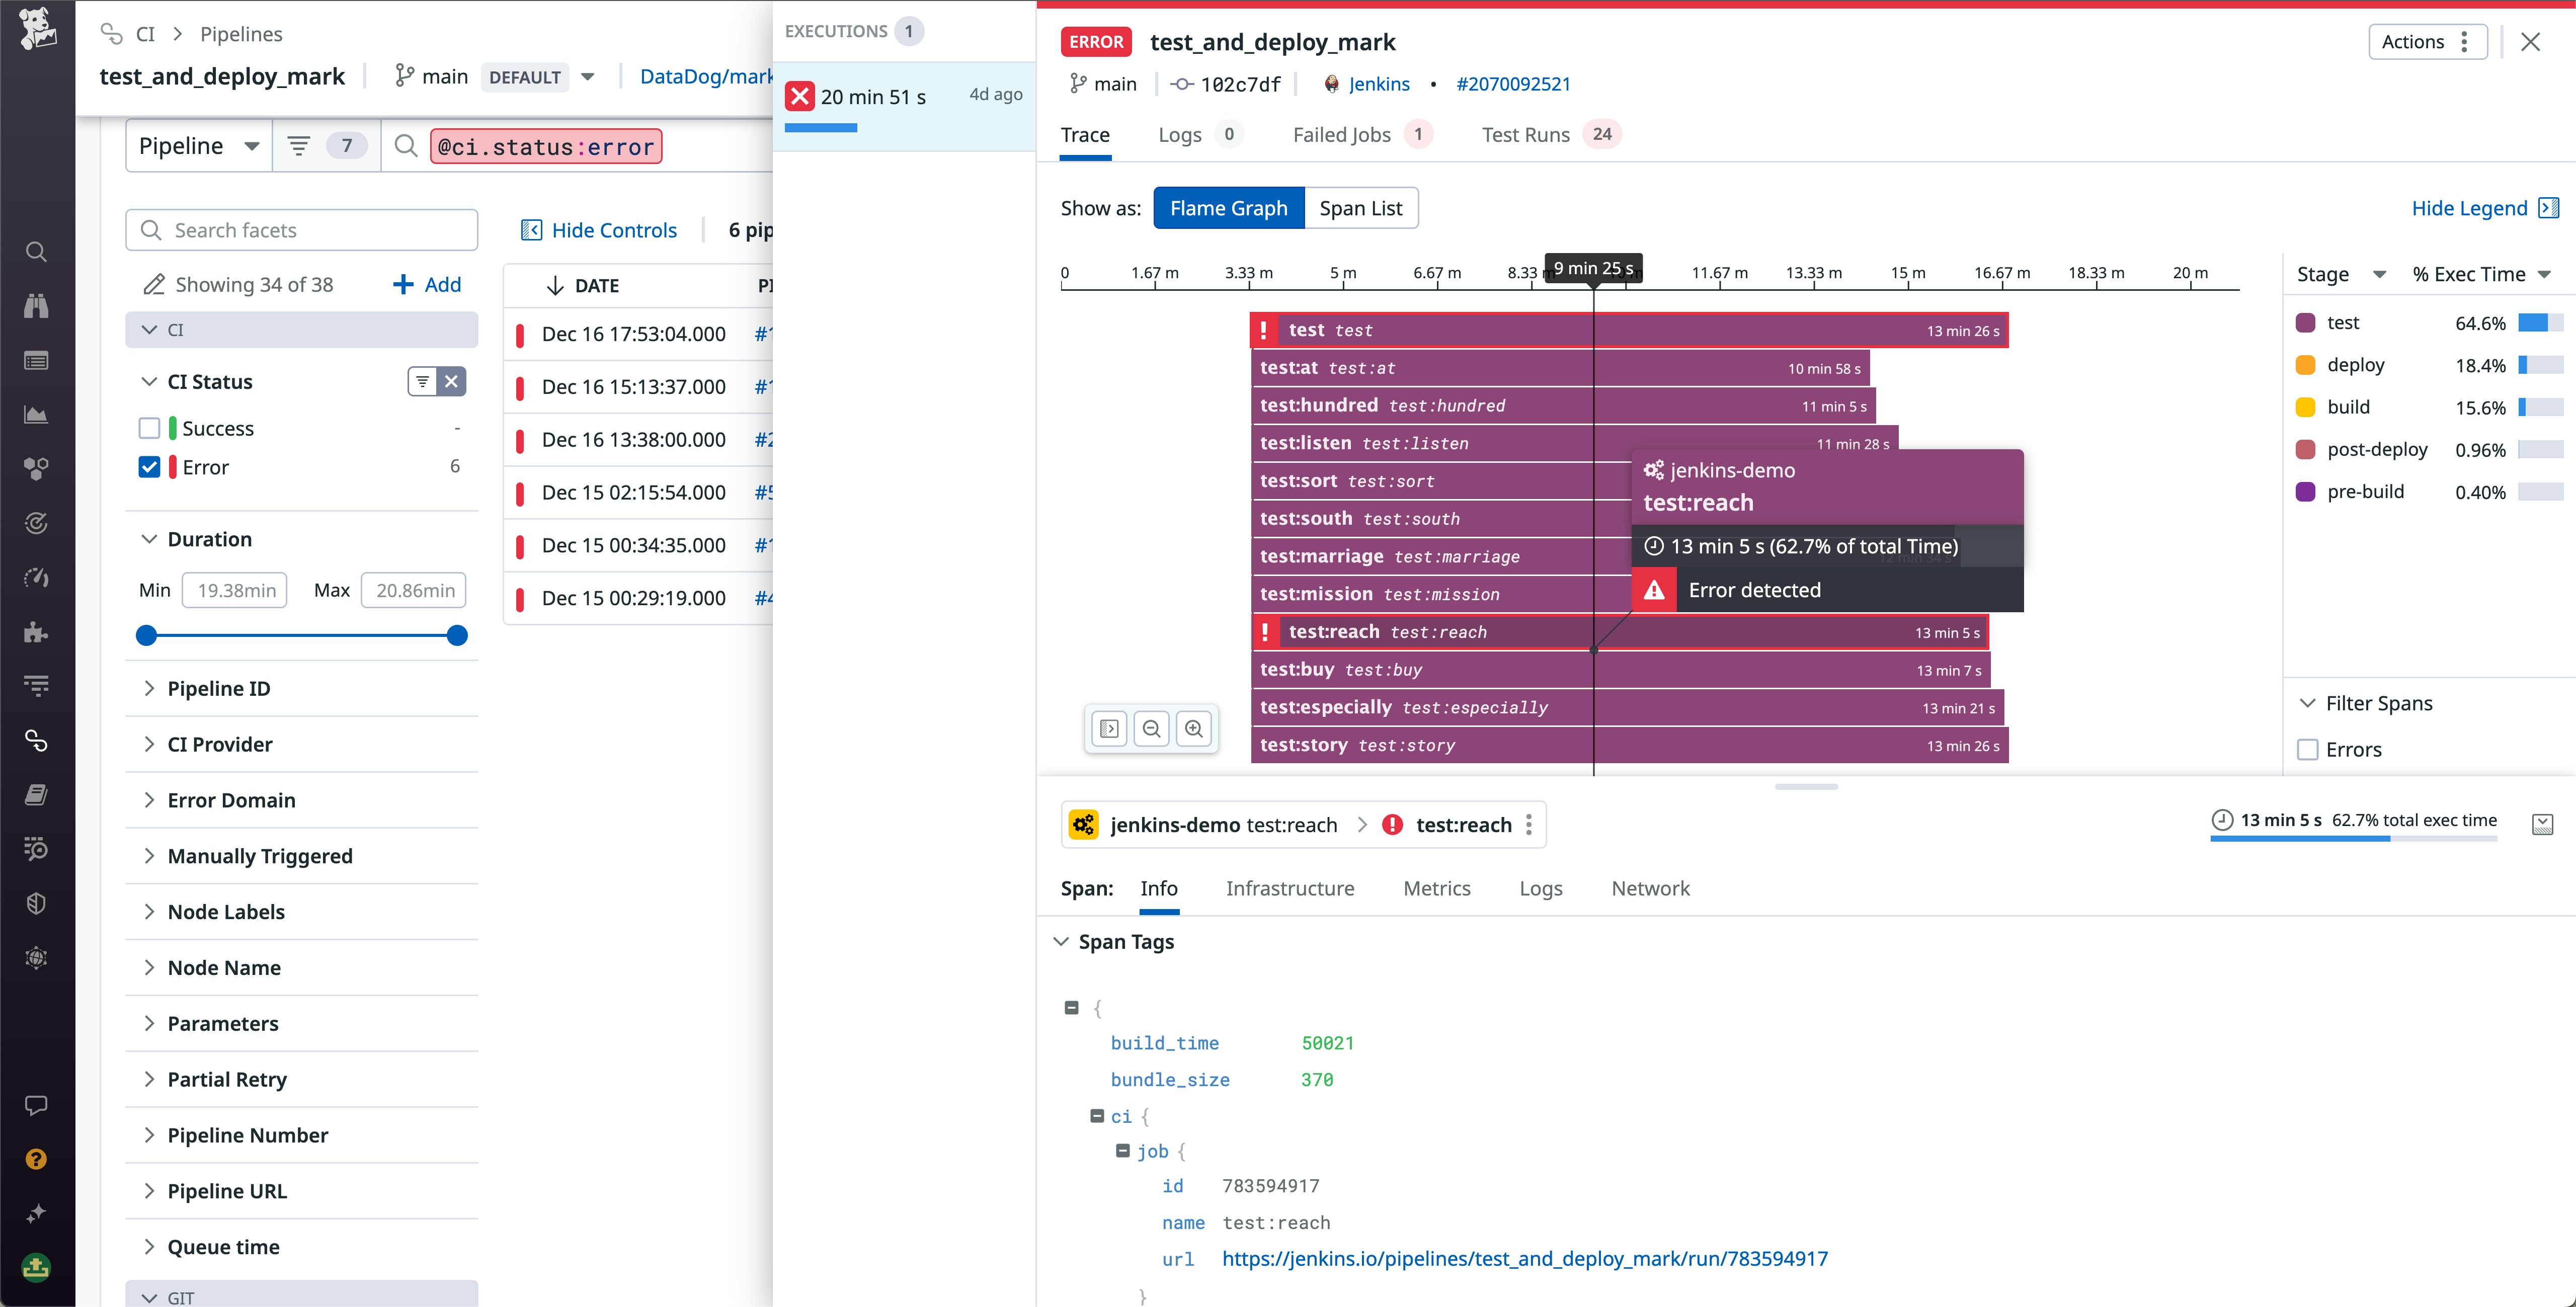
Now that you’ve identified that a test failure caused your build to fail, you can dive into the Test Runs page to learn more about this pipeline’s tests and spot flaky ones. This way, you can optimize the testing for this pipeline and prevent future failures.
Shift your service-level observability to the left
The Software Catalog provides a central hub that connects real-time application telemetry and operational context for all your services. By using the Catalog to monitor code quality and CI performance, you can more effectively evaluate your teams’ shift-left practices, and spot critical issues that may be leading to problems in your runtime environment.
To get started with Software Catalog, check out our documentation. To start seeing software delivery insights in the Catalog, you can set up Code Security and instrument your CI/CD pipelines for CI Visibility in the Datadog app. If you’re brand new to Datadog, sign up for a free trial.
