Thomas Sobolik
ServiceNow is a popular IT service management platform that helps organizations track and manage enterprise-level IT processes, such as on-prem infrastructure management, customer support, and incident response. By using ServiceNow’s configuration management database (CMDB), organizations can easily centralize and manage information about all the IT objects they own in order to track and maintain them more efficiently.
Datadog now integrates with ServiceNow CMDB so you can access the rich tag context stored as configuration items (CIs) in your CMDB within Datadog’s unified observability platform. By adding this CMDB data to Datadog, your SREs, DevOps engineers, and other monitoring personnel can access critical information that might have otherwise been siloed within your IT organization to more easily correlate infrastructure components and take action to remediate issues. In this post, we’ll discuss how you can use the integration to ingest and leverage:
- Host-level metadata for infrastructure management
- Network device metadata
- Service-level metadata for service management
- Reference tables to enrich events
Enrich your Datadog hosts with CMDB metadata
By ingesting host metadata from ServiceNow as tags into Datadog Infrastructure Monitoring, your DevOps engineers can access helpful context from your organization’s CMDB in their monitoring and remediation workflows—even if they’re siloed from the IT staff who are managing this data. Ingesting host tags into Datadog is as simple as configuring a query builder in ServiceNow to pull data from the CMDB’s host table—as well as tables from other upstream services—and send it to Datadog. Within minutes, host tags will populate in Datadog and you can view them in Infrastructure Monitoring.
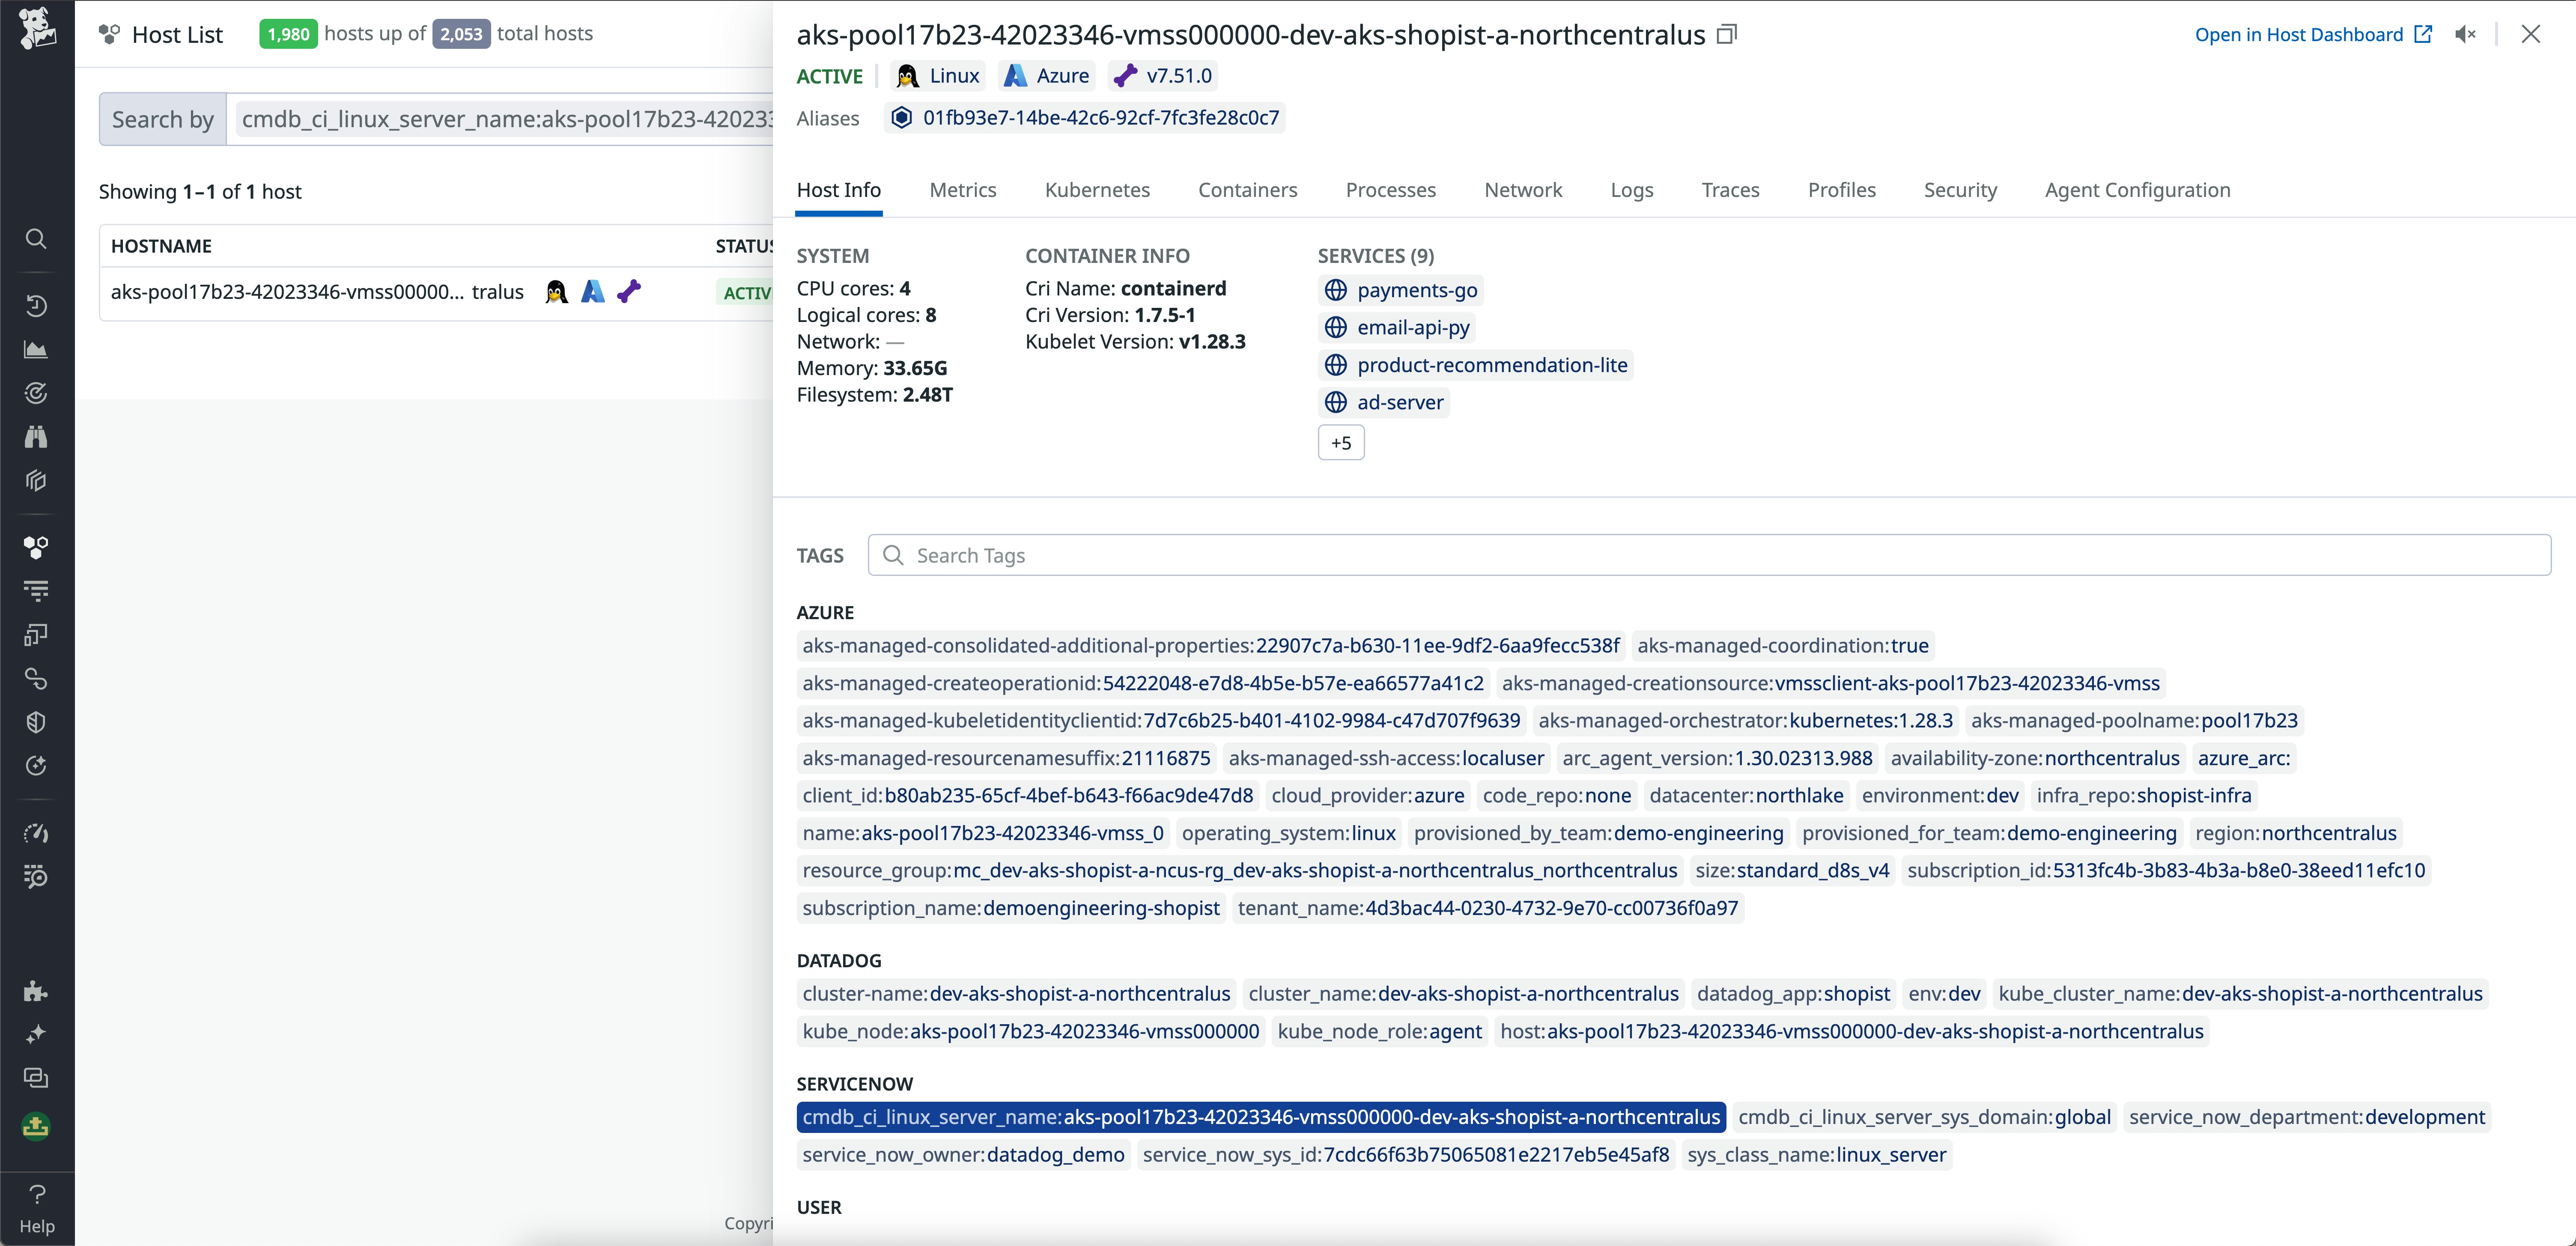
CMDB host metadata often contains key details that can help with triage and remediation of issues and incidents, such as the host location (e.g., the data center of an on-prem host or the cloud region of an Amazon EC2 instance), details about the service that’s running on it, on-call engineers assigned to the service, and the service owner. The integration also maps service dependency relationships stored in the CMDB to your hosts, so you can spot additional dependent services that may experience issues related to a host’s degraded performance. Because Datadog automatically attaches relevant host tags to triggered alerts, on-call engineers can get timely access to this context as soon as they’re pinged about an ongoing issue. This can ultimately speed up MTTR by immediately showing responders which dependencies to look at and who else they can contact.
Enrich your network devices with CMDB metadata
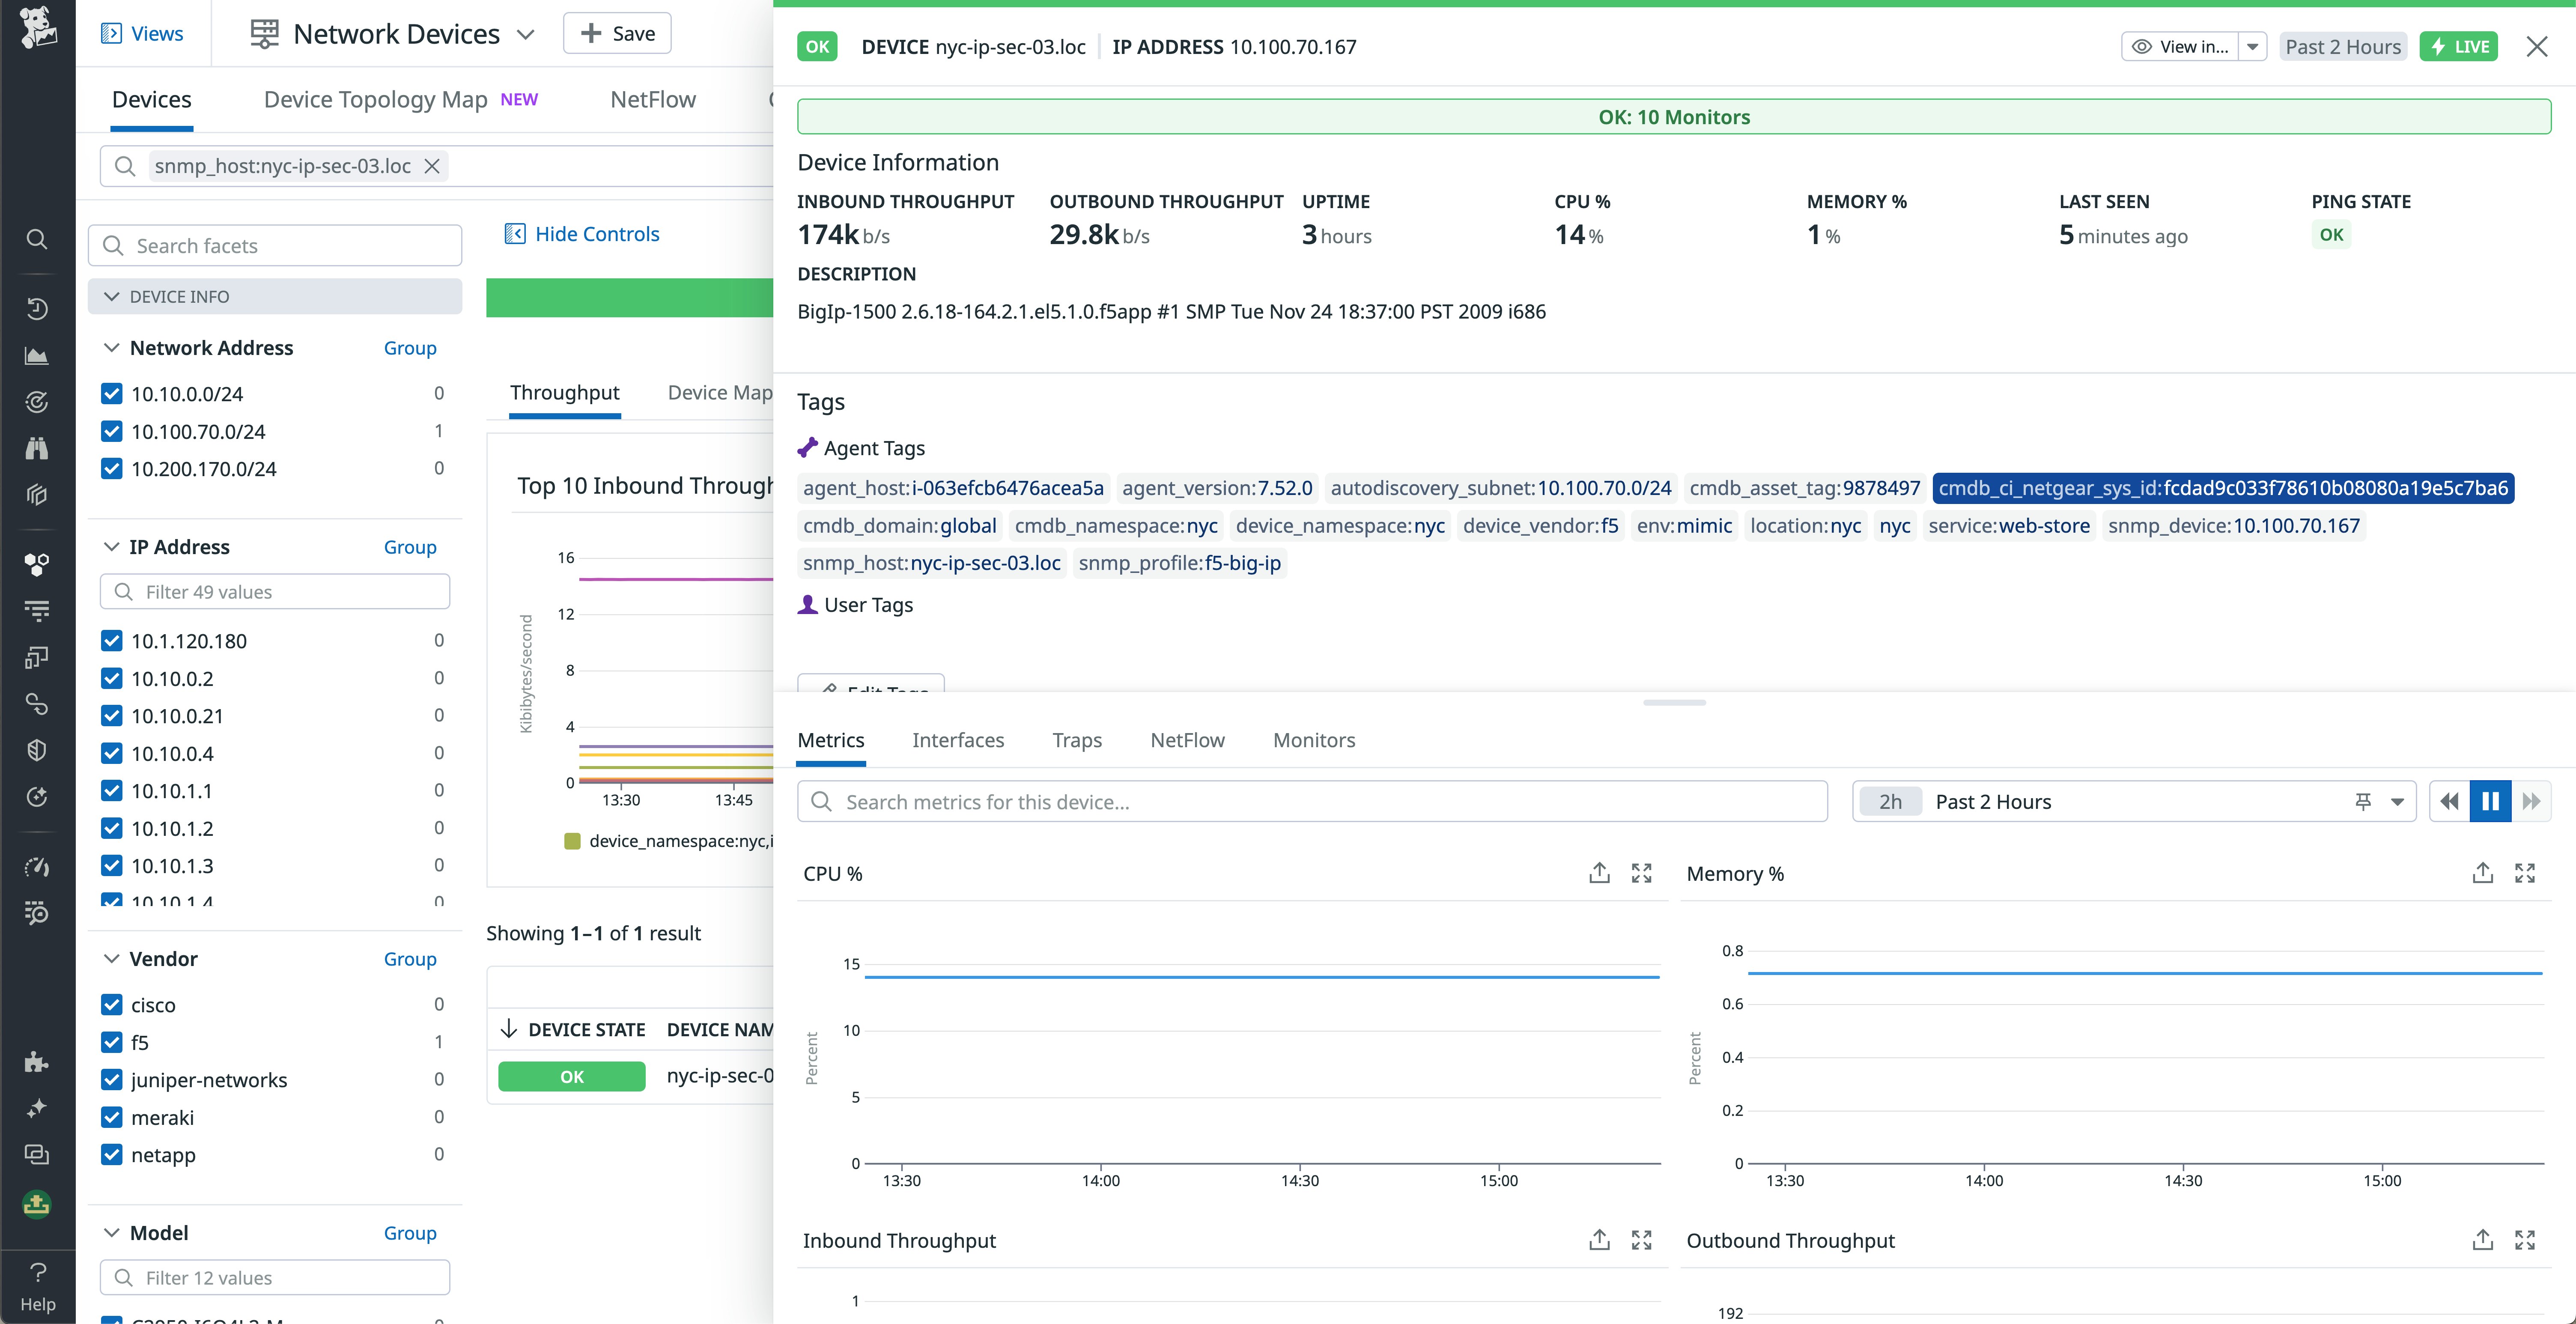
Many network teams rely on ServiceNow CMDB as the source of truth for information about their entire network. The Datadog ServiceNow integration also includes Device Tagging, which enables you to ingest network device tags from your CMDB to enrich your network devices monitored by Datadog Network Device Monitoring (NDM). This works the same way as host tagging—you can simply create a query builder in ServiceNow specifying the tags you want to send to Datadog and then add this query to the integration. NDM provides key network device performance metrics—such as inbound and outbound throughput, CPU, memory, and uptime—for thousands of auto-discoverable devices. By adding context from your CMDB to this view, your network teams can quickly identify the location and owner of a device experiencing issues as well as its dependencies.
For example, let’s say your CMDB contains network device CIs mapping the location of the devices along with their corresponding services and the primary and secondary teams that own them. This means during an investigation, you have the important context in Datadog to identify what applications are impacted, as well as which teams to contact to drill deeper into specific devices experiencing issues.
Get CMDB metadata in the Datadog Service Catalog
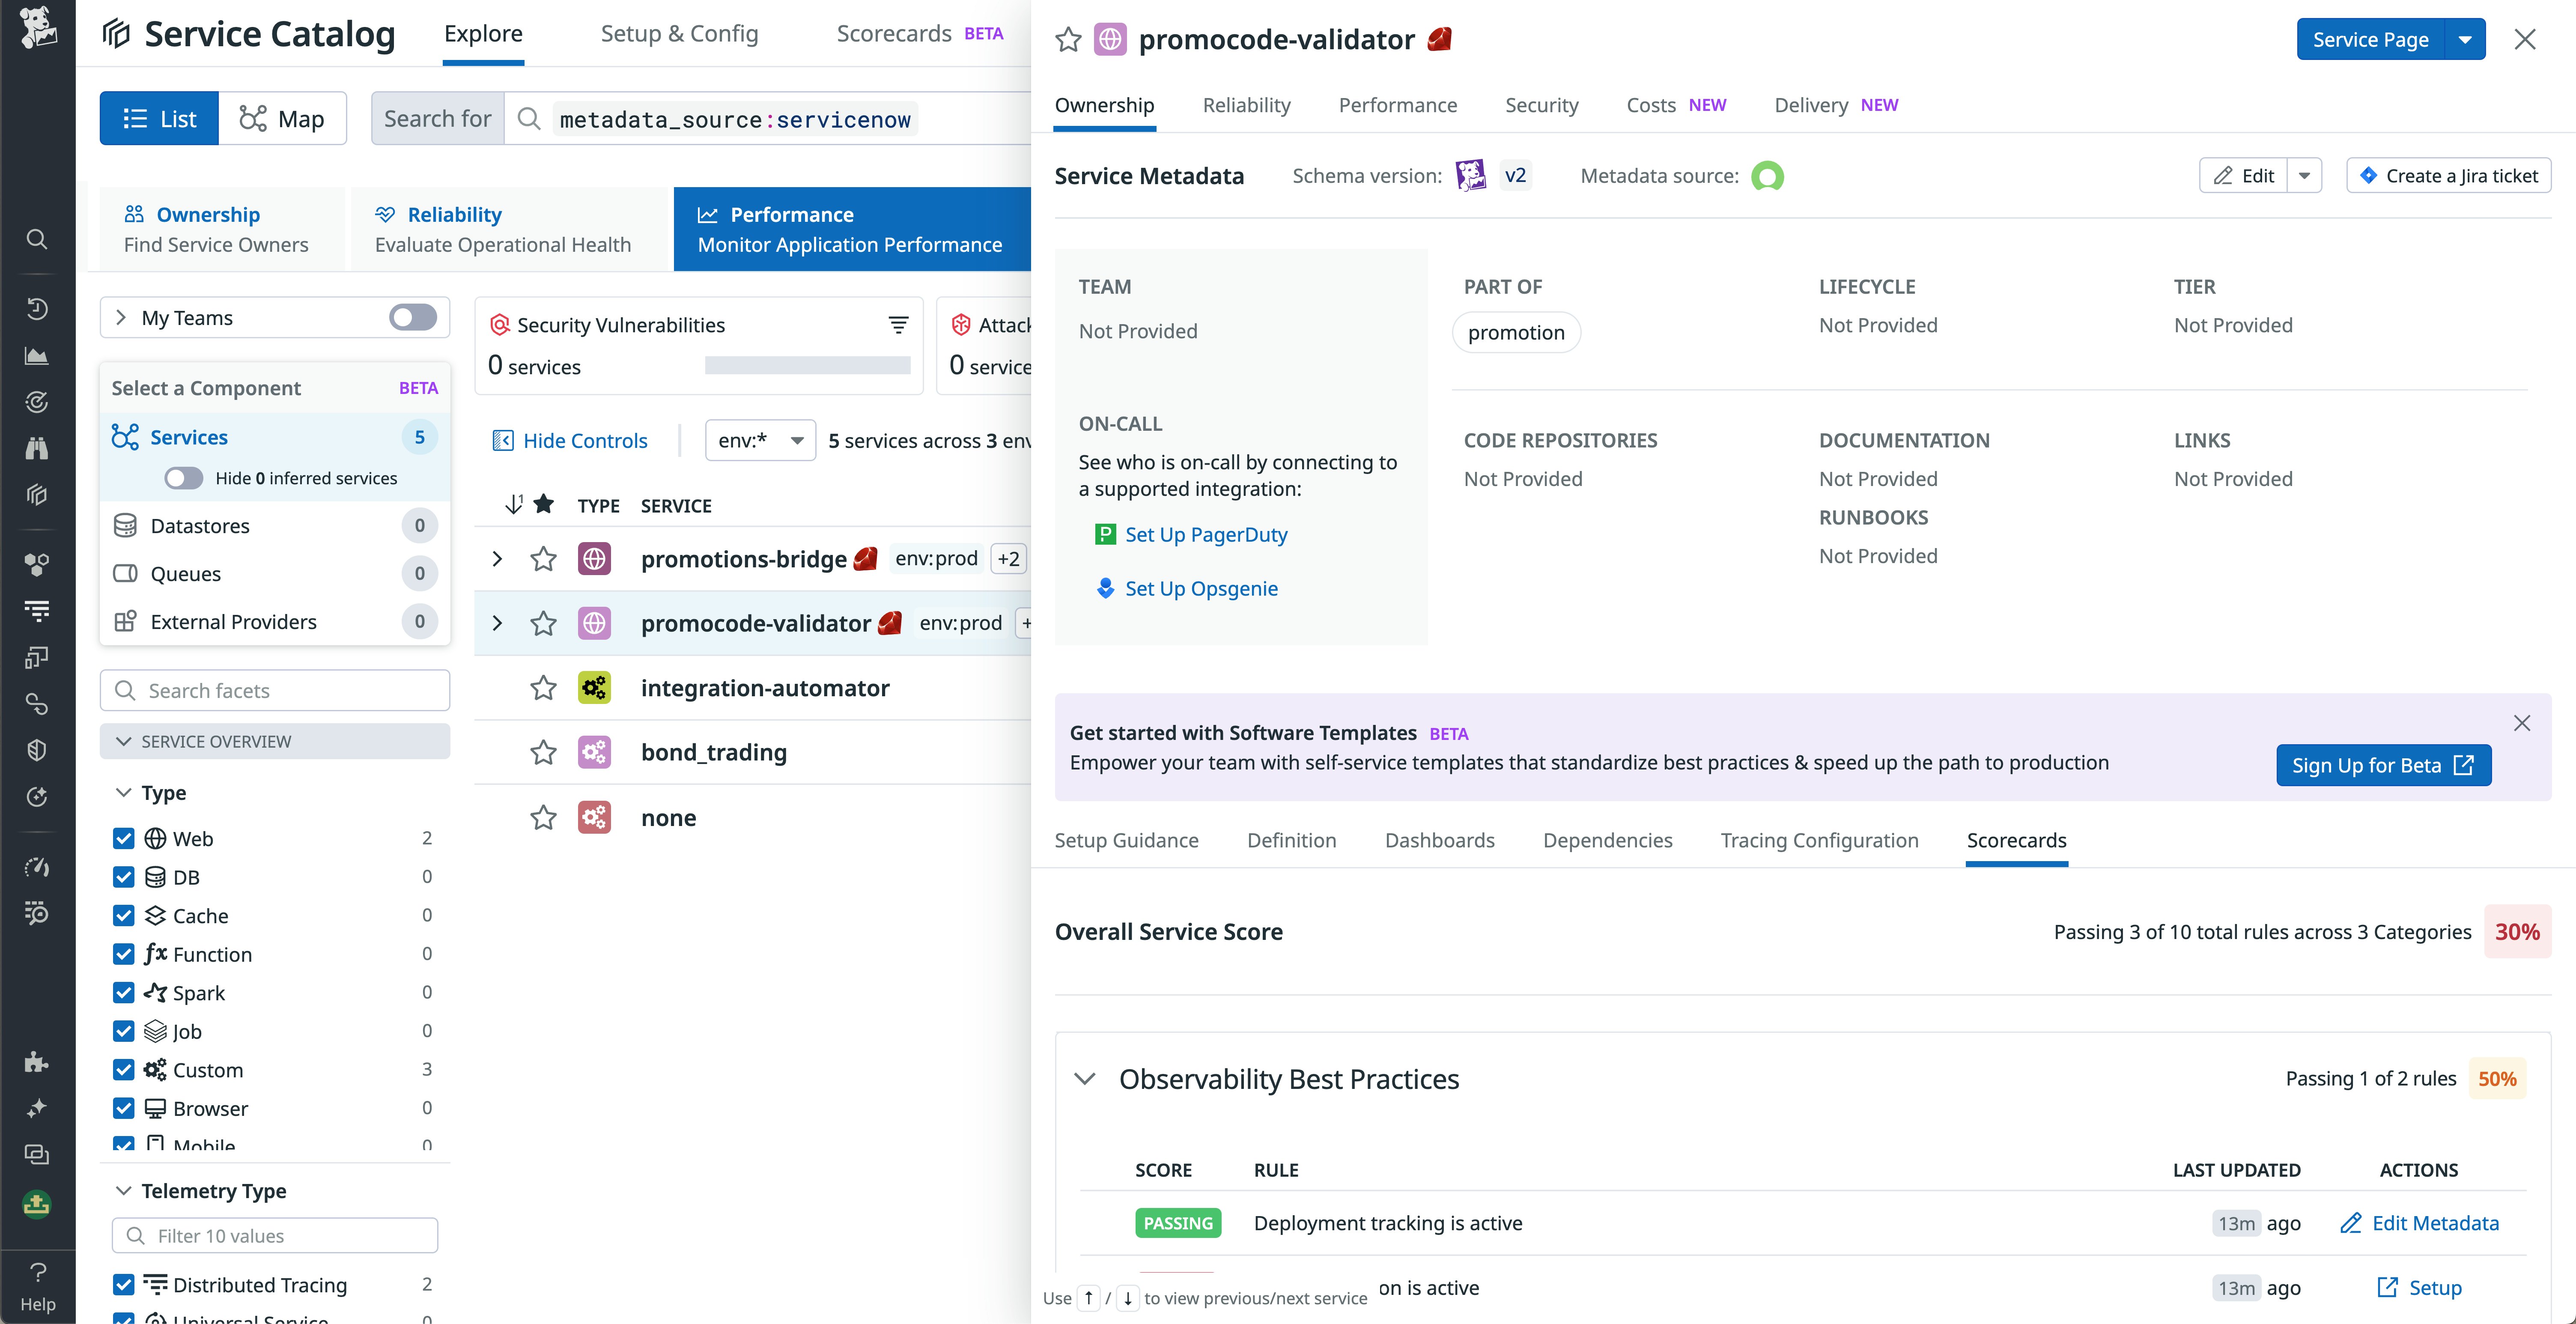
In addition to host and device tagging, the integration also enables you to connect your ServiceNow CMDB’s service metadata to generate tags in Datadog for use in the Service Catalog. If your organization is already keeping a rich volume of service metadata in its CMDB, it can be advantageous to send this data to Datadog so DevOps engineers and other stakeholders can access it without context switching.
The Service Catalog provides an overhead view of the health, performance, and ownership of all the services in your environment, centralizing documentation, scorecards, deployment tracking, incidents, and other assets. By using the integration, you can import service ownership metadata, infrastructure and service dependency relationships, and more from your CMDB to view alongside the rest of the context provided by Service Catalog. This helps you leverage your CMDB to establish a centralized source of truth about your services’ health and status.
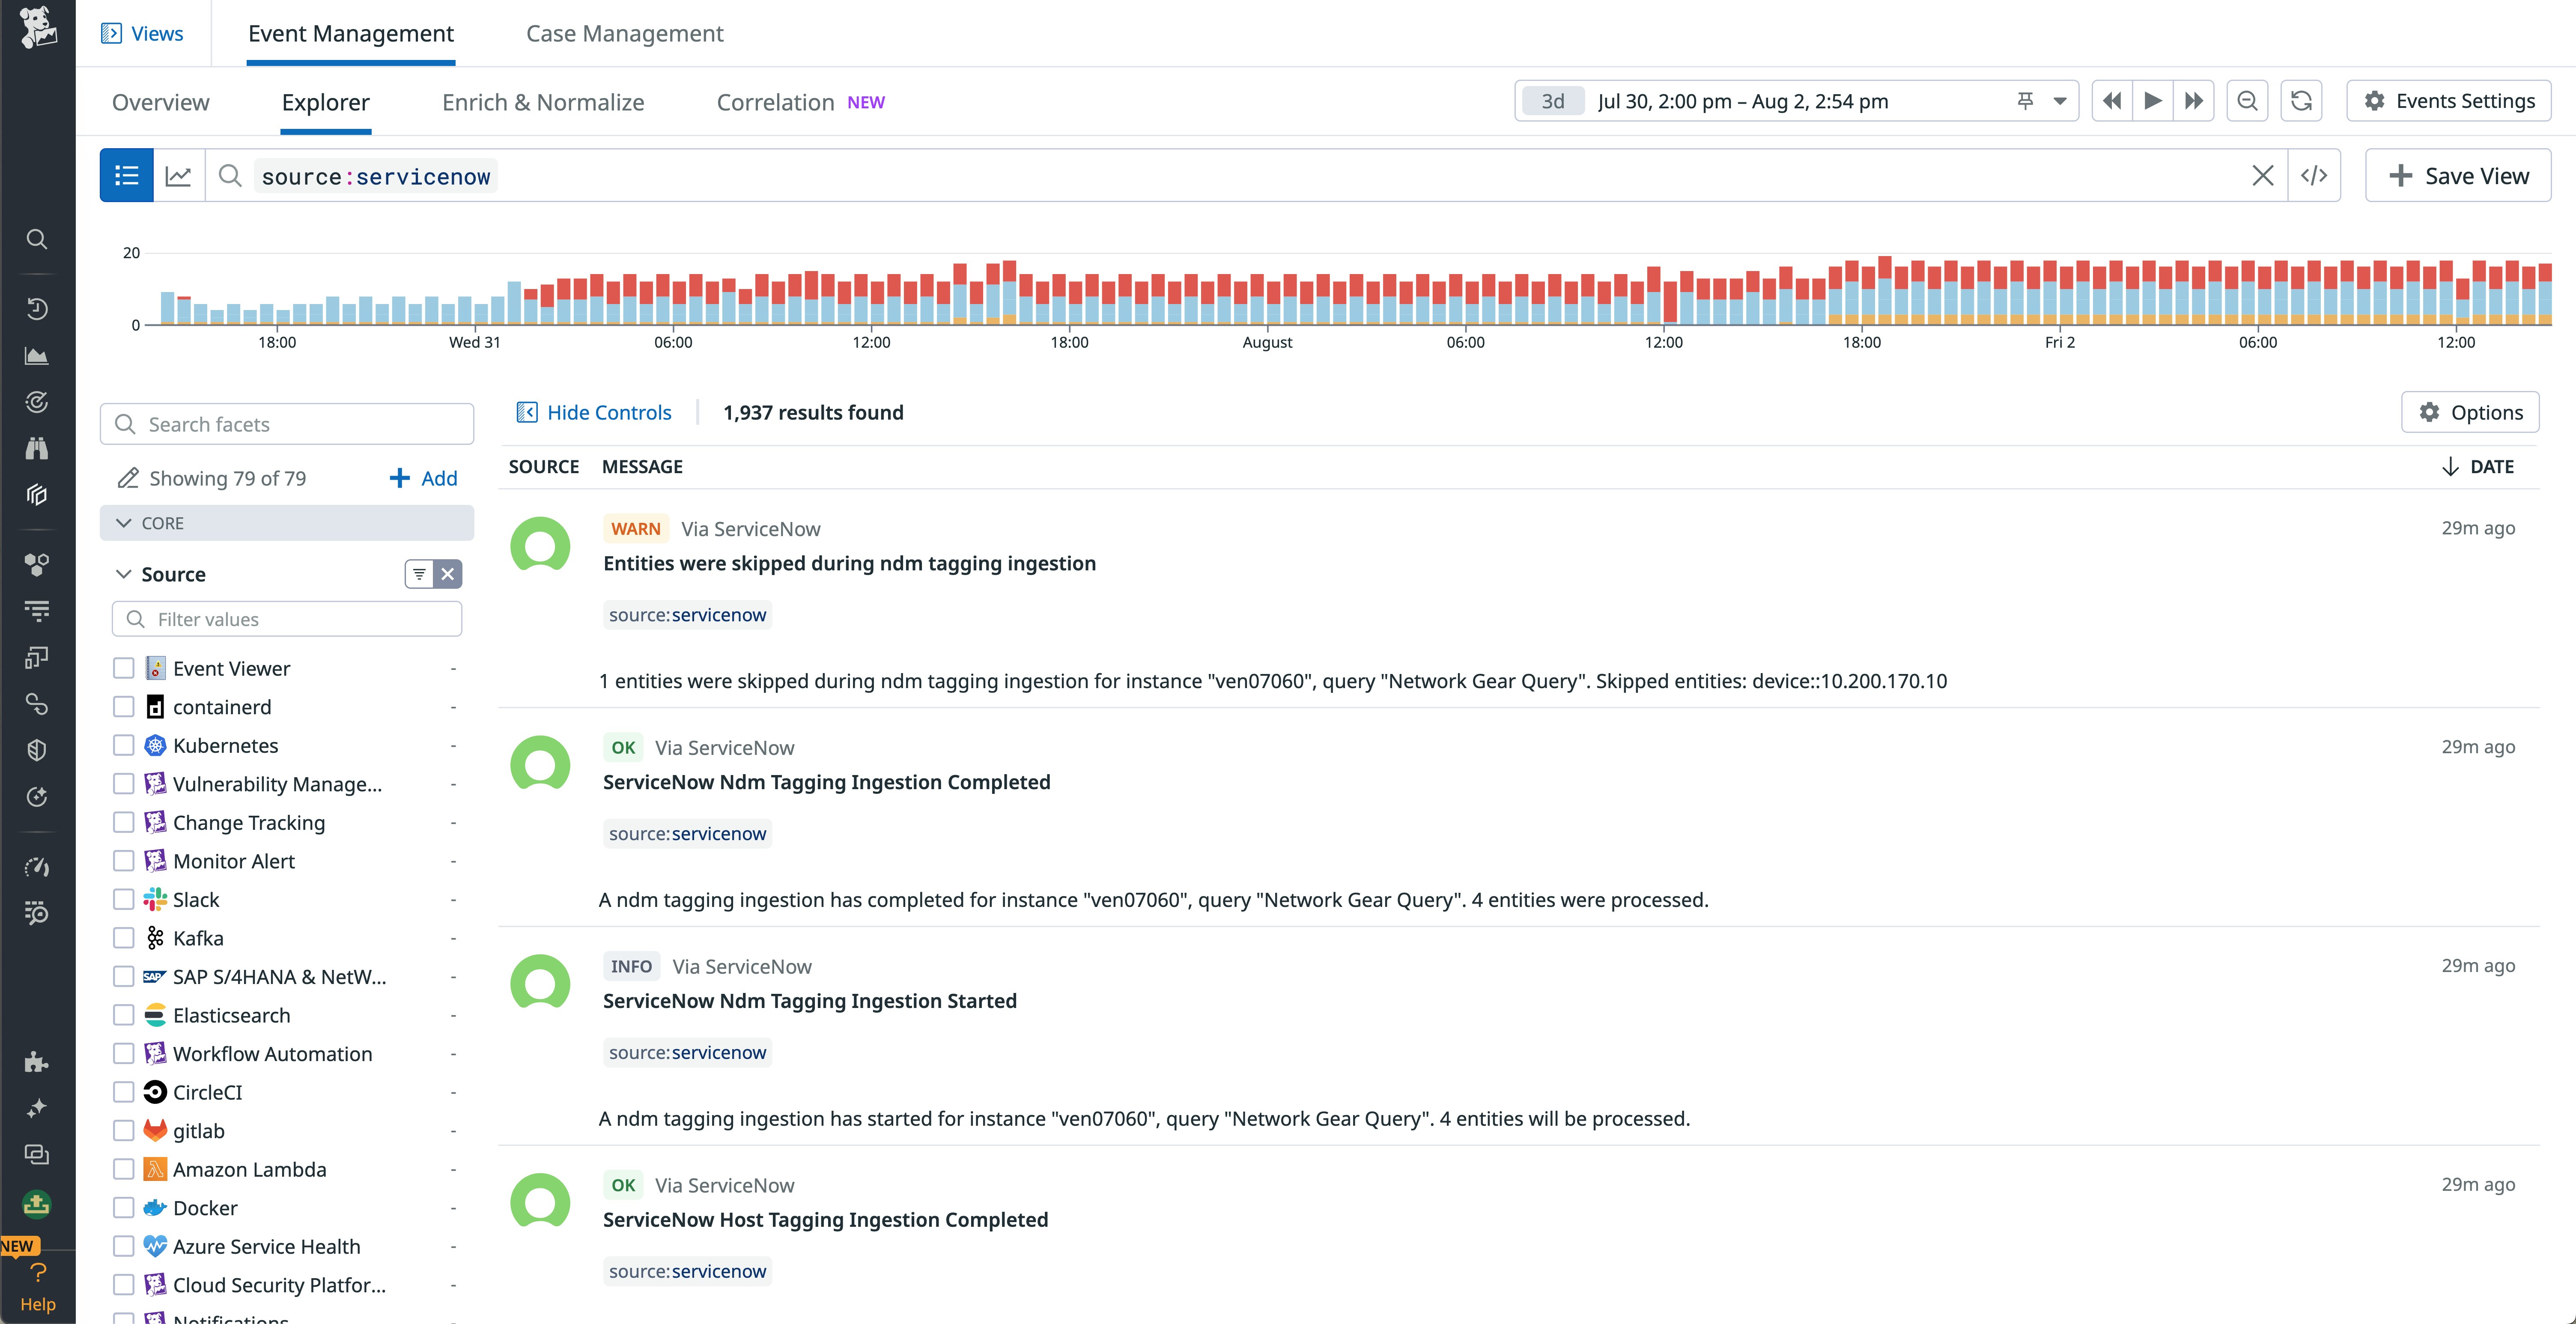
To help you track the ingestion of CMDB tags from ServiceNow, the integration also submits tagging ingestion events to Datadog that you can track with Event Management. These ingestion events tell you when tag ingestion jobs are started and ended for all host, network device, and service tags. You can also use these events to be notified when entities are skipped during ingestion, helping you spot cases where some CIs are not successfully added to Datadog.
Enrich logs and events with CMDB reference tables
The integration also enables users to use Datadog Reference Tables to automatically enrich logs and events with additional fields from your ServiceNow CIs. Reference Tables let you map sets of value fields to a primary key (such as hostname) and automatically add these fields to all the logs or events that contain the key you specified. With the integration, you can configure a Lookup Processor to routinely update the tables when a new query is made in the ServiceNow query builder—so you don’t have to manually upload a new .csv file each time your data changes. For example, let’s say you want to enrich traffic logs from your network devices with ownership and location data from your CMDB. You can accomplish this using a Reference Table with the device ID field as a primary key and the CMDB fields as values.
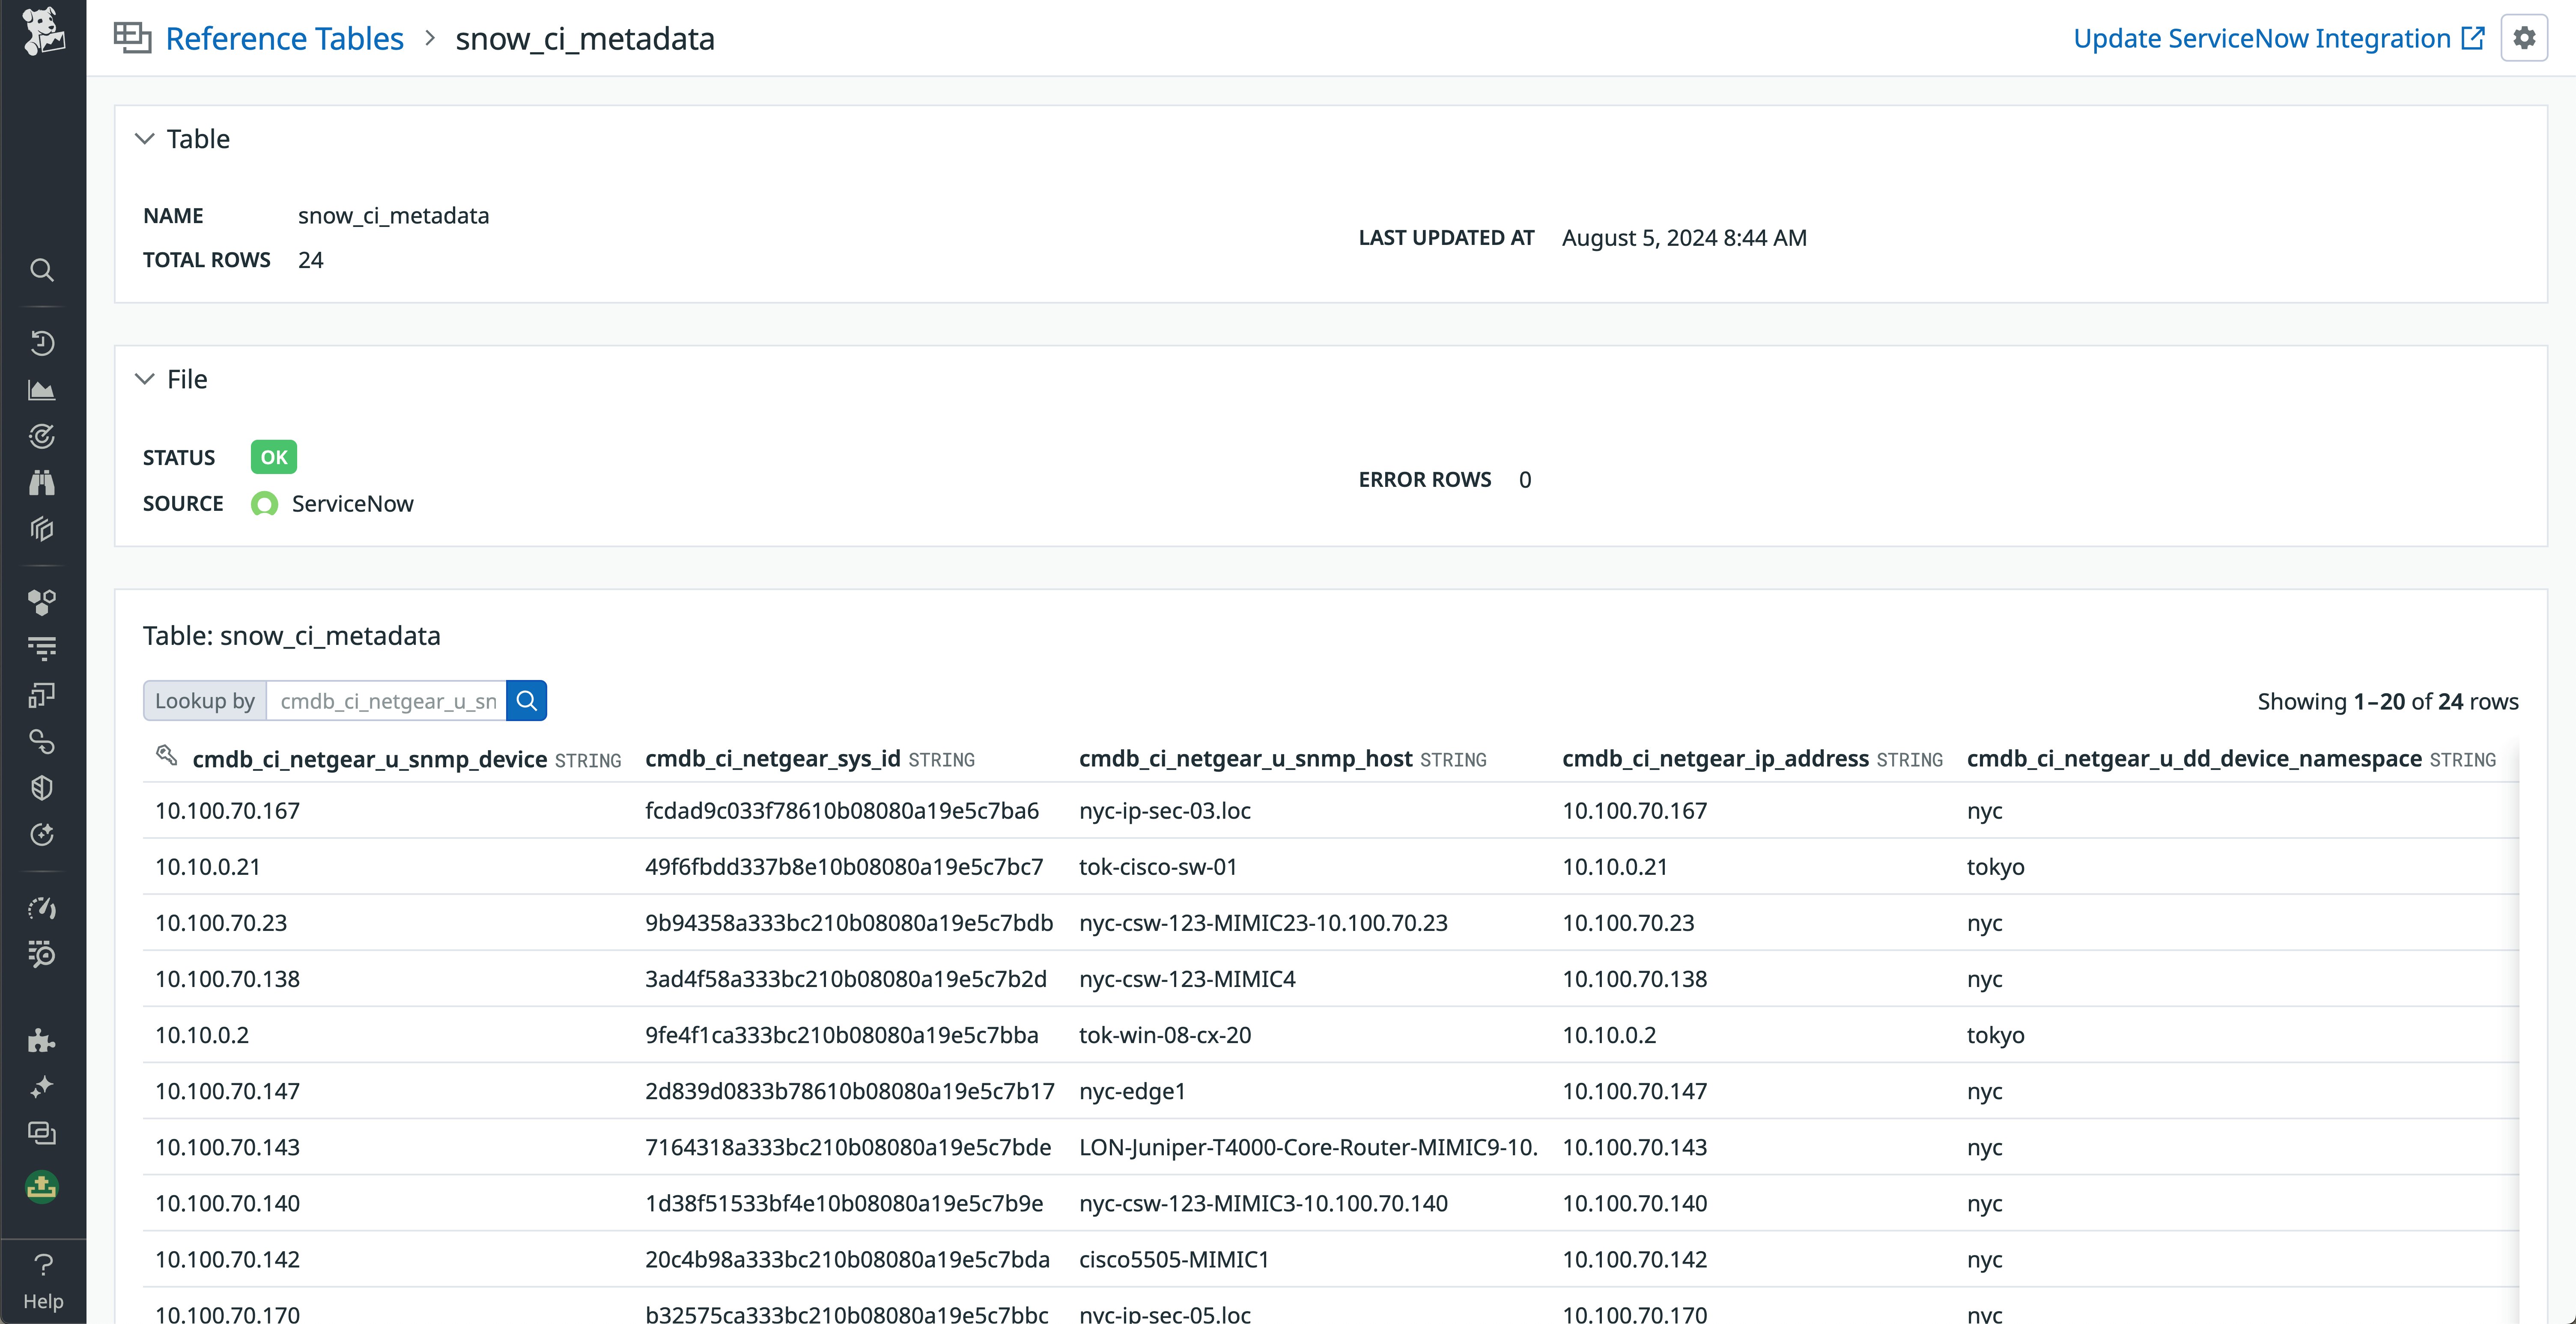
This way, when a device is experiencing slow or failed requests, investigators can look in the traffic logs to quickly find who to contact. You might also create tables to associate useful information about the devices themselves, such as what firmware they’re running or when they were last serviced. Datadog Log Management lets you form metrics from these logs to alert on, track outliers detected automatically by Watchdog, and consolidate them with other key insights using dashboards, so it’s easy to leverage your logs to track and diagnose issues.
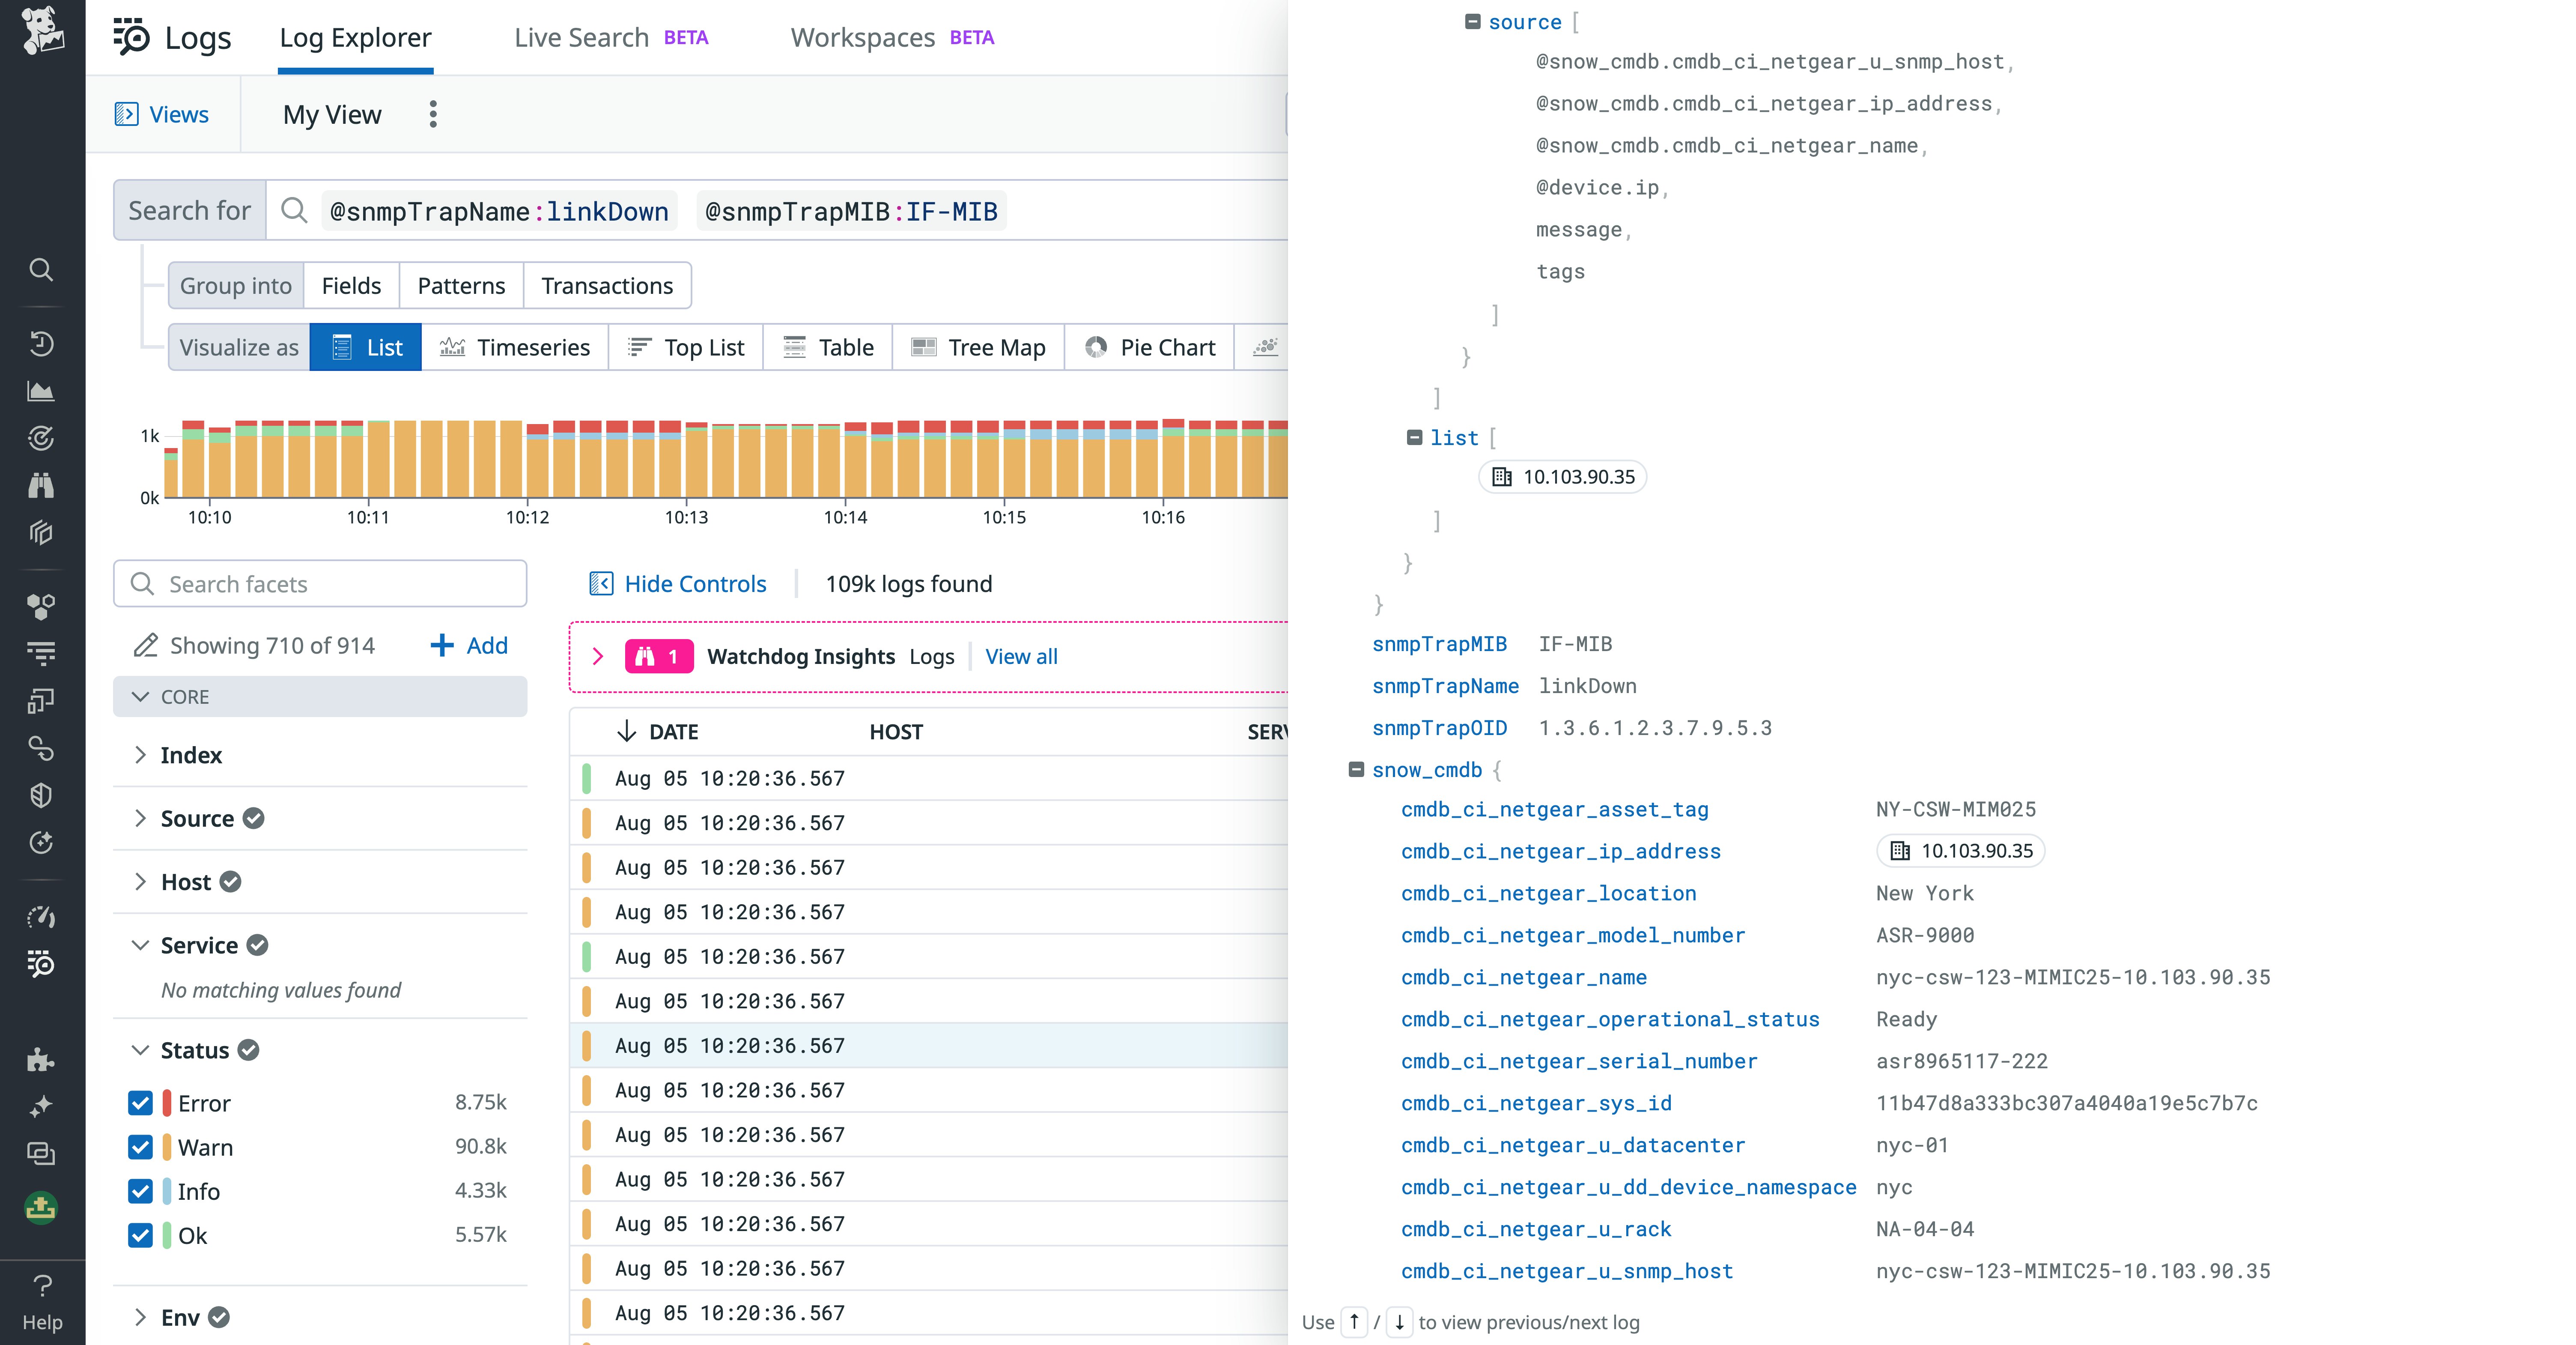
Additionally, the table will automatically add the values from your Reference Table to any events containing the primary key, including ones generated from alerts, Watchdog outliers, and more. This enables you to easily correlate all these events simply by forming queries with your CMDB values. By filtering your events stream to correlate all the events related to a particular device, you can reduce the amount of noise in your view and quickly access a wealth of information about that device’s status in one place.
Get started with ServiceNow CMDB and Datadog
Datadog’s ServiceNow CMDB integration gives your DevOps and application engineers easy access to IT management data from within Datadog’s unified observability platform. By integrating ServiceNow CMDB and Datadog, you can better leverage the wealth of data already kept in your organization’s CMDB to make monitoring, troubleshooting, and incident response more efficient. You can also integrate ServiceNow IT service management (ITSM) and IT operations management (ITOM) with Datadog to drive ServiceNow ticketing from Datadog events, cases, and incidents. For more information about this integration, see our documentation. Or if you’re brand new to Datadog, sign up for a free trial to get started.


