Florian Engelhardt
A few months ago, we implemented support for exception profiling in PHP. One of the key justifications for building this functionality into Continuous Profiler was to show the hidden costs of exceptions in PHP, especially when they are used for flow control in hot code paths.
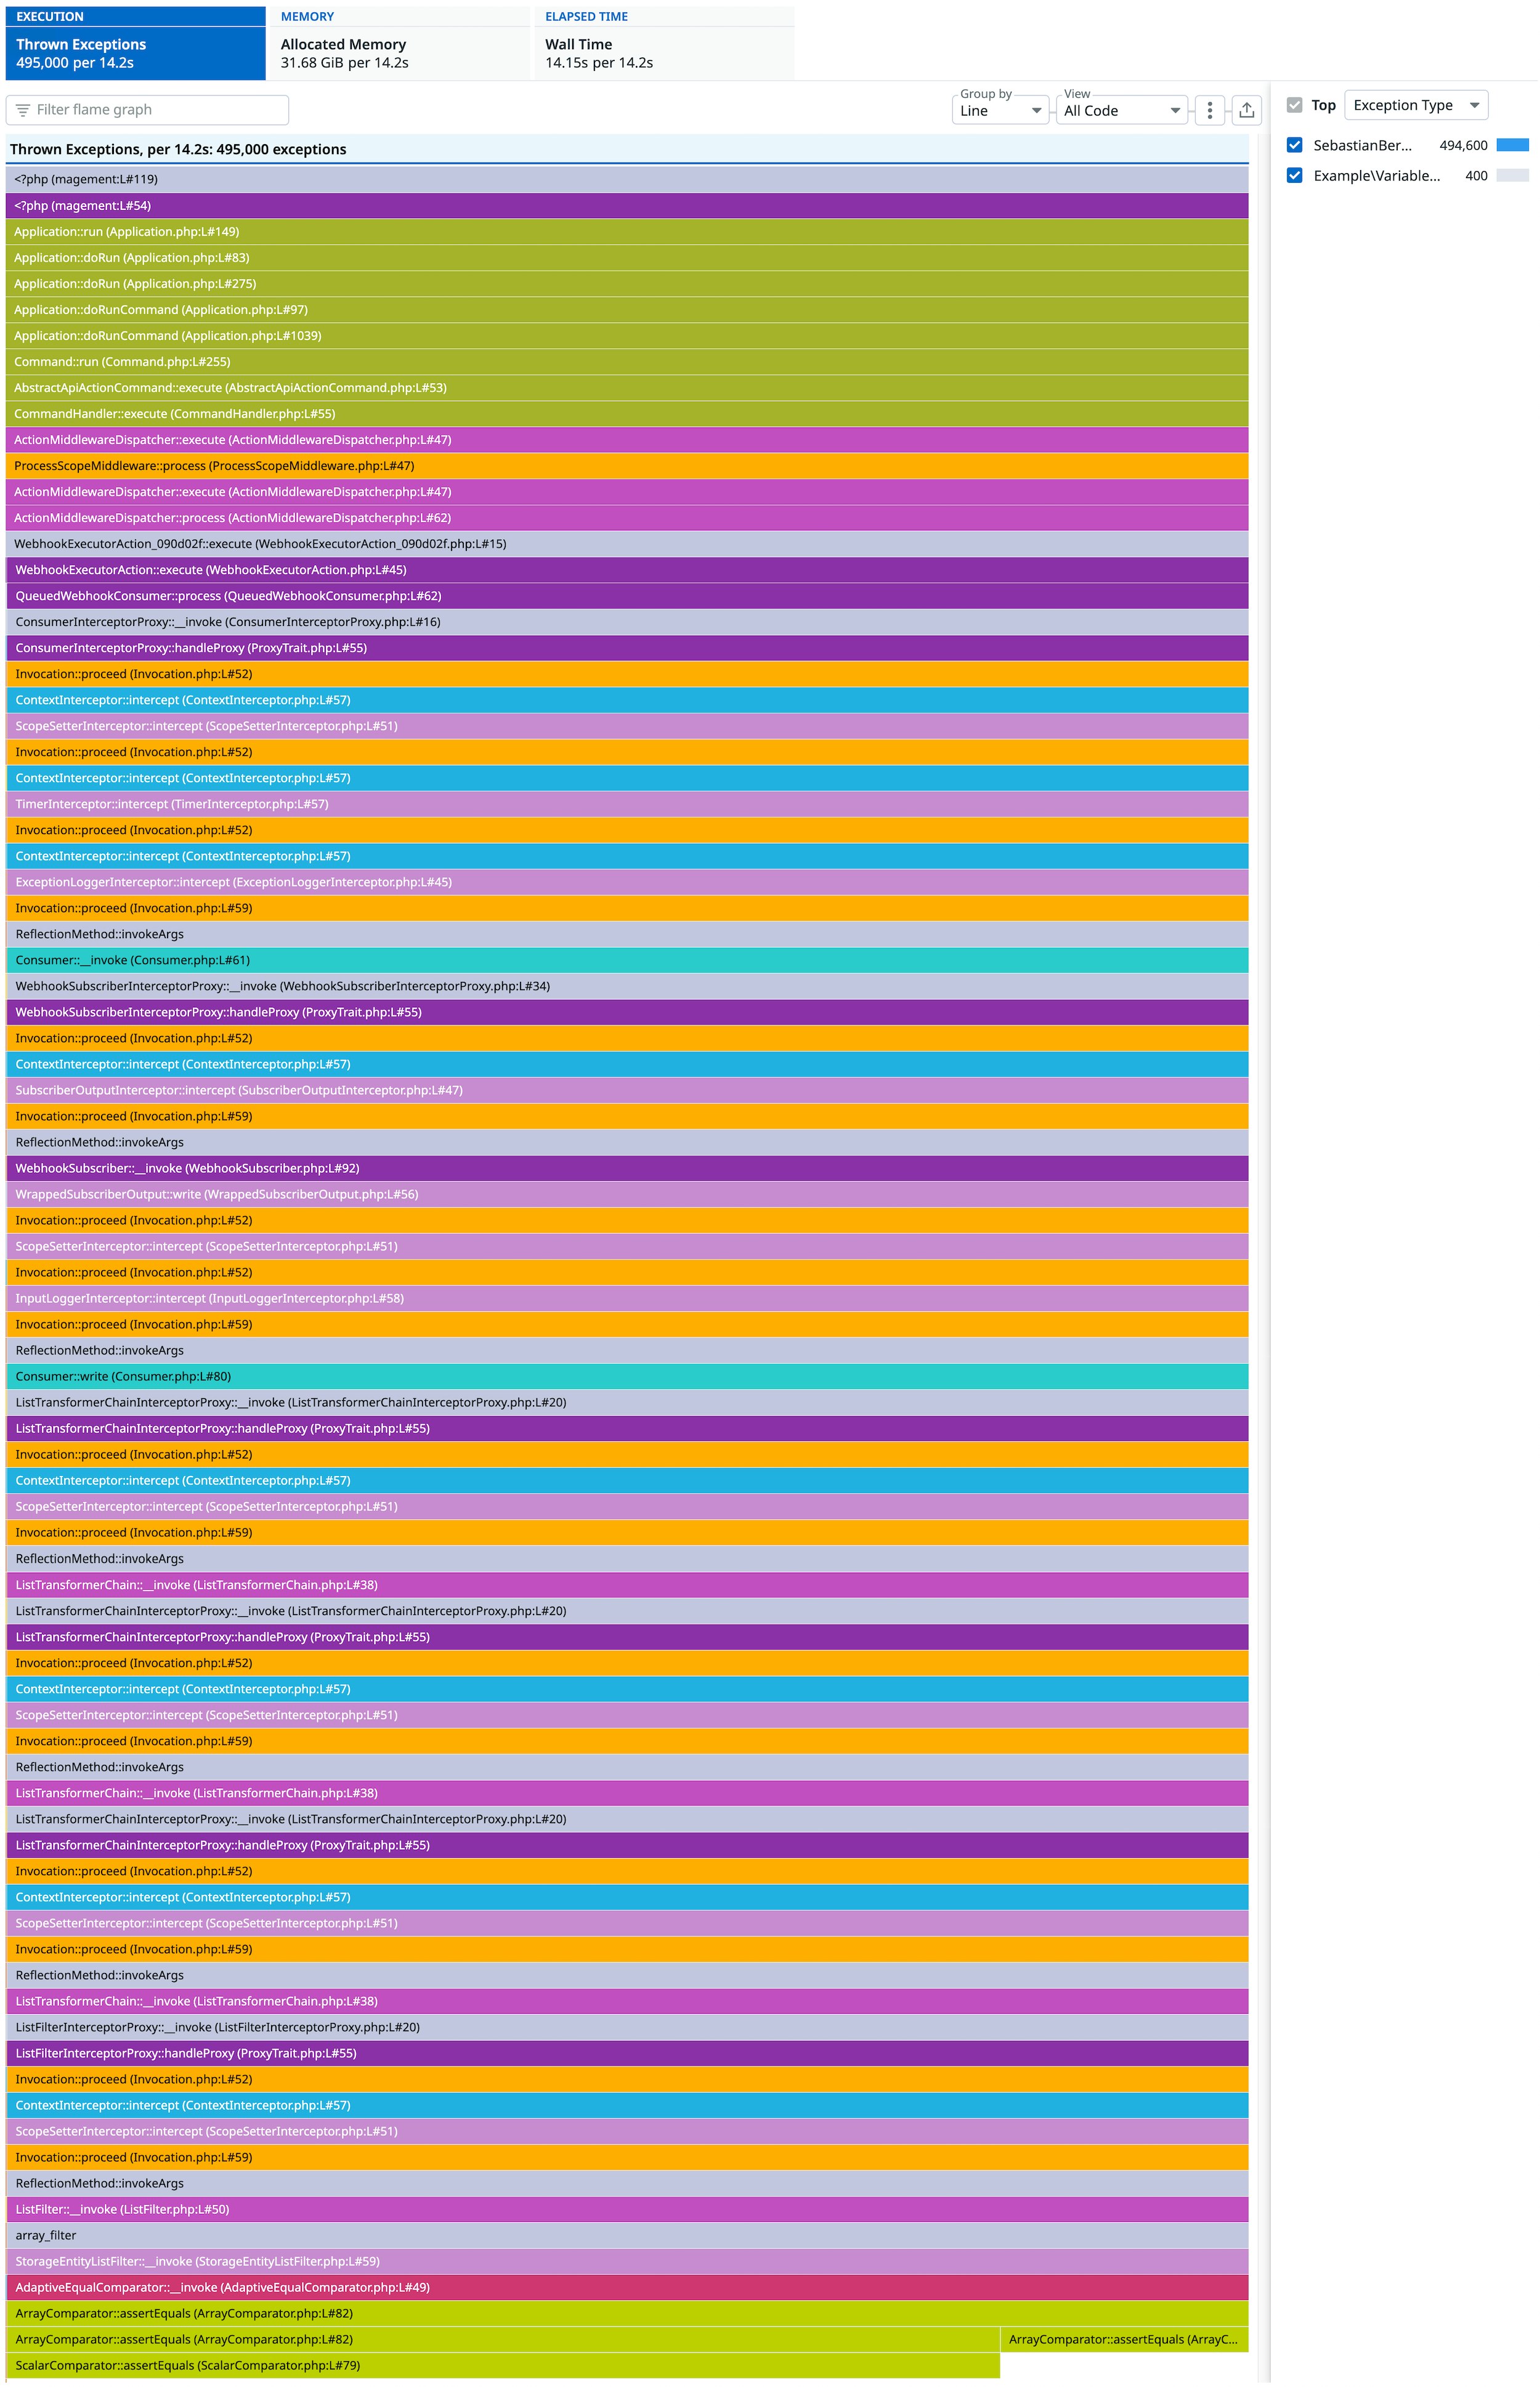
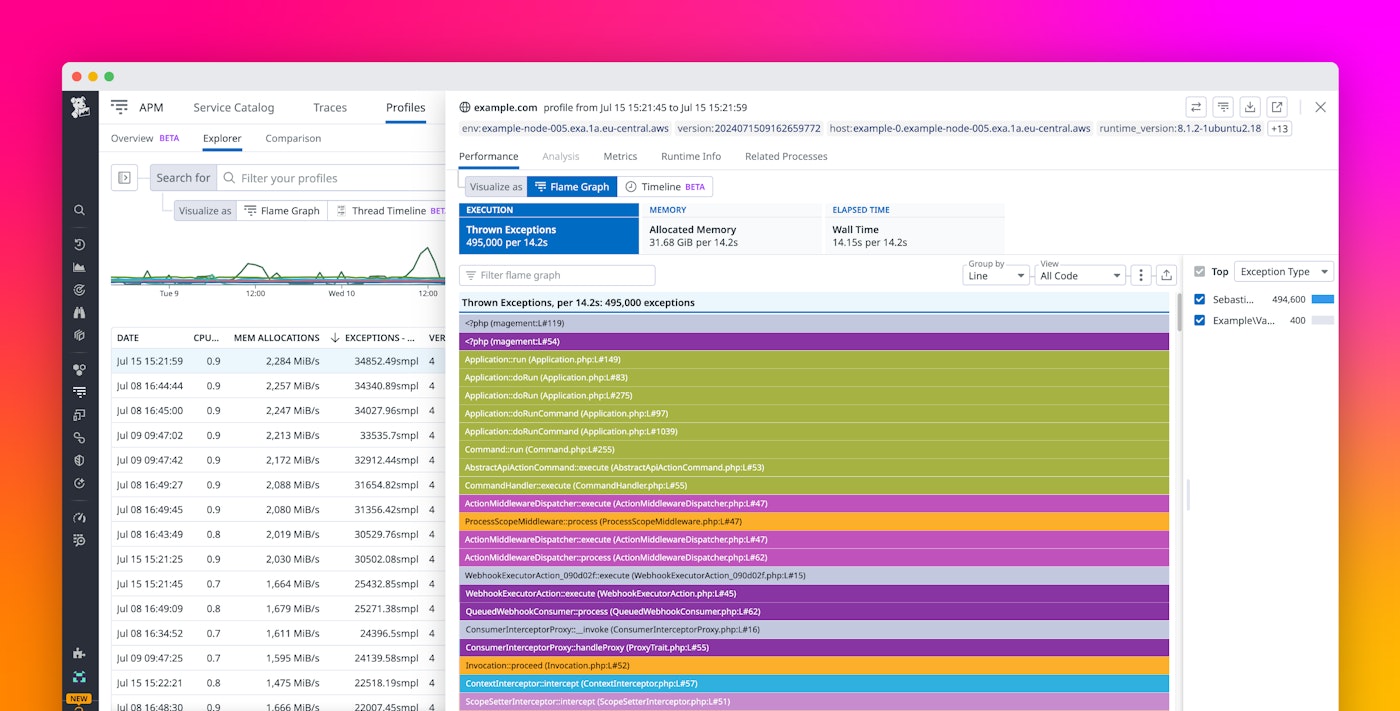
Once this feature was built, we naturally wanted to know if it surfaced these kinds of flow control problems in customer production systems. We peeked into an otherwise fully operational service, and the profiler showed that this application was throwing 495,000 exceptions per 14.2 seconds:

Is this a lot?
In PHP, the engine collects the call stack whenever an exception object is created. In some other languages, you can collect the call stack on demand, which makes it cheaper if the exception handler doesn’t need the stack trace. PHP doesn’t have this optimization. Take the example of the call stack in the screenshot above, which is 85 frames deep. Regardless of whether or how you handle the exception, the engine still has to walk all 85 frames and gather the file names, line numbers, class and method names, etc.
You can see for yourself how expensive it is by running this snippet:
<?phpfor ($i = 1; $i <= 84; $i++) { eval("function a$i() { a" . ($i + 1) . "(); }");}
function a85() { $start = hrtime(true); for ($i = 0; $i < 495_000; $i++) { try { throw new \Exception("Exception"); } catch (\Exception $e) { } } $end = hrtime(true); echo "Took: ", (($end - $start) / 1_000_000_000), " seconds", PHP_EOL;}
a1();This will create functions a1() through a85() to emulate a call stack 85 frames deep, like in the example above, and then throw 495,000 exceptions.
When we run this on a Intel Xeon x86_64 AWS instance with PHP 8.1.29—the same used with the service that produced the above flame graph—we see the following number:
$ php test.phpTook: 3.27450256 secondsIn the example above, the service has run for 14.2 seconds, of which it has spent 3.274 seconds in creating and throwing exceptions—a whopping 23.05 percent of the total CPU time. But that’s not all: Checking the allocation profiler reveals that this script allocates 31.68 GiB in 61,964,473 allocations, putting a lot of pressure on the Zend Memory Manager.
So yes, this is a lot!
What is going on here?
To compare two scalar values in an array_filter() callback, the application uses the sebastian/comparator library, which offers several comparators that all expose a public assertEquals() method. This method is declared as returning void; that is, it throws an exception in case the values differ and does nothing if the values are equal.
/** * @throws ComparisonFailure */abstract public function assertEquals(mixed $expected, mixed $actual, float $delta = 0.0, bool $canonicalize = false, bool $ignoreCase = false): void;The performance problem arises from the fact that in most cases the values differ, and exceptions are therefore being created and thrown.
All of the library’s behavior is expected in its natural habitat, which is PHPUnit (when one assertion fails, there is no need to run other assertions in that test anymore). Additionally, the thrown ComparisonFailure exception offers a getDiff method, which shows the difference between the expected and the actual value. This feature is super useful in PHPUnit but not used here.
It is just the wrong library for the problem at hand.
So what does exception profiling surface?
Exceptions are generally being used in cases where we as developers have certain expectations about the current state that are not met at that time. These cases could include exceptional situations, limitations in the type system that forces us to do runtime checks, or cases that we know are possible but just don’t foresee happening. If we would rather not pollute the happy path with these corner cases (by making the return type nullable or returning a Null-Object), we can just throw an exception.
If all of these remain corner cases, everything is fine. However, if these corner cases become the hot path, you might start seeing non-negligible overhead from creating and throwing these exceptions—just as we have seen above.
Hygiene and cleaning up your exceptions
There will be cases where exception profiling will show a few exceptions that do not result in performance issues. But even if these exceptions aren’t especially common, it often makes sense to clean them up so that they aren’t thrown unnecessarily. For example, during or after an active incident, you don’t want to spend time looking at exceptions and wonder, “Is this specific exception related to the problem at hand?” It’s better to remove all extraneous exceptions so that you have a clean view of the issue.
When we reviewed our own testing applications, the profiler surfaced two exceptions that were related to configuration mistakes. These were not performance-sensitive, which shows how the profiler can be helpful outside of looking at performance issues:
Environment variable not set
We saw a Symfony-based application throwing 6,500 EnvNotFoundException-type exceptions per 67 seconds. From the messages given with this exception, we saw that the application was missing the APP_RUNTIME_ENV and APP_RUNTIME_MODE environment variables. By setting these variables, we got rid of those 6,500 exceptions.
Resource bundle not found
In the same Symfony application, some locales were missing from the symfony/intl component, causing it to throw ResourceBundleNotFoundException-type exceptions.
Looking at the enabled_locales key in the config/packages/framework.yaml file revealed that there were many locales enabled:
enabled_locales: ['ar', 'bg', 'bn', 'bs', 'ca', 'cs', 'de', 'en', 'es', 'eu', 'fr', 'hr', 'id', 'it', 'ja', 'lt', 'ne', 'nl', 'pl', 'pt_BR', 'ro', 'ru', 'sl', 'sq', 'sr_Cyrl', 'sr_Latn', 'tr', 'uk', 'vi', 'zh_CN']Woah! We don’t use all these locales. After we removed everything except en from this list, another 13,500 exceptions per 67 seconds were gone. Of course, if we needed these locales, we could have resolved this problem by installing the locales instead.
How do I get this?
Exception profiling was added to dd-trace-php in version 0.92 and is enabled by default in version 0.96. And starting with version 0.98, you are also able to collect the exception message with the sample. (Note that this feature is disabled by default because it could potentially leak PII data. You alone are aware if this would be the case for your application.)
One more thing
The exception profiler is a sampling profiler. As a result, the more often an exception is thrown, the more likely it will show up in the flame graph—and these frequent exceptions are also the most interesting exceptions from a troubleshooting standpoint. Additionally, the Datadog exception profiler will also collect exceptions that are caught and handled. Many other products will collect only uncaught exceptions and thereby miss important use cases—like the above example—where large amounts of exceptions are thrown for control flow.
For more information about Datadog’s Continuous Profiler, see our documentation. And if you’re not yet a Datadog customer, you can sign up for our 14-day free trial.
“HaPHPy” profiling!


